Geoprocessing Model - ModelBuilder
arcgispro
geospatial
map
esri
In this project we will learn three ways for storing and automating multiple-operation workflows. Workflow definition, storage, and automation facilitate and standardize geospatial solutions. These capabilities are especially useful for organizations that anticipate performing a workflow many times.
- Automating tasks — This feature allows we to walk the user through a series of predefined steps that can incorporate (or call) commands and geoprocessing tools, including model and script tools. It can serve as a best practices or a workflow tutorial—a documented series of instructions that call forth the correct commands or tools. And the tasks can be shared as part of a project, allowing users to share their knowledge.
- ModelBuilder™ — a geoprocessing environment that allows we to easily link one tool to another and run a set of operations one after another. ModelBuilder provides a helpful visual diagram of geoprocessing workflows and includes advanced capabilities such as looping and if-then scenarios.
- Automate with Python — We will write a command and use a custom script tool (created with Python) that performs multiple operations.
Study case scenario
We are employed by a nonprofit agency whose primary objective is to raise awareness of and develop solutions for international human rights violations. Taking advantage of the public information offered by the Armed Conflict Location and Event Data (ACLED) project, we are creating maps that convey the impact of political violence in developing countries. We will present our maps at an international human rights conference for eventual incorporation into an awareness campaign.
The Dataset
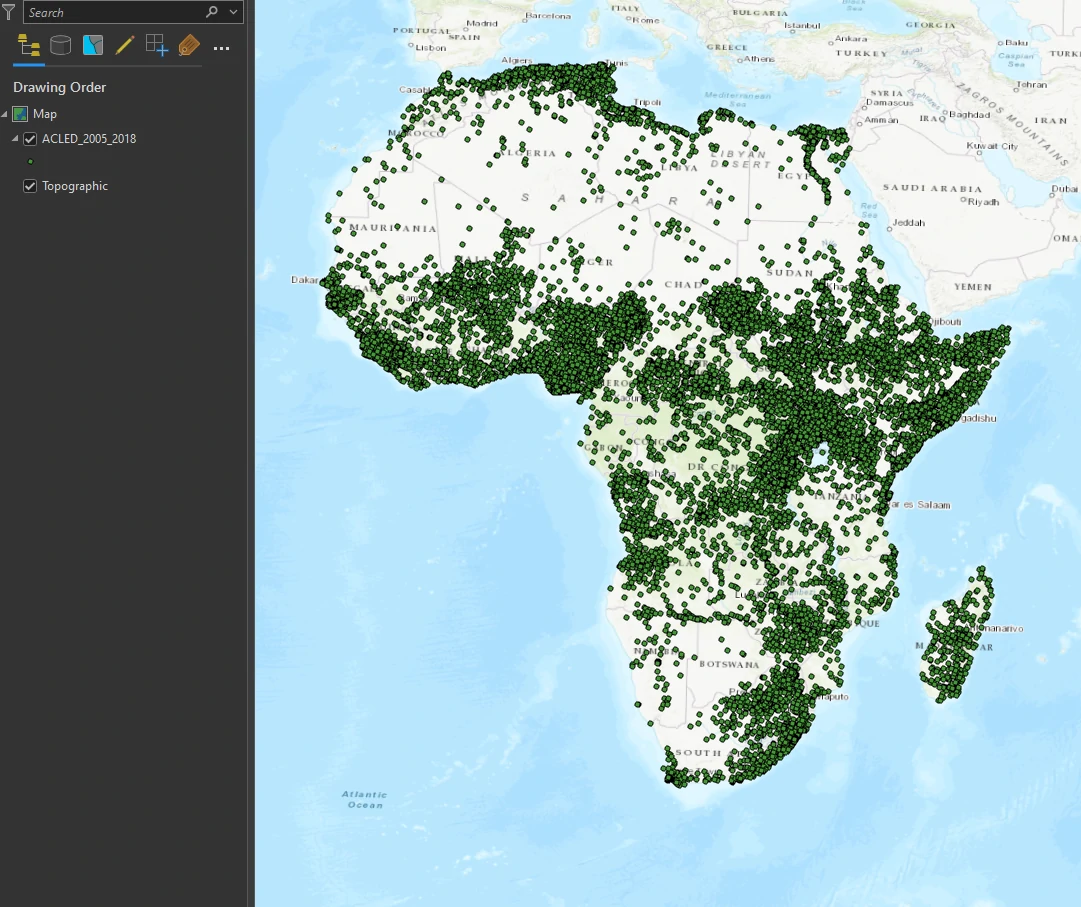
The ACLED dataset we are using provides information on political violence in developing countries. Attributes include dates of conflict events, key actors involved (such as military forces, protesters, rebel groups, civilians, and others), and event classification (such as riots and protests, battles, nonviolent activities by conflict actors, violence against civilians, and more). In this project, We will focus on African continent.
ACLED_2005_2018 — a point feature class that displays locations of armed conicts throughout Africa from 2005 to 2018 (Source: ACLED).
ModelBuilder
ModelBuilder, packaged within ArcGIS Pro, is a design environment for creating spatial analysis workflow diagrams. The diagrams we make are called models, and they have many advantages. A model allows us to string multiple geoprocessing tools together and run them automatically with the click of a button. The output of one process becomes the input for the next process, and so on.
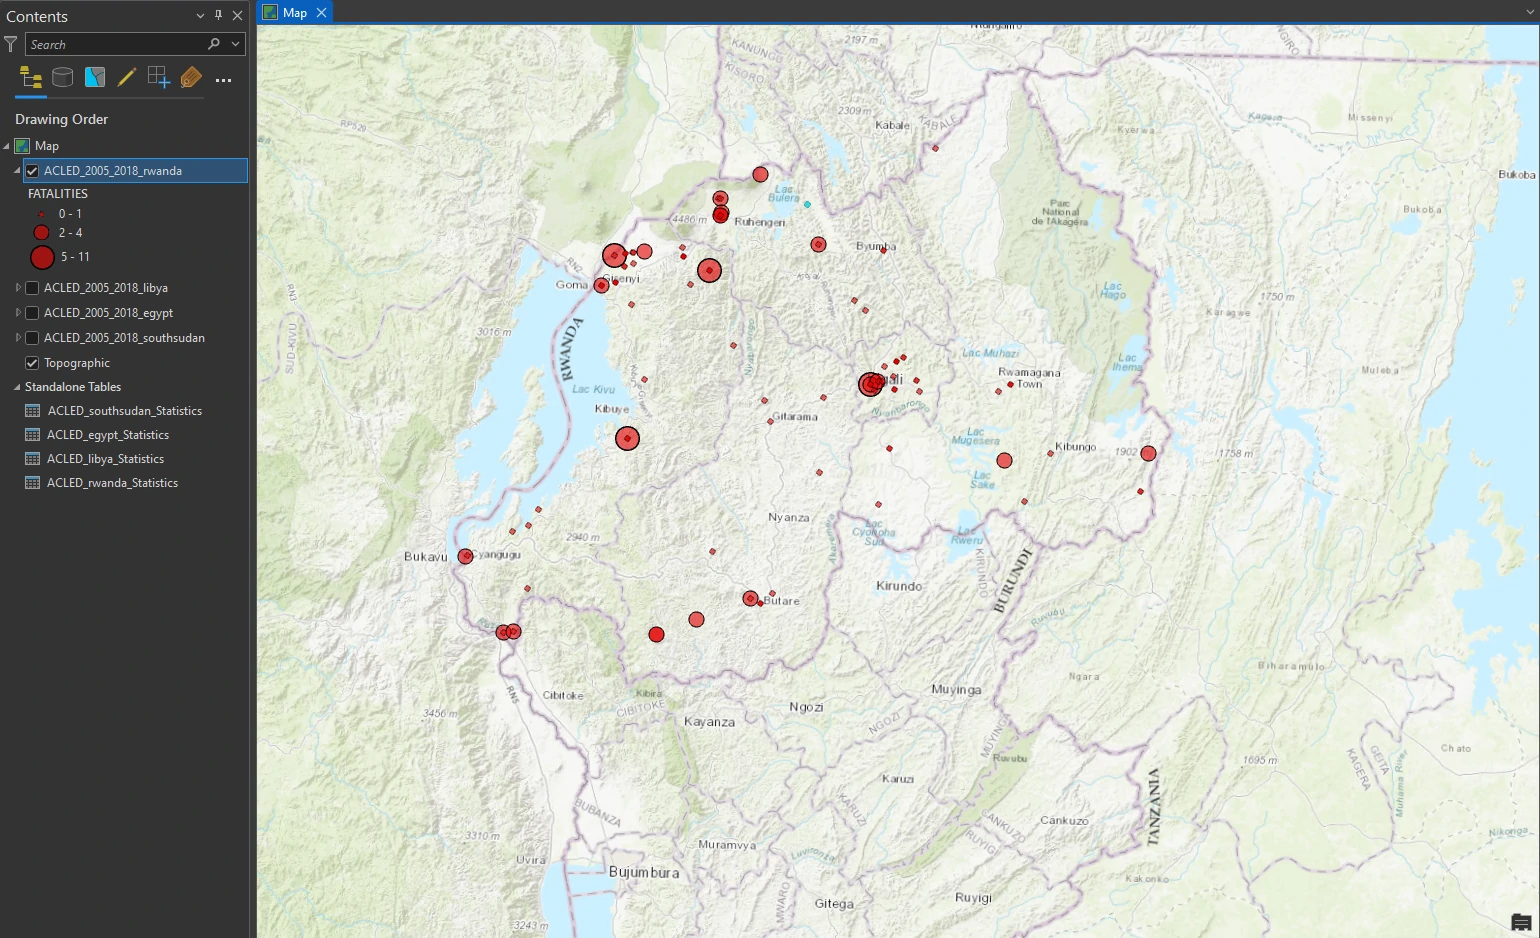
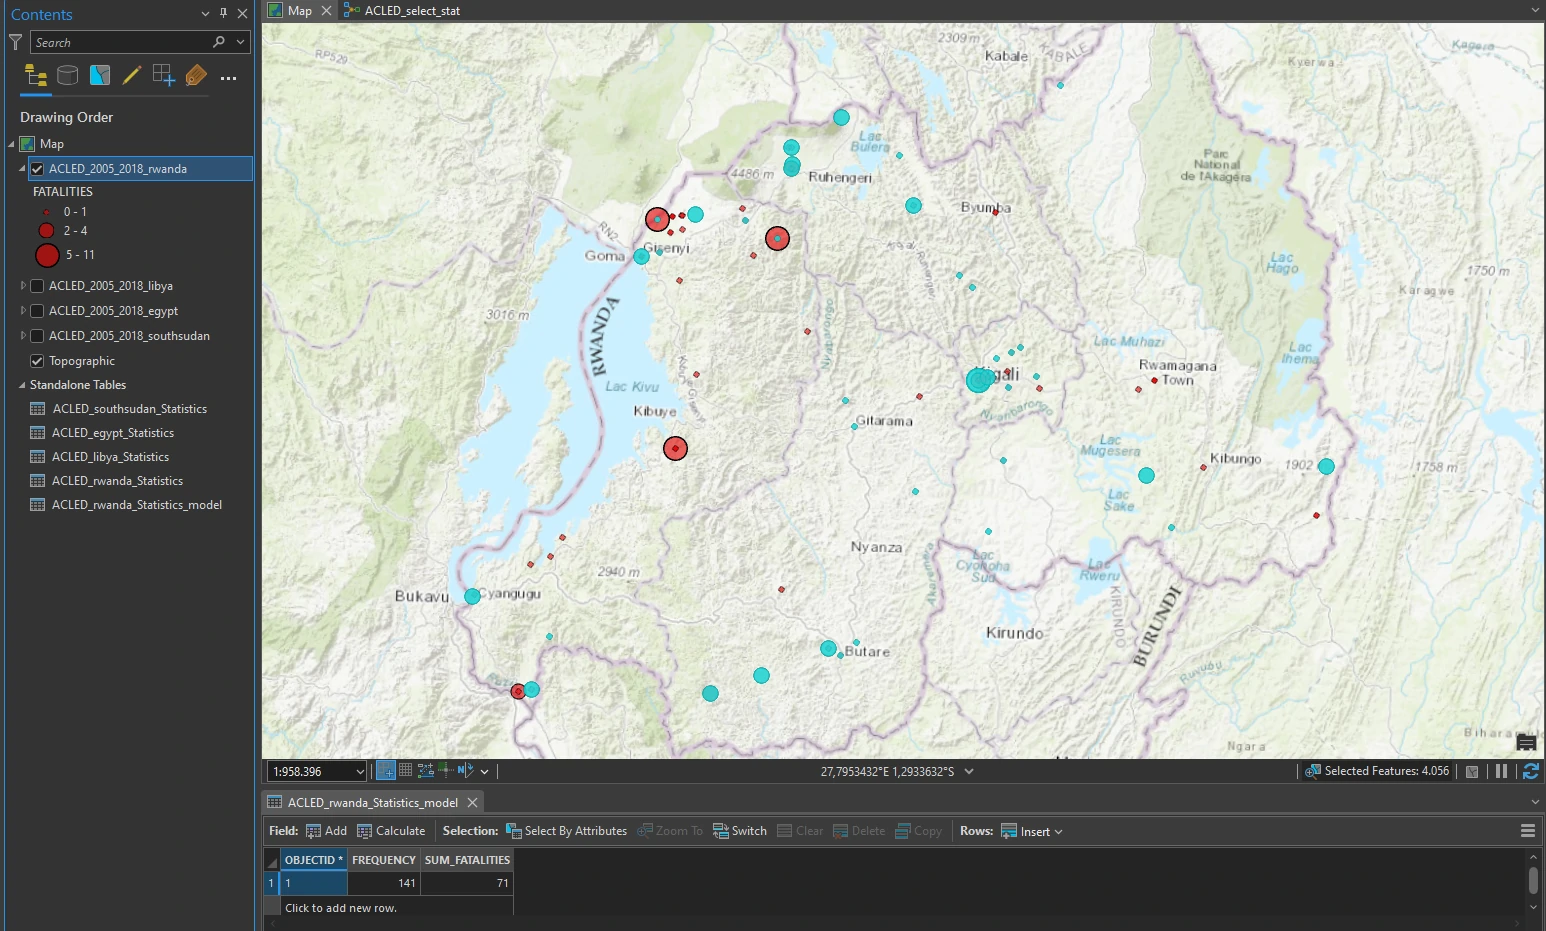
We will continue working with the Conflict dataset for Rwanda, which displays conflicts that occurred in Rwanda between 2010 and 2018. Conflict locations are symbolized using graduated symbols so that larger symbols show greater fatalities.
Add operations to ModelBuilder
To create a new geoprocessing model, we can use this path.
On the Analysis tab, in the Geoprocessing group, click the ModelBuilder button. This step opens the ModelBuilder view. By default, it is docked in the map view area, on a new tab. This process will also generate a new empty model at Catalog pane -> Toolboxes -> Conflict -> model.
We can add layers at this ModelBuilder view to include that layers into our model. The input layer or data for a model will appear as a blue oval.
we can also add geoprocessing tool into our model by drag and drop tool from Geoprocessing pane. The model will automatly add the tool and the output. For this project we will use Select Layer by Attribute tool and Summary Statistics tool to our model.
To connect our input data into our tools by simply drag an arrow onto the tool, release, and click Input Rows to add the layer as input.
Fill out the tool parameters
To give parameters to our tools, we can double-click the select tool, the tool pane will appear and we can fill the parameter or keep the default.
we apply there parameters to our Select Layer by Attribute tool:
- keep the default selection type (New Selection)
- Expression -
Where EVENT_TYPE is Equal to Violence against civilians
The tool in the model shows an input layer with a color, which indicates that it is ready to run.
Next, we will combine Select Layer by Attribute tool and Summary Statistics tool by draw an arrow from the green output from Select Layer by Attribute tool to Summary Statistics tool.
we apply there parameters to our Summary Statistics tool:
- Input Table - ACLED_2010_2018_Rwanda (We are choosing intermediate data; that is, the output of the first operation becomes the input of the second operation)
- Output Table - ACLED_Rwanda_Statistics
- Field = FATALITIES
- Statistic Type = Sum
Using ModelBuilder, we have connected this operation to the output of the selection operation. The statistics will be calculated only for selected features.
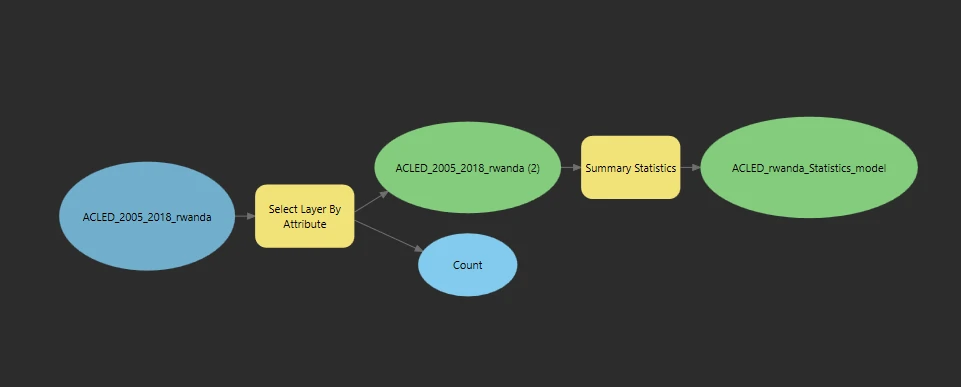
Additionally, we can automatically resize and fit our diagram model by using Auto Layout button at ModelBuilder ribbon.
Run the model
On the ModelBuilder tab, in the Run group, click Run. A progress window appears to indicate the model’s status. We may also notice that each tool in the model turns red as it is processing.
After run the model, the result will be shown at main map, like image below.
Convert a model to a geoprocessing tool
We can turn a model into a stand-alone geoprocessing tool that we can share and then repeat the process, including changing the input, output, and variables. To do that we can follow this steps:
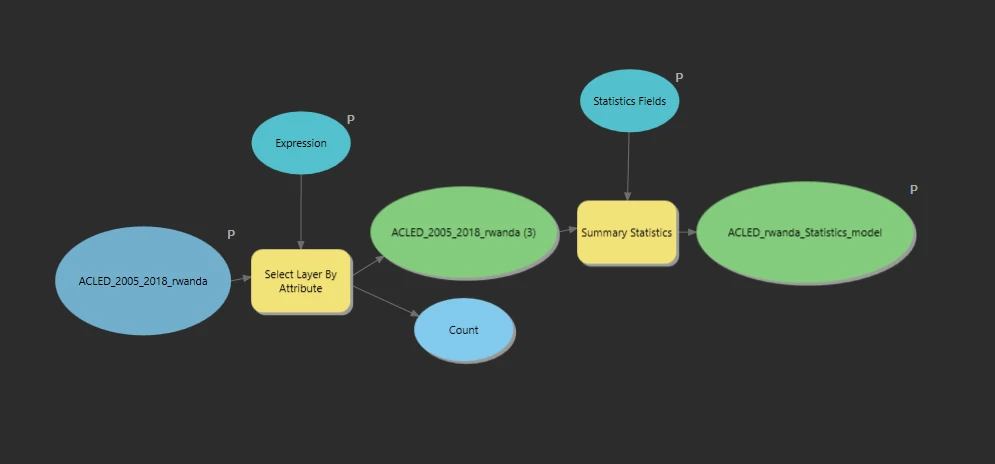
- In ModelBuilder, right-click the input element (the blue oval), and click Parameter. The letter
Pis added near the element. - Right-click the Select Layer by Attribute tool element (the first yellow rectangle), and click Create Variable > From Parameter > Expression.
- Right-click the Summary Statistics tool element, and click Create Variable > From Parameter > Statistics Fields.
- Set the final output and both variables as parameters.
- Save the model, and exit ModelBuilder.
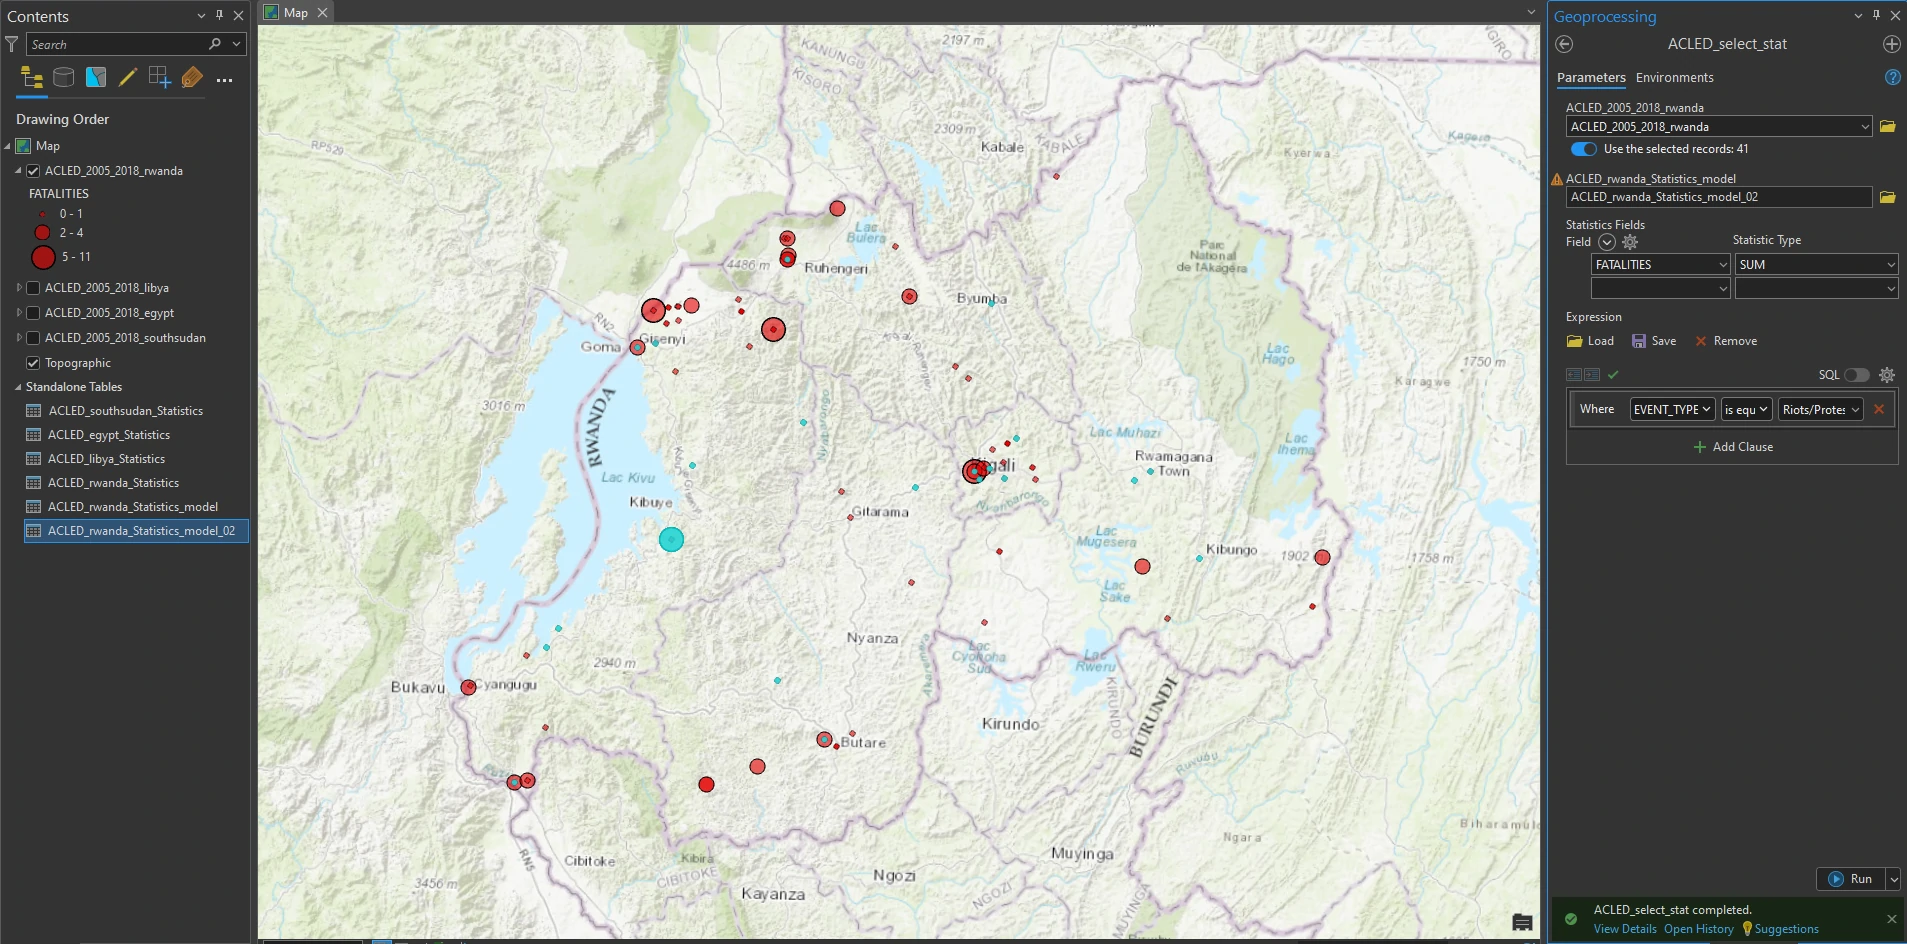
- In the Catalog pane, find the model tool in the Conflict toolbox, and double-click it to open it.
By that steps Our model looks like a regular geoprocessing tool that appear at pane at the right.