Geospatial Environmental Data Extraction and Analysis
geospatial
map
Earth Engine
Introduction
Understanding and monitoring environmental changes is essential for addressing challenges such as deforestation, climate change, and land degradation. This project utilize Python and the Google Earth Engine (GEE) API to efficiently extract, process, and analyze environmental datasets at scale.
By integrating satellite imagery and geospatial data, we can derive key insights into vegetation health, climate trends, and topographic variations. This streamlined approach empowers researchers, conservationists, and policymakers to make data-driven decisions for sustainable environmental management.
Why This Project Matters
- Environmental Monitoring – Track vegetation health, forest coverage, and land-use changes.
- Climate Studies – Analyze temperature and rainfall trends to understand long-term climate variability.
- Agriculture & Land Management – Use NDVI and NDRE to assess crop health and soil moisture.
- Disaster Preparedness – Identify areas at risk of drought or flooding using climatic and topographic data.
By combining Google Earth Engine’s cloud computing power with Python’s analytical capabilities, this project provides a scalable and efficient way to extract actionable environmental insights. Whether for research, conservation, or policy planning, these geospatial tools enable informed decision-making for a more sustainable future.
Key Environmental Datasets and Indices
This project utilizes a variety of remote sensing and climatic datasets, providing a comprehensive environmental assessment for any specified geographic region. Some of the key environmental variables include:
- Vegetation Health Indicators:
- NDVI (Normalized Difference Vegetation Index) – Measures plant health and biomass using Sentinel-2 imagery.
- NDRE (Normalized Difference Red Edge Index) – Similar to NDVI but more sensitive to chlorophyll content.
- NDMI (Normalized Difference Moisture Index) – Assesses vegetation water content, useful for drought monitoring.
- Climatic Data:
- Rainfall (CHIRPS dataset) – Provides daily precipitation data, enabling trend analysis over time.
- Temperature (ERA5-Land dataset) – Captures monthly temperature statistics, including variations across seasons.
- Topographic Features:
- Elevation, Slope, and Hillshade – Derived from Digital Elevation Model (DEM) data to understand terrain variations.
- Canopy Height (ETH Global Canopy Height 2020) – Helps assess forest structure and biomass for conservation studies.
How the Project Works: Step-by-Step Workflow
This project automates the extraction and processing of environmental data using a scripted pipeline, making it highly efficient and reproducible.
- Define the Study Area
- Load Shapefile Data The first step is to define the geographic boundaries of interest using shapefile (.shp) data. This ensures all environmental analyses are focused on a specific region, such as a national park, agricultural land, or urban area.
- Load and Process Satellite Imagery
-
Access Sentinel-2 Data The project pulls high-resolution multispectral imagery from Sentinel-2, a key dataset for vegetation analysis.
-
Calculate Vegetation Indices NDVI Calculation Function – Computes NDVI for each pixel in the study area. NDVI Statistics Reduction – Aggregates NDVI data over time to monitor trends and seasonal variations.
-
- Extract Topographic and Elevation Data
-
Process DEM Data Extracts elevation, slope, and hillshade to understand the terrain structure of the region.
-
Assess Canopy Height Uses the ETH Global Canopy Height dataset to estimate tree heights and forest density.
-
- Gather and Analyze Climate Data
- Precipitation Analysis (CHIRPS Dataset) Retrieves daily rainfall data, sums it over time, and extracts precipitation trends.
- Temperature Statistics (ERA5-Land Dataset) Calculates monthly average temperatures to study climate patterns over different seasons.
Dataset
To conduct this study, we rely on Earth Engine dataset that includes:
- Vegetation Health Indicators :
COPERNICUS/S2_SR_HARMONIZED - Elevation, Slope, and Hillshade :
USGS/SRTMGL1_003 - Canopy Height :
ETH_GlobalCanopyHeight_2020_10m_v1 - Elevation, Slope, and Hillshade :
USGS/SRTMGL1_003 - Rainfall :
CHIRPS dataset - Temperature :
ERA5-Land dataset
Load Study Area
The boundary data is stored in a .shp file for all kabupaten and kota in Indonesia. In this project, due to there is limit request policy data, thus we filtered our study area for kabupaten bekasi and we request the data from 1 january 2024 until 31 December 2024.
start_date = '2020-01-01'
end_date = '2020-12-31'
shapefile =r"..\kab_kota\sharp_kab_kota.shp"
gdf = gpd.read_file(shapefile)

bekasi = gdf[gdf['WADMKK'].isin(['Bekasi'])]
bekasi.to_file('bekasi.shp')

shapefile =r"..\gee\jabar.shp"
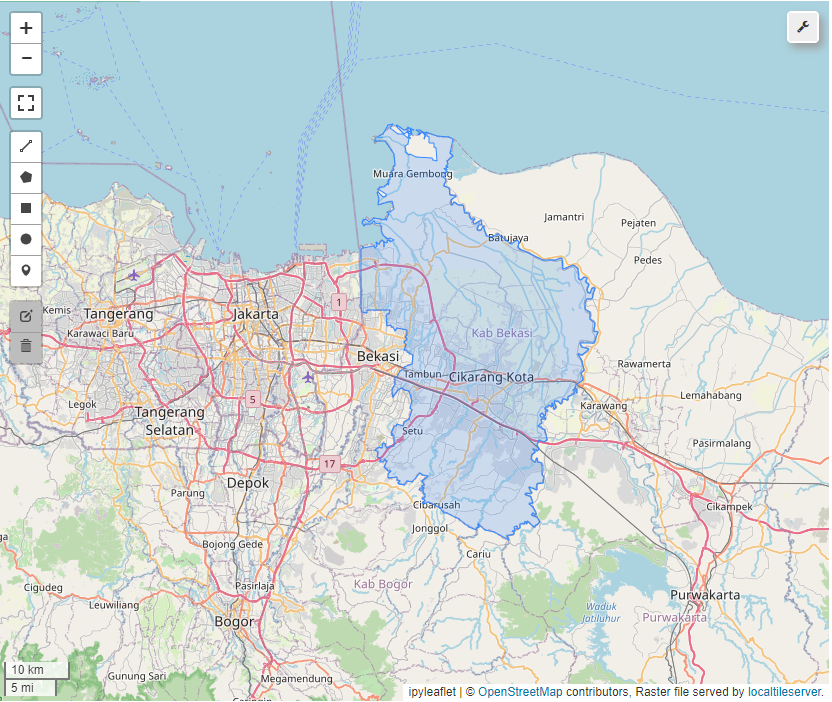
Generate Boundary area
By calling geemap_func.get_boundary_map, we can generate boundary map into map visualization and geometry parameter for later use.
map_visual, roi = geemap_func.get_boundary_map(shapefile, color='red', name='boundary',zoom=10)
This function requires the following parameters:
- shapefile (
string): path to.shpdata - color (
float): color for boudary - name (
string): layer name - zoom (
int): zoom level
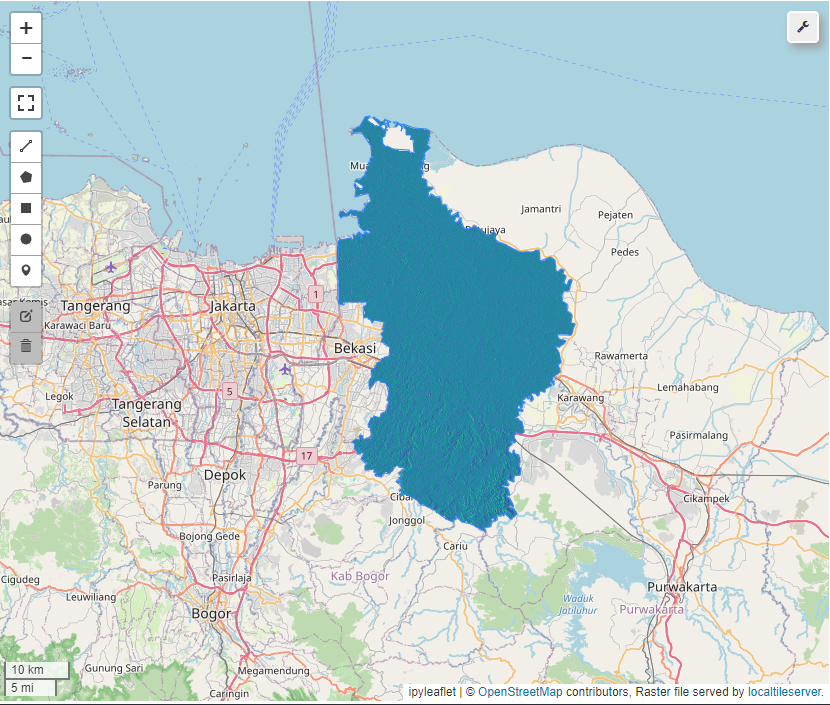
Boundary area
Load and Process Satellite Imagery
Access Sentinel-2 Data
To get Vegetation Indices and generate parameters index value, we us Sentinel-2 imagery and select 5 bands. These bands are [B4, B8, B5, B8A, B11] that contain [red, NIR, red edge, NIR A, SWIR] in electromagnetic spectrum.
By calling geemap_func.get_variables we can get all data from Sentinel-2 imagery with specific bands and time windows.
dataset, dataset_median, bands = geemap_func.get_variables(map_name="COPERNICUS/S2_SR_HARMONIZED",
                    area=roi, date_filter=['2024-01-01','2024-12-30'], cloudy=None,
                    band_filter=['B4','B8','B5','B8A','B11'], overlaping=False)
This function requires the following parameters:
- map_name (
string): name of tile in Earth Engine - area (
geometry): boundary area - date_filter (
list): time windows - cloudy (
boolean): reduce cloud effect - band_filter (
list): list of bands - overlaping (
boolean): combine all band images into single image
Calculate Vegetation Indices
By calling geemap_func.vegetation_calculation, We calculate all required bands to get NDVI, NDRE, NDMI index value. This process we will Normalized Difference specific bands and reduce the image collection to get each index value.
map_visual, results_vegetation, results_collection_vegetation = geemap_func.vegetation_calculation(bands=bands, map_visual=map_visual, data_time=dataset)
This function requires the following parameters:
- bands (
list): list of bands image - map_visual (
map): apply our calculation into existing map - data_time (
image collection): image collection dataset result from previous code
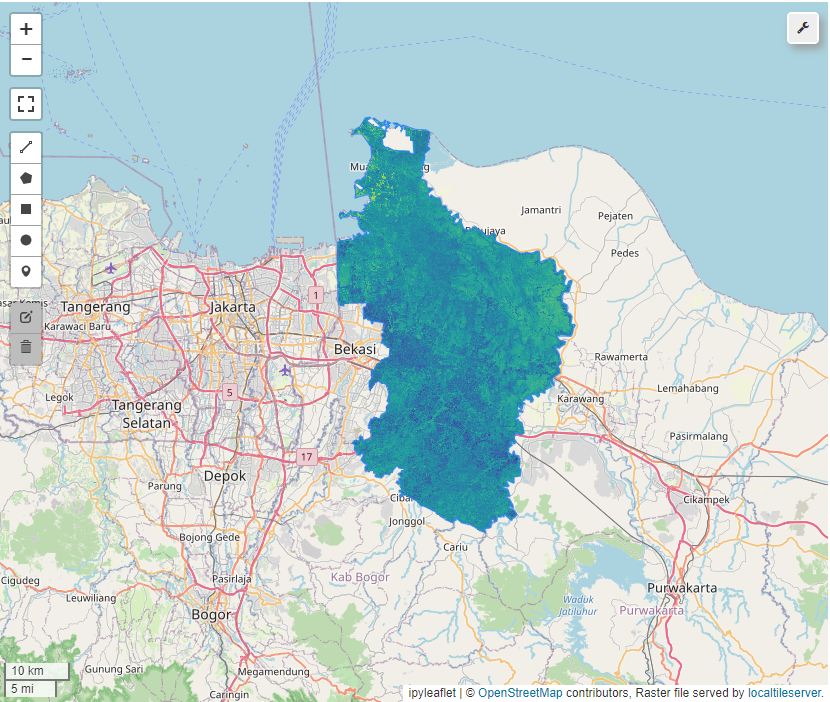
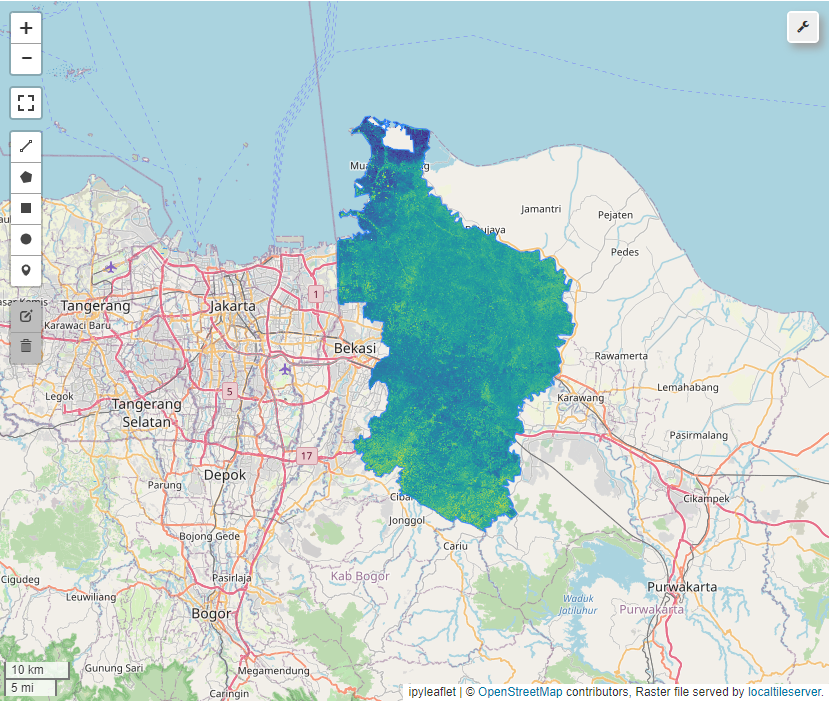
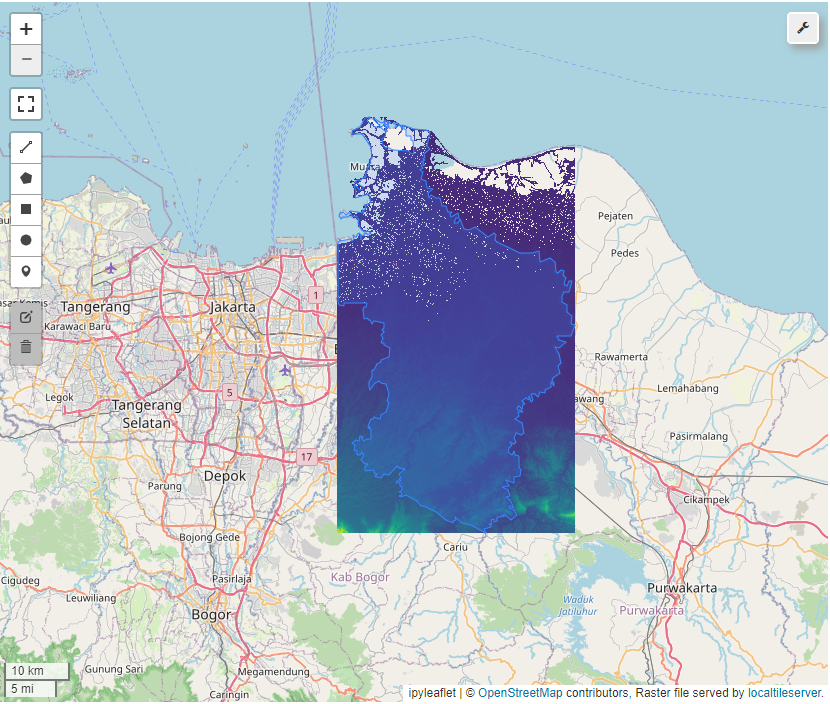
NDVI
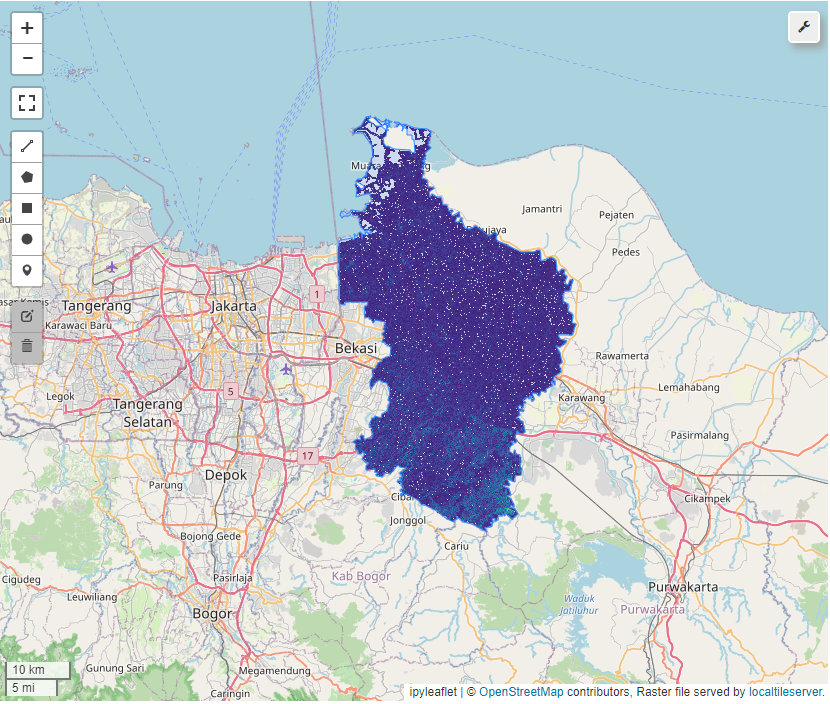
NDRE

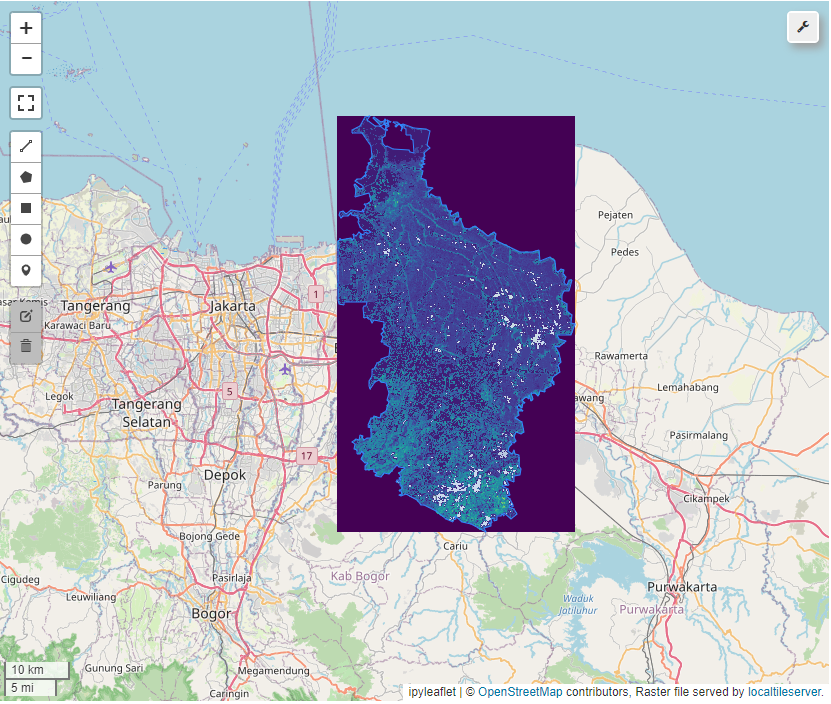
NDMI
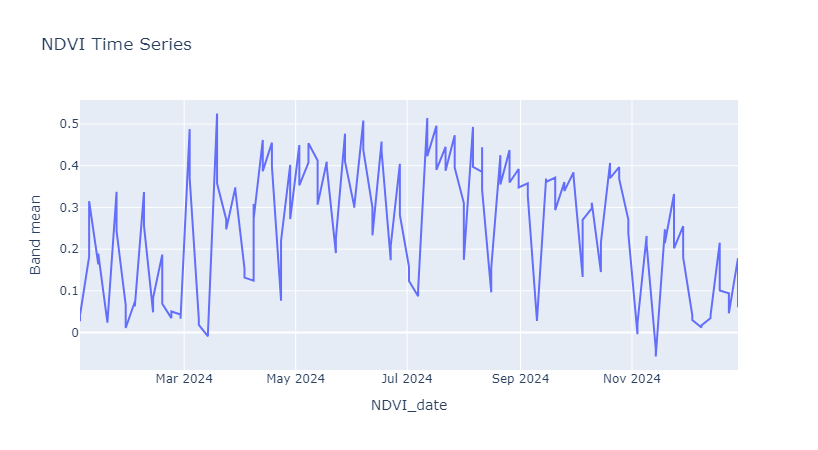
Calculate vegetation statistics
By calling geemap_func.vegetation_statistics, We can calculate statistics value for each index and store it in local storage.
stats, stats_value, result_vegetation_stat = geemap_func.vegetation_statistics(collection, area, scale=60)
This function requires the following parameters:
- collection (
list): image collection dataset result from previous code - area (
map): boundary area - scale (
int): a nominal scale in meters of the projection to work in.
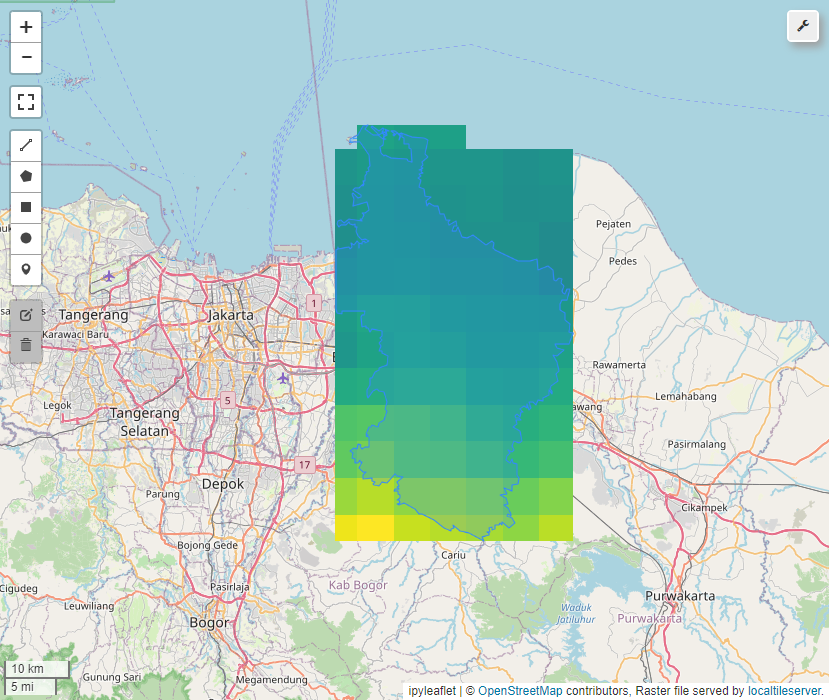
Extract Topographic and Elevation Data
To get Topographic data (such as: elevation, slope, and hillshade) we can use DEM Data to generate those data. By calling geemap_func.get_dem_variable we can generate elevation, slope, and hillshade data from USGS/SRTMGL1_003 dataset.
elevation, slope, hillshade, map_visual = geemap_func.get_dem_variable(map_name="USGS/SRTMGL1_003", area=roi, map_visual=None, zoom=10)
This function requires the following parameters:
- map_name (
string): name of tile in Earth Engine - area (
geometry): boundary area - map_visual (
map): apply our calculation into existing map - zoom (
int): zoom level
Elevation
Hillshade
Slope
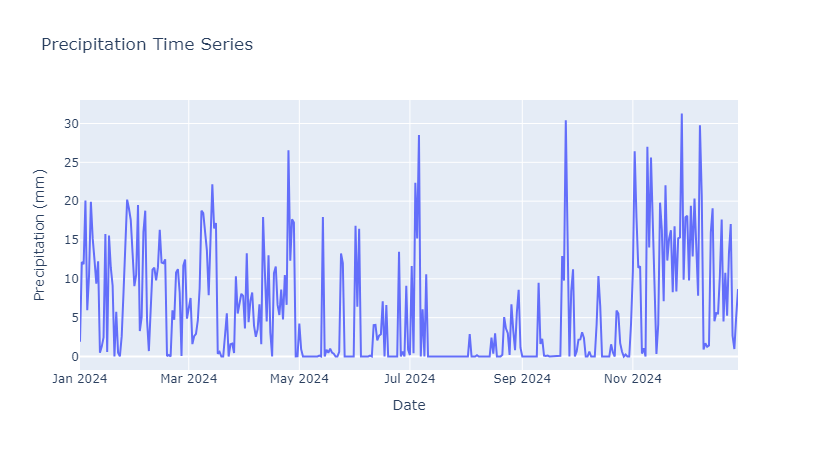
Extract Canopy Height Data
By calling geemap_func.get_canopy_height_variable we can generate canopy height dataset and Mask out the values that are equal to 255 to get normilized data.
ch, ch_masked, map_visual = geemap_func.get_canopy_height_variable(map_name="users/nlang/ETH_GlobalCanopyHeight_2020_10m_v1", area=roi, map_visual=None, zoom=10)
This function requires the following parameters:
- map_name (
string): name of tile in Earth Engine - area (
geometry): boundary area - map_visual (
map): apply our calculation into existing map - zoom (
int): zoom level
Canopy Height
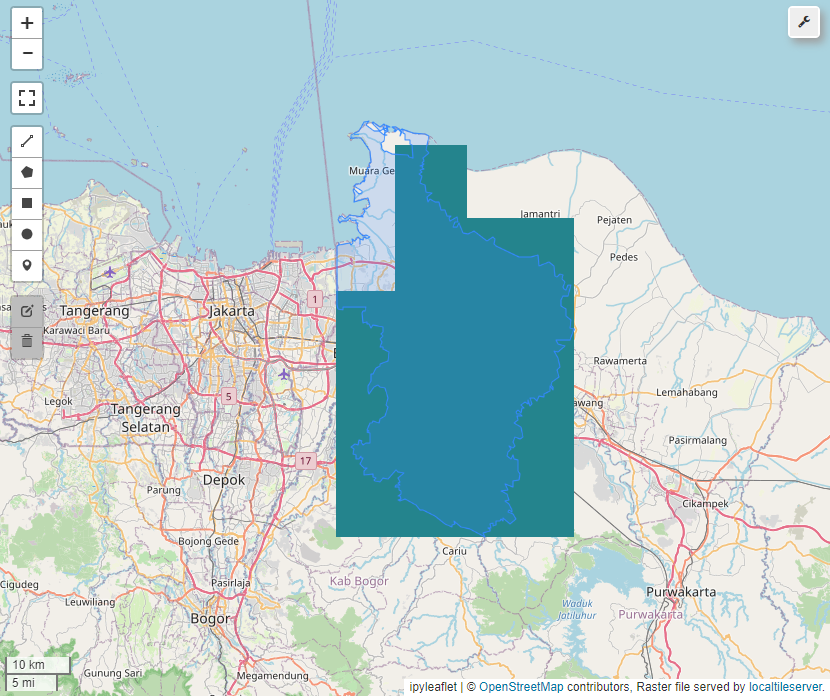
Extract Precipitation Data
By calling geemap_func.get_precipitation_variable we can generate precipitation or rainfall dataset and aggregate to get daily or yearly data.
dataset_rain, rain, map_visual = geemap_func.get_precipitation_variable(map_name="UCSB-CHG/CHIRPS/DAILY", area=roi, date_filter=['2024-01-01','2024-12-30'], map_ee=None, zoom=10)
This function requires the following parameters:
- map_name (
string): name of tile in Earth Engine - area (
geometry): boundary area - date_filter (
list): time windows - map_visual (
map): apply our calculation into existing map - zoom (
int): zoom level
Precipitation Analysis
Calculate Precipitation statistics
By calling geemap_func.precipitation_statistics, We can calculate statistics value for precipitation and store it in local storage.
stats, stats_value, result_rain = geemap_func.precipitation_statistics(collection, area, scale=60)
This function requires the following parameters:
- collection (
list): image collection dataset result from previous code - area (
map): boundary area - scale (
int): a nominal scale in meters of the projection to work in.
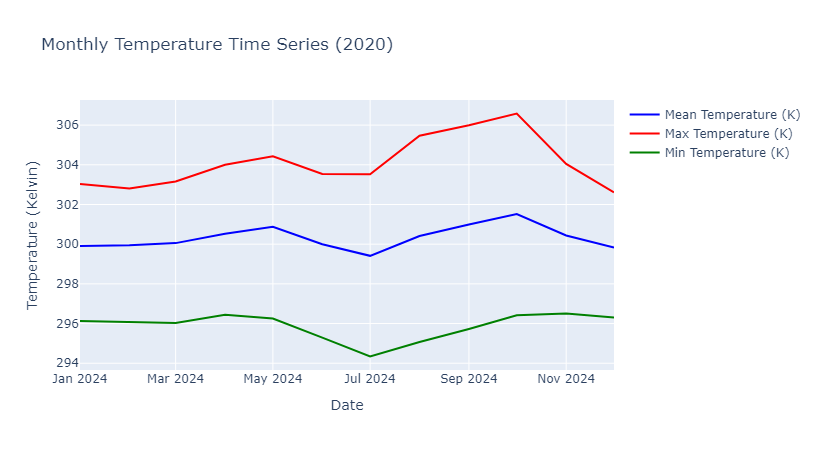
Extract Temperature Data
By calling geemap_func.get_temperature_variable we can generate monthly temperature data to study climate patterns over different seasons.
dataset_temp, temp, map_visual = geemap_func.get_temperature_variable(map_name="ECMWF/ERA5_LAND/MONTHLY_BY_HOUR", area=roi, date_filter=['2024-01-01','2024-12-30'], map_visual=None, zoom=10)
This function requires the following parameters:
- map_name (
string): name of tile in Earth Engine - area (
geometry): boundary area - date_filter (
list): time windows - map_visual (
map): apply our calculation into existing map - zoom (
int): zoom level
Precipitation Analysis
Calculate Temperature statistics
By calling geemap_func.temperature_calculation, We can calculate statistics value for temperature and store it in local storage.
data_temp = geemap_func.temperature_calculation(dataset_temp,
                date_filter=['2024-01-01','2024-12-30'], area=roi, scale=60)
This function requires the following parameters:
- collection (
list): image collection dataset result from previous code - area (
map): boundary area - date_filter (
list): time windows - scale (
int): a nominal scale in meters of the projection to work in.
Save the data
By calling geemap_func.save_to_tif, We can save all raster data into .tiff image format.
out_dir = '..\geemap\gee'
geemap_func.save_to_tif(out_dir, main_data, area, names=[], scale=None)
This function requires the following parameters:
- out_dir (
string): path to save the image - main_data (
list): list of data - area (
map): boundary area - names (
list): name of file - scale (
int): a nominal scale in meters of the projection to work in.