Interactive Map plot using Shapefile
Dataset
Load dataset
First, we load a dataset containing the id, names of starbucks location in LA, their coordinates, city name, state name and zip code.
df = pd.read_csv(r'..\map\starbucksInLACounty.csv')
| id | strLocation | latitude | longitude | city | state | zip | |
|---|---|---|---|---|---|---|---|
| 0 | 27689-248404 | Carson & Wilmington | 33.8315 | -118.24 | Carson | CA | 90745 |
| 1 | 5774-5505 | Atlantic & San Antonio | 33.8372 | -118.185 | Long Beach | CA | 90807 |
| 2 | 74620-93749 | Vons-Long Beach #3519 | 33.841 | -118.183 | Long Beach | CA | 90807 |
| 3 | 5928-20999 | Avalon & Dominguez, Carson | 33.8416 | -118.262 | Carson | CA | 90746 |
| 4 | 76468-95631 | Target Carson T-2026 | 33.844 | -118.263 | Carson | CA | 90746 |
load json file
Next, we load or provide the path to the GeoJSON or shape file. This step is optional if the main_data parameter is already set as a GeoDataFrame that includes a geometry column.
with open(r'..\map\laMap.geojson') as f:
    laArea = json.load(f)
The Code
By calling maps.map_marker_fol_plot, we can some plotting such as:
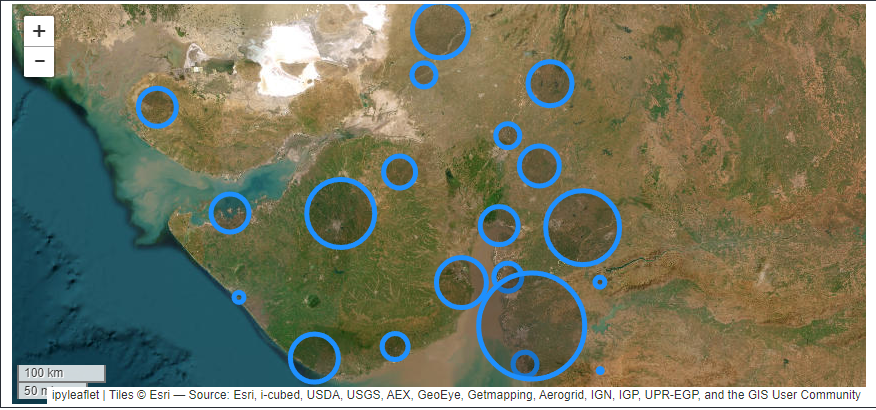
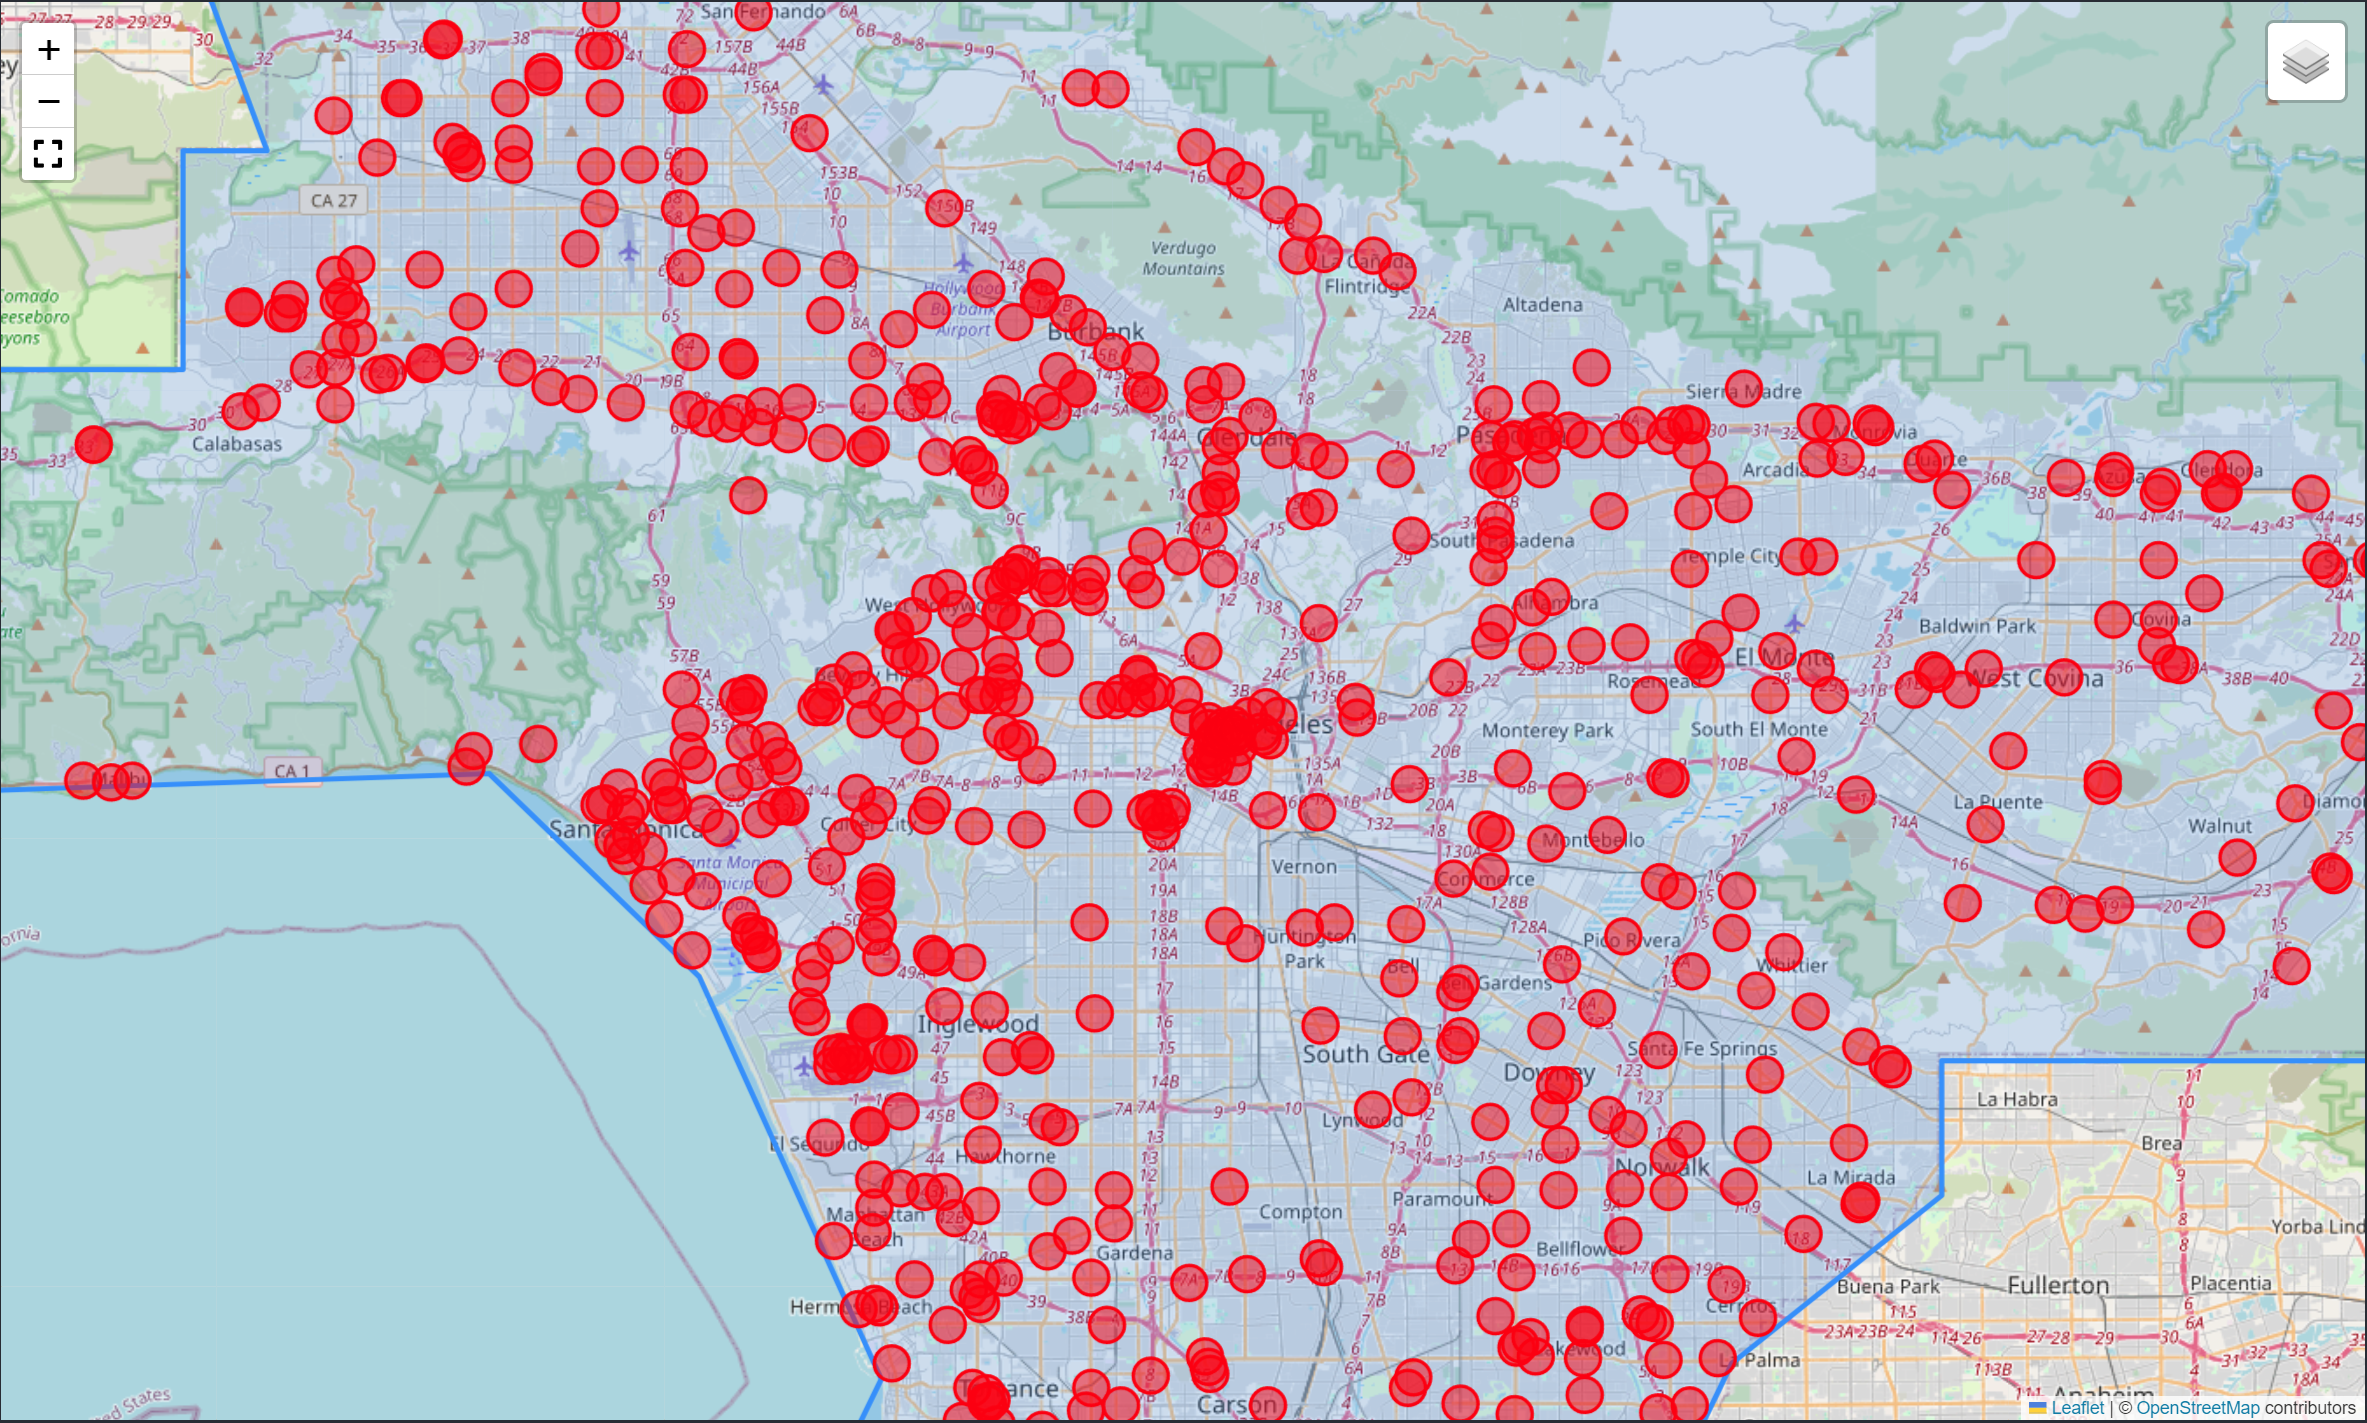
- draw plot map with circle as marker for location
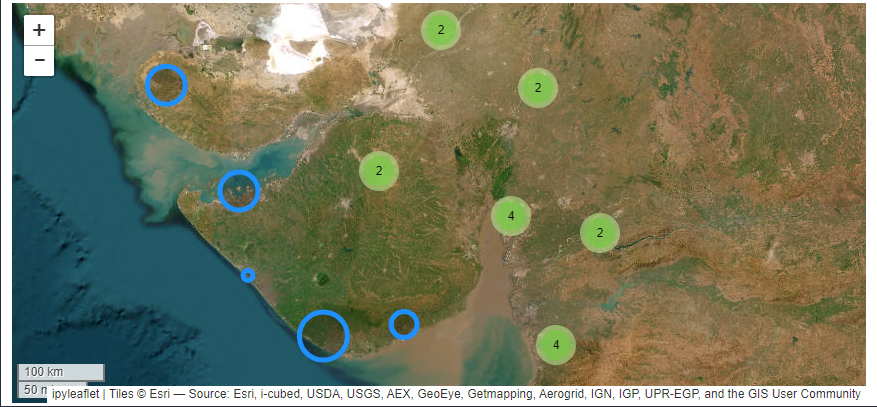
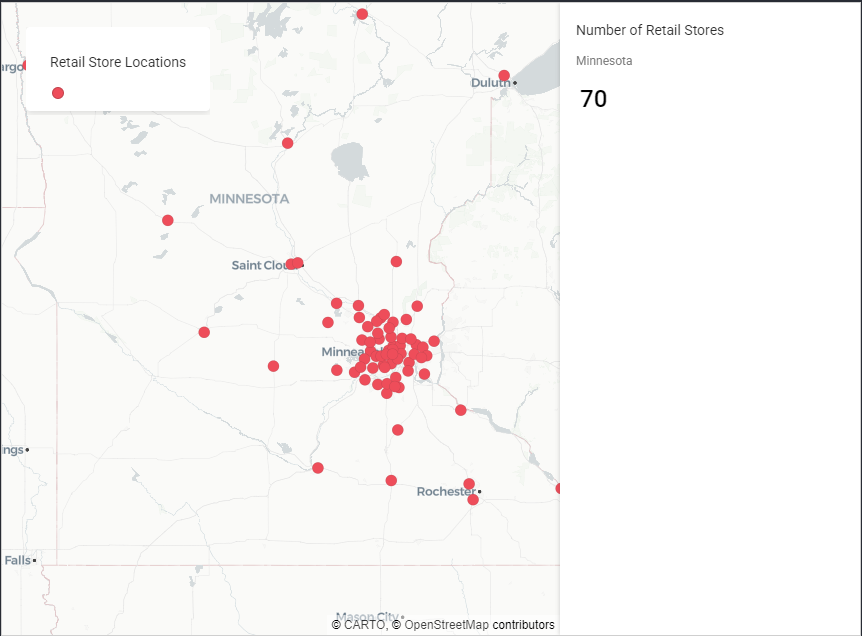
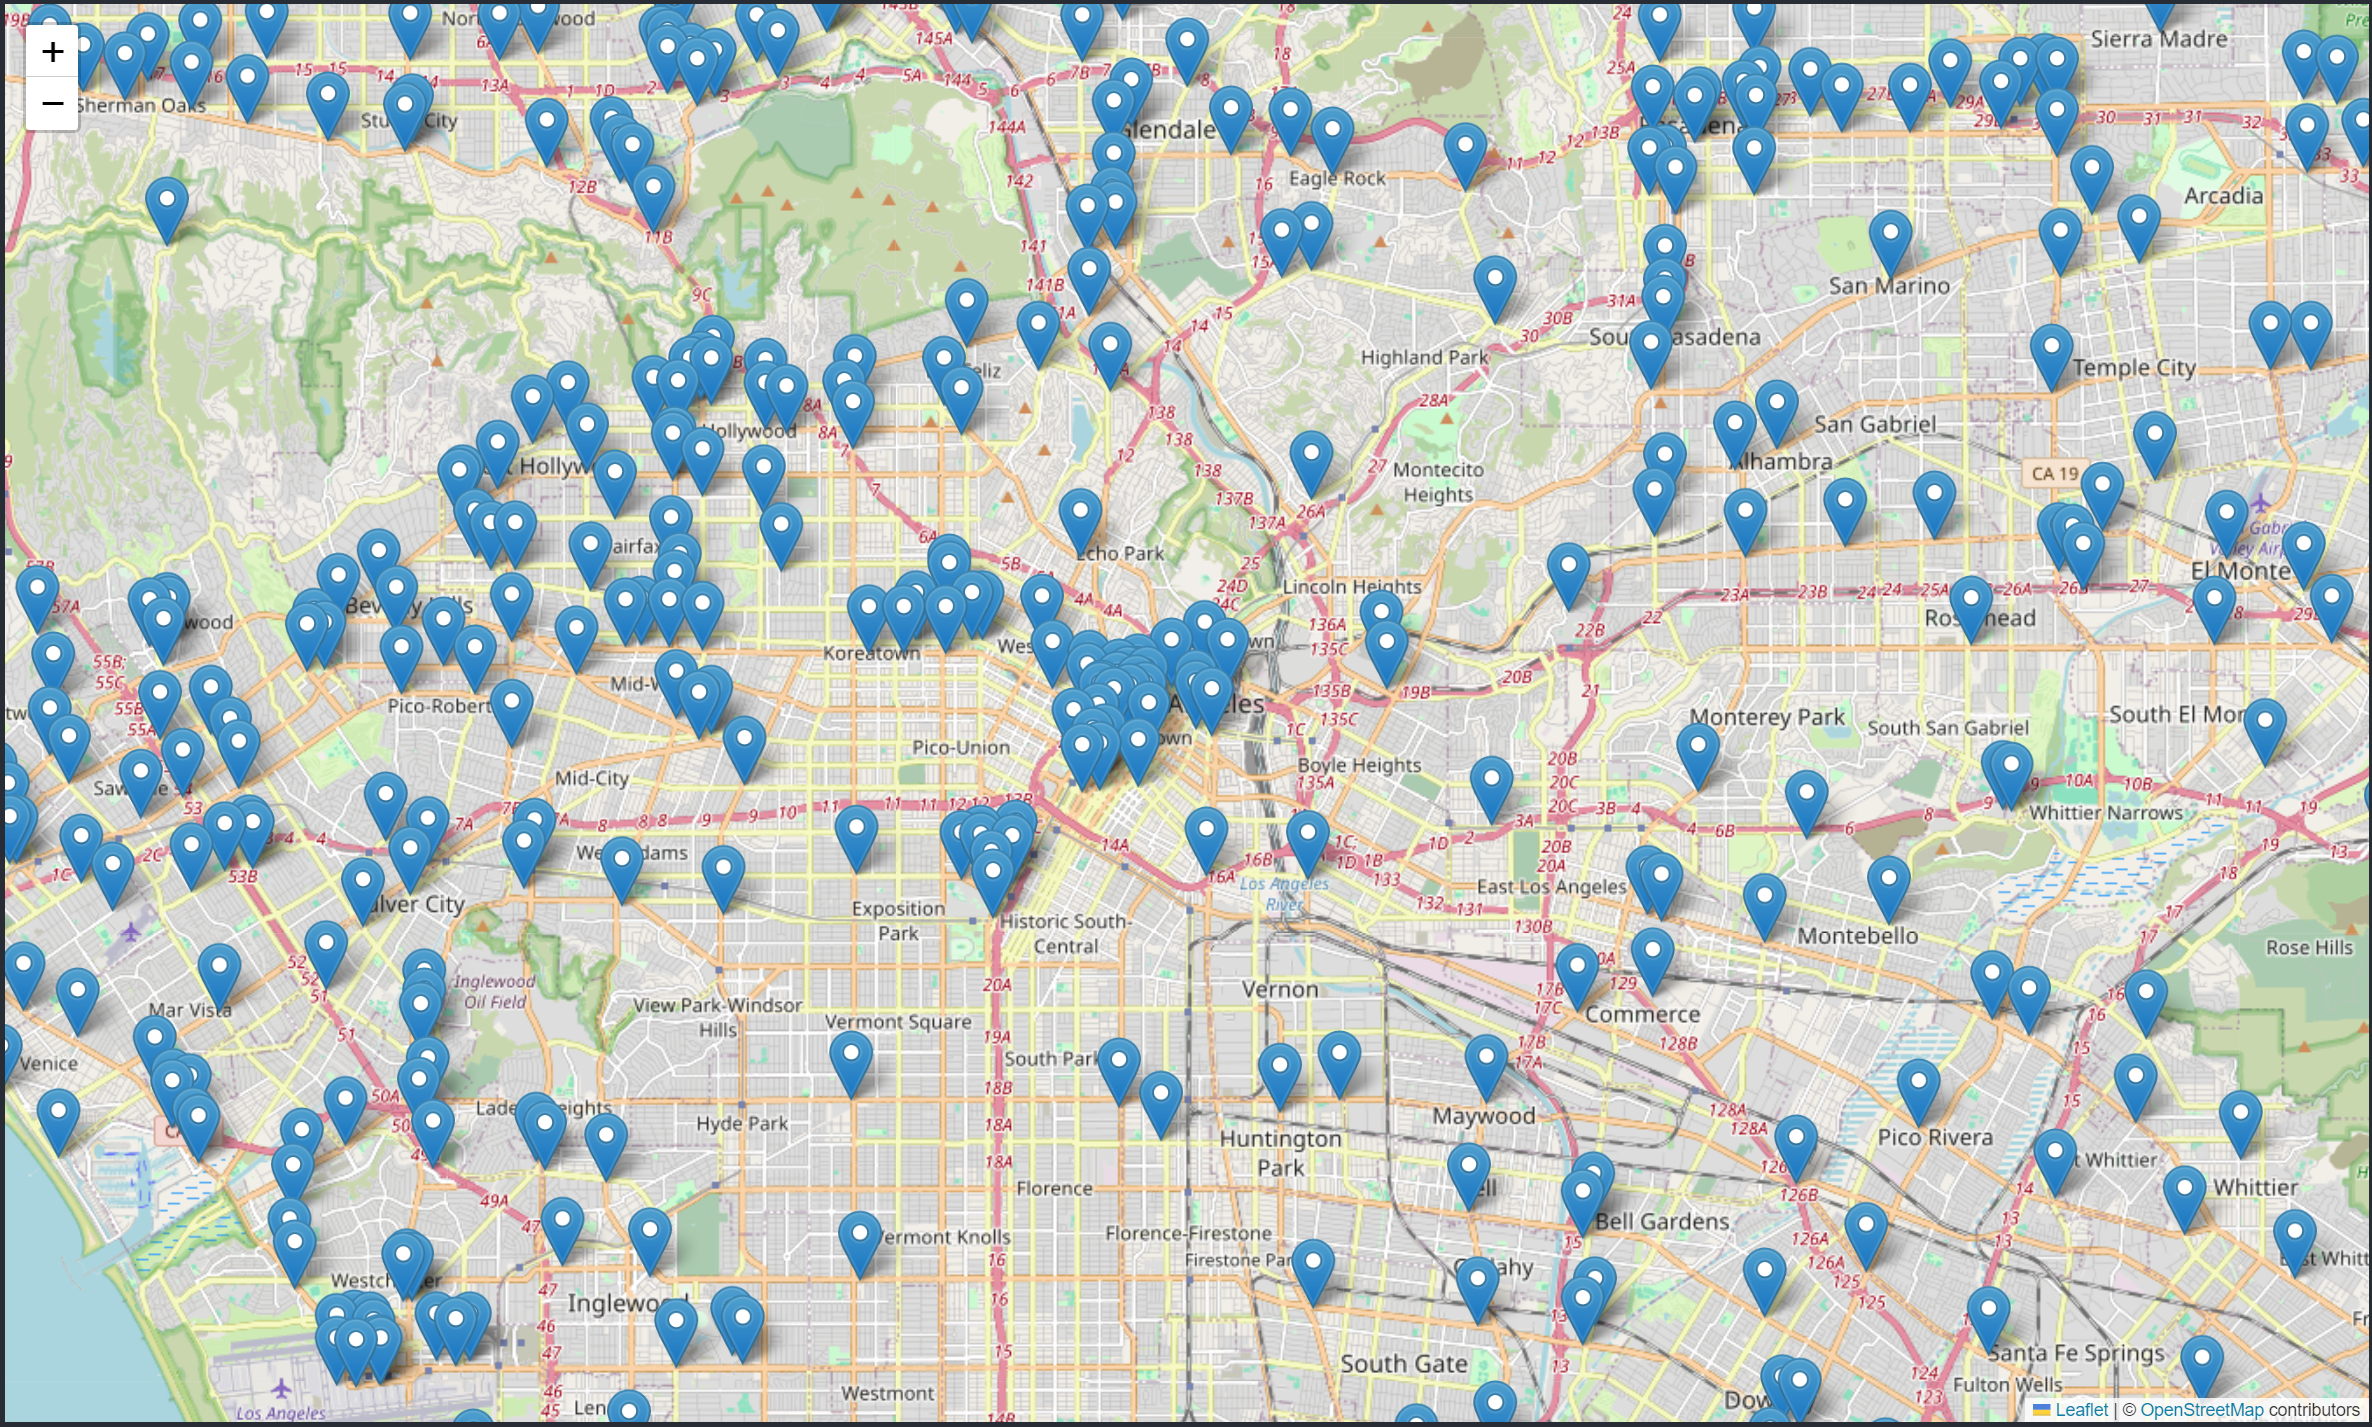
- draw plot map with point as marker for location
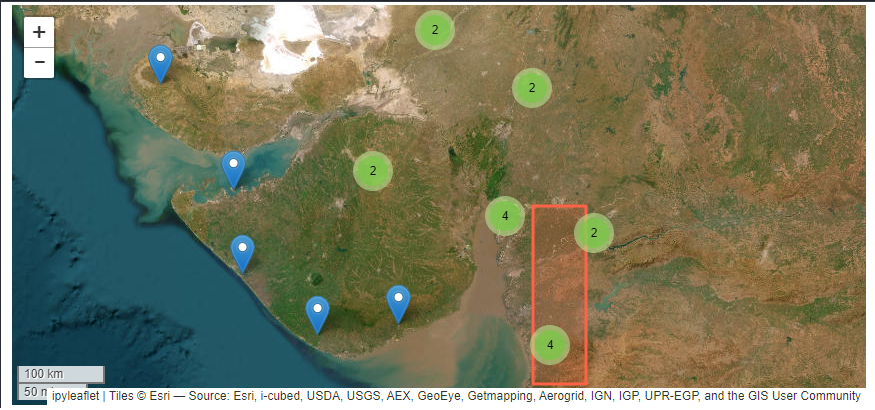
- draw plot map with point as marker for location with number/image on it
- draw plot map with choropleth as marker for area
- draw plot map with choropleth as marker for area with changing per time
- draw plot map with heatmap as marker for area
- draw plot map with polygon as marker for area
- draw plot map with geometry grid as marker for area
- draw plot map with voronoi area as marker for area
- draw plot map with multiple route as marker for line
In this chapter, we will showcase the first three types of plots as examples. Additional examples and discussions will be covered in the next chapter.
maps.map_fol_plot(main_data=main_data, shape=laArea, col_list=['latitude','longitude'],
                        marker = ['circle'], center_coor=[34.0522,-118.2437], tip= ['strLocation'],zoom=5,
                        control_layer=False, fullscreen=False, upper_right = [61, 2], lower_left = [49, -8],
                        popup_type = 'table',custome_popup=df[['strLocation']],)
This function requires the following parameters:
- main_data (
dataframe): Data location and value - shape (
string): Shapefile - col_loc (
list): Two column names of location['longitude', 'latitude'] - marker (
list): Select the type(s) of markets you want to display - center_coor (
list): The center coordinates for the map, making it easier to navigate and interact with - zoom (
int): Setting zoom scale of map - upper_right (
list): upper right coordinate for geometry grid - lower_left (
list): lower left coordinate for geometry grid - popup_type (
string): type of popup that will appear - custome_popup (
list): columns name in list that will appear in popup - tip (
string): The column name containing string values that will appear as a tooltip when hovering over a location. - control_layer (
boolean): Adds a control layer panel to toggle which map layers to display. - fullscreen (
boolean): Adds a fullscreen button to switch between fullscreen mode and normal view.
As discussed above, the marker parameter can include one or multiple values such as:
- circle, point, point_number
- polygon
- choropleth
- choropleth_time
- geo_grid
- voronoi
- voronoi_full
- multiple_route
- heatmap
- multiple_heatmap
- skater_area
- ant_path
- geo_area
- single_route
When multiple values are provided, the function automatically generates multiple layers to fulfill the request, allowing for a dynamic and comprehensive visualization.
The result
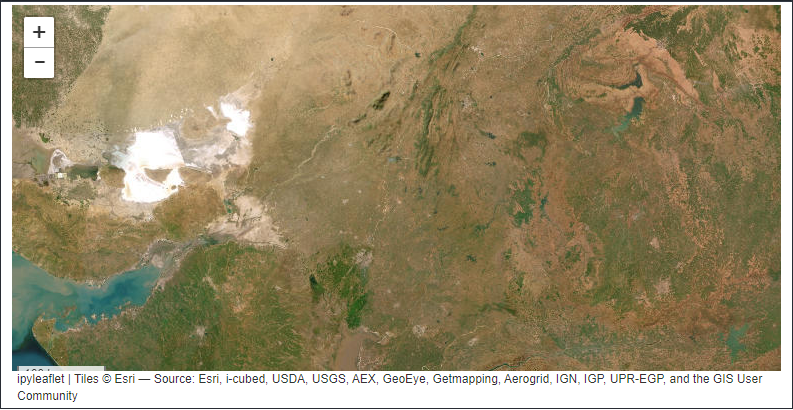
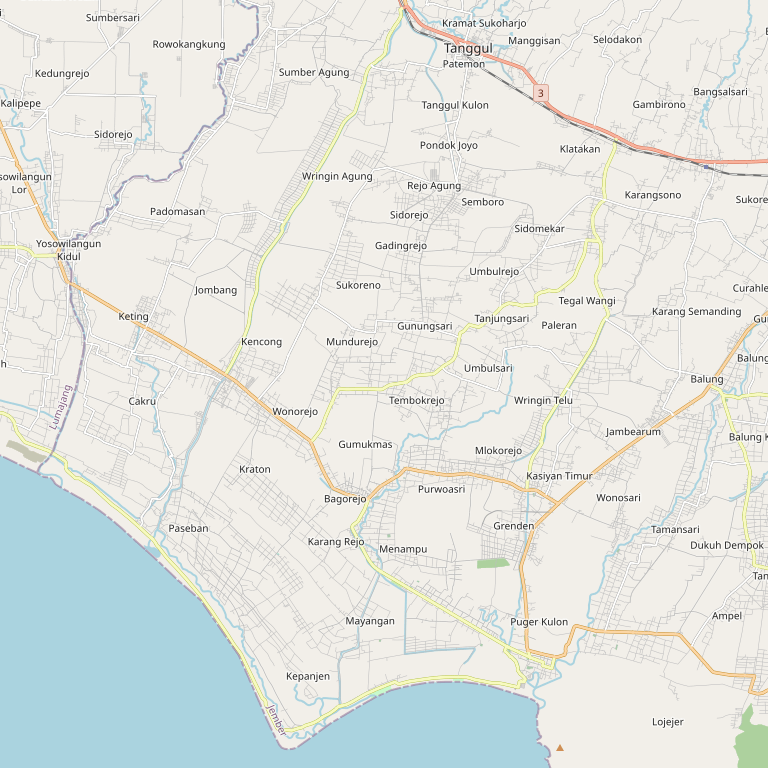
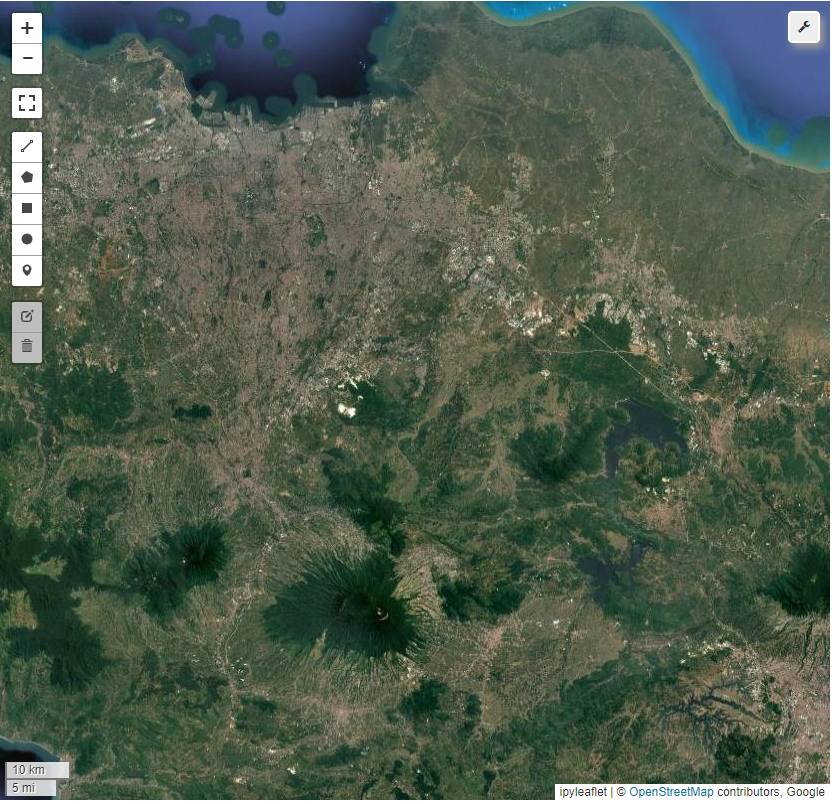
get image osm map
maps.get_image_osm(coor=(-8.36,113.35,-8.2,113.525), zoom=18, server='',margin=.05,
                    tilesize=256,maxtiles=16,show_image=False)
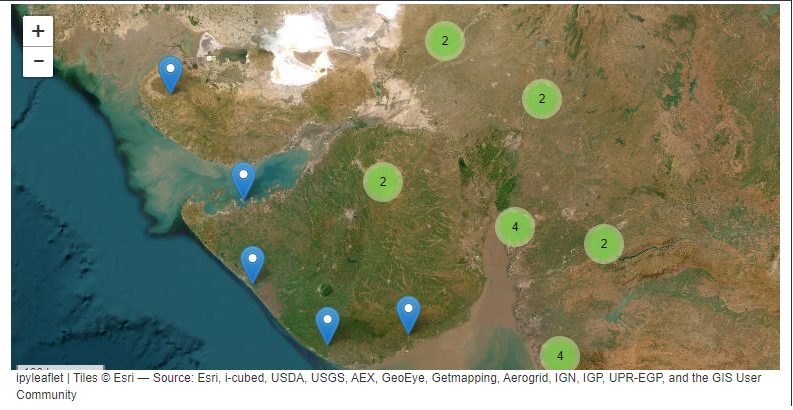
Circle marker map
Point marker map
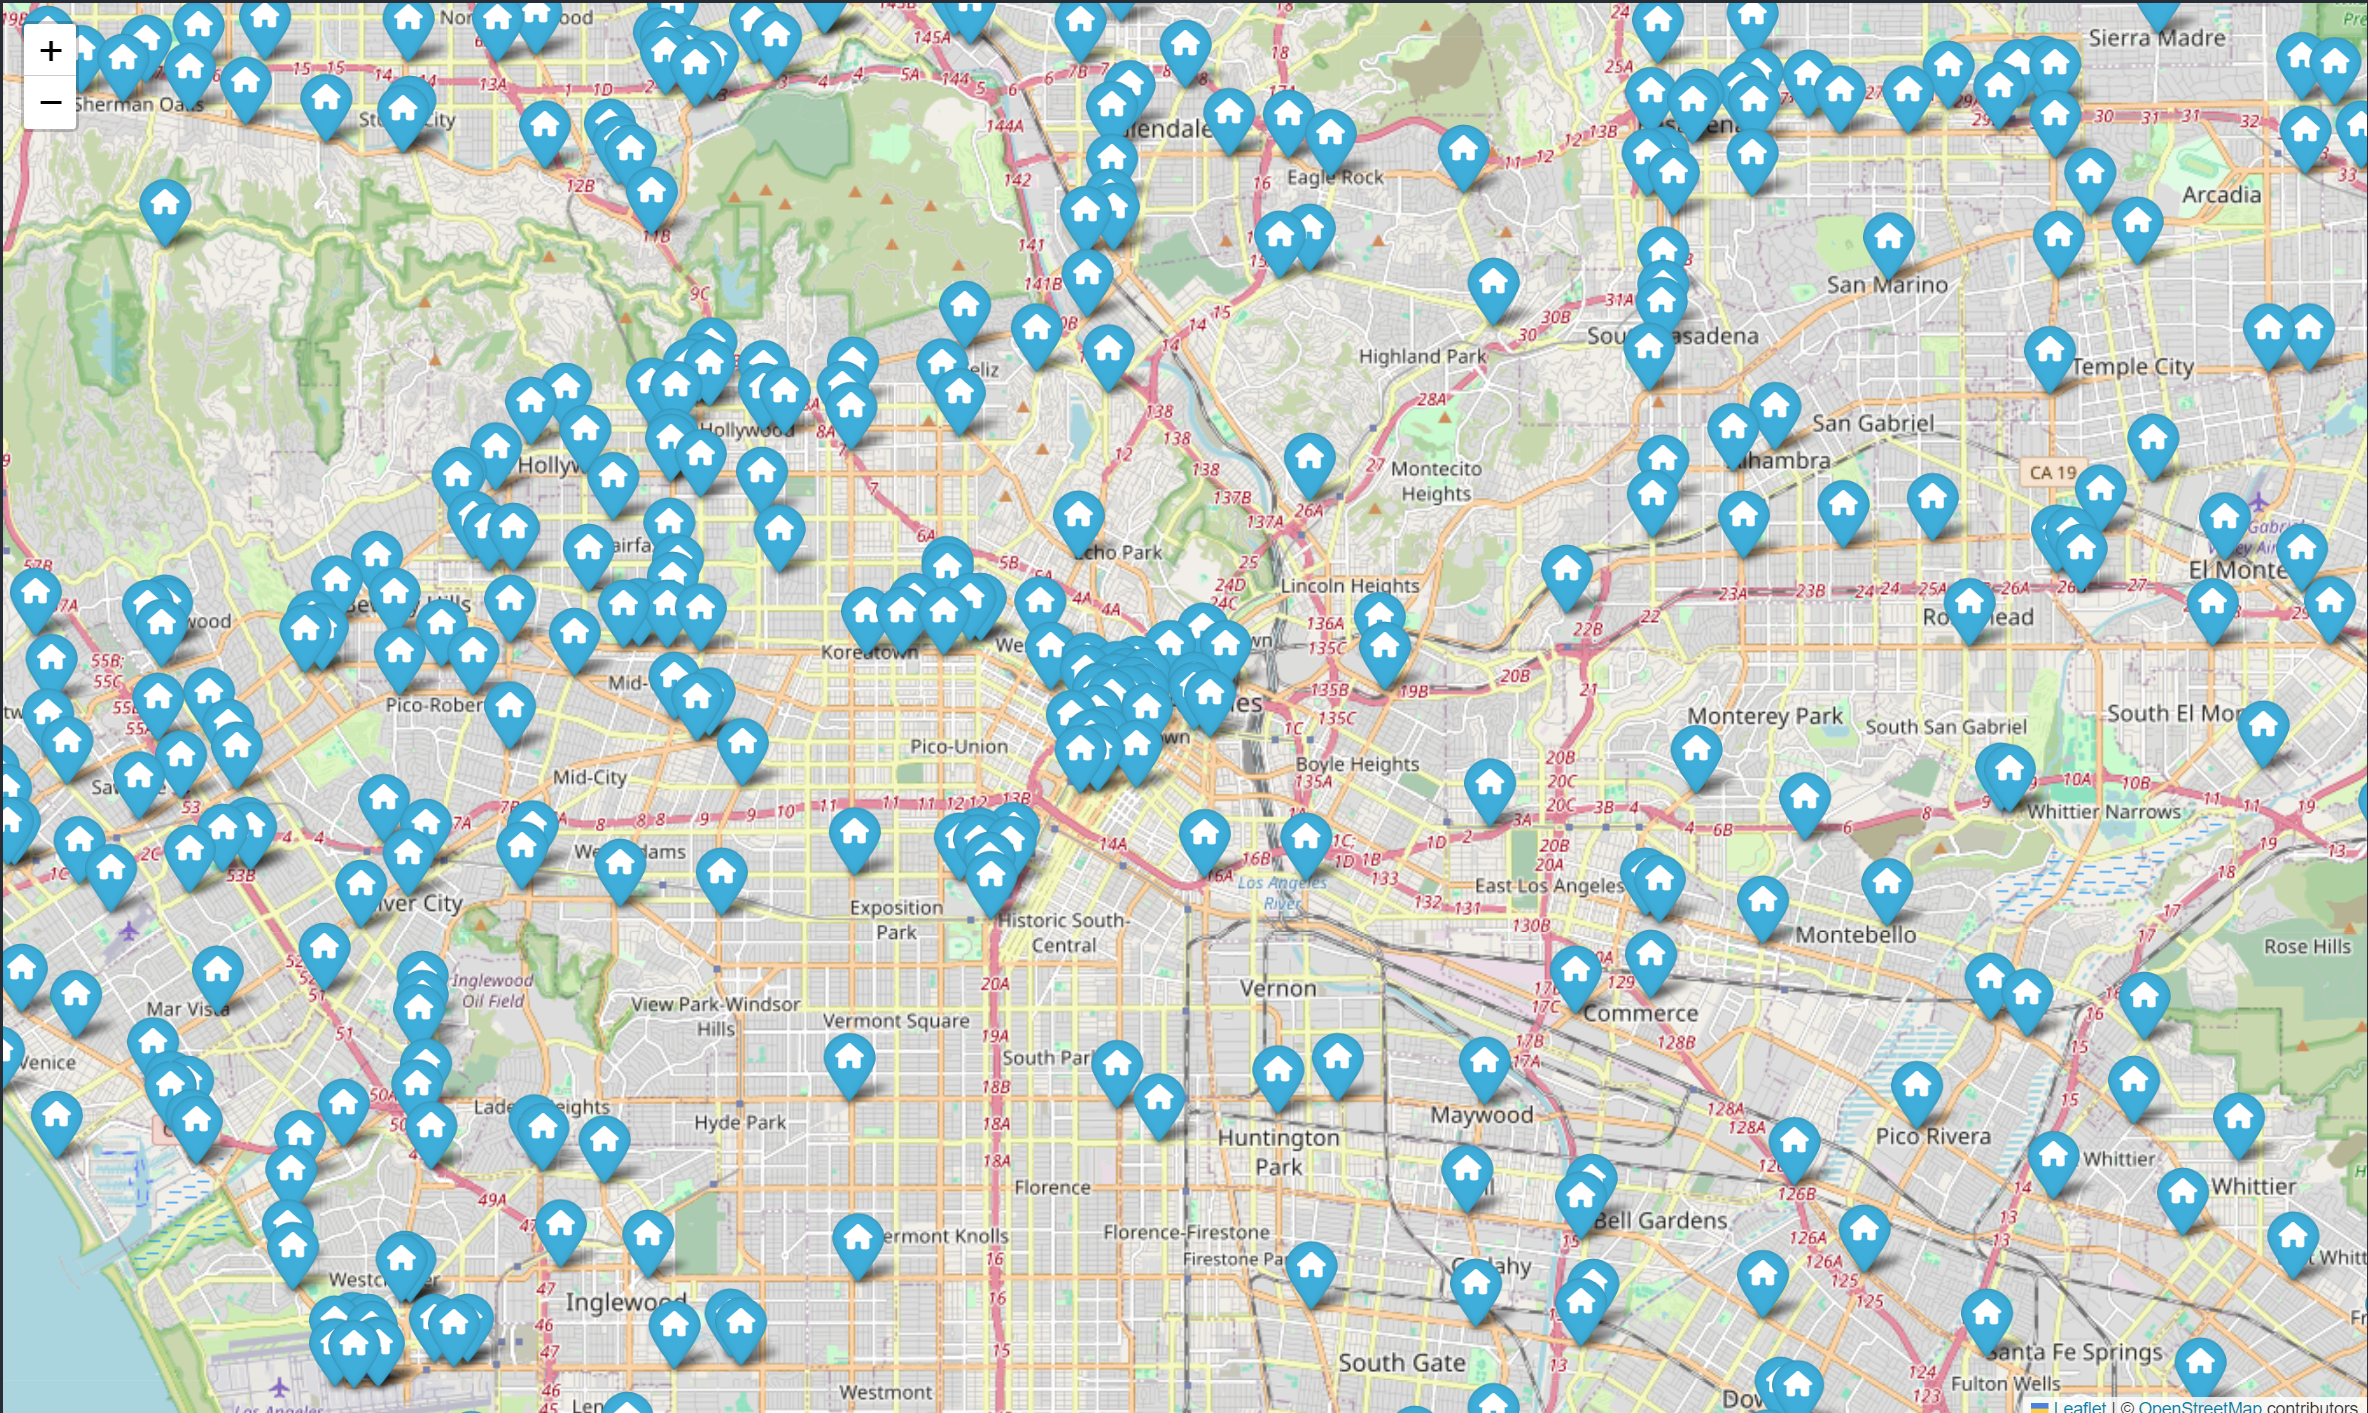
pop up map
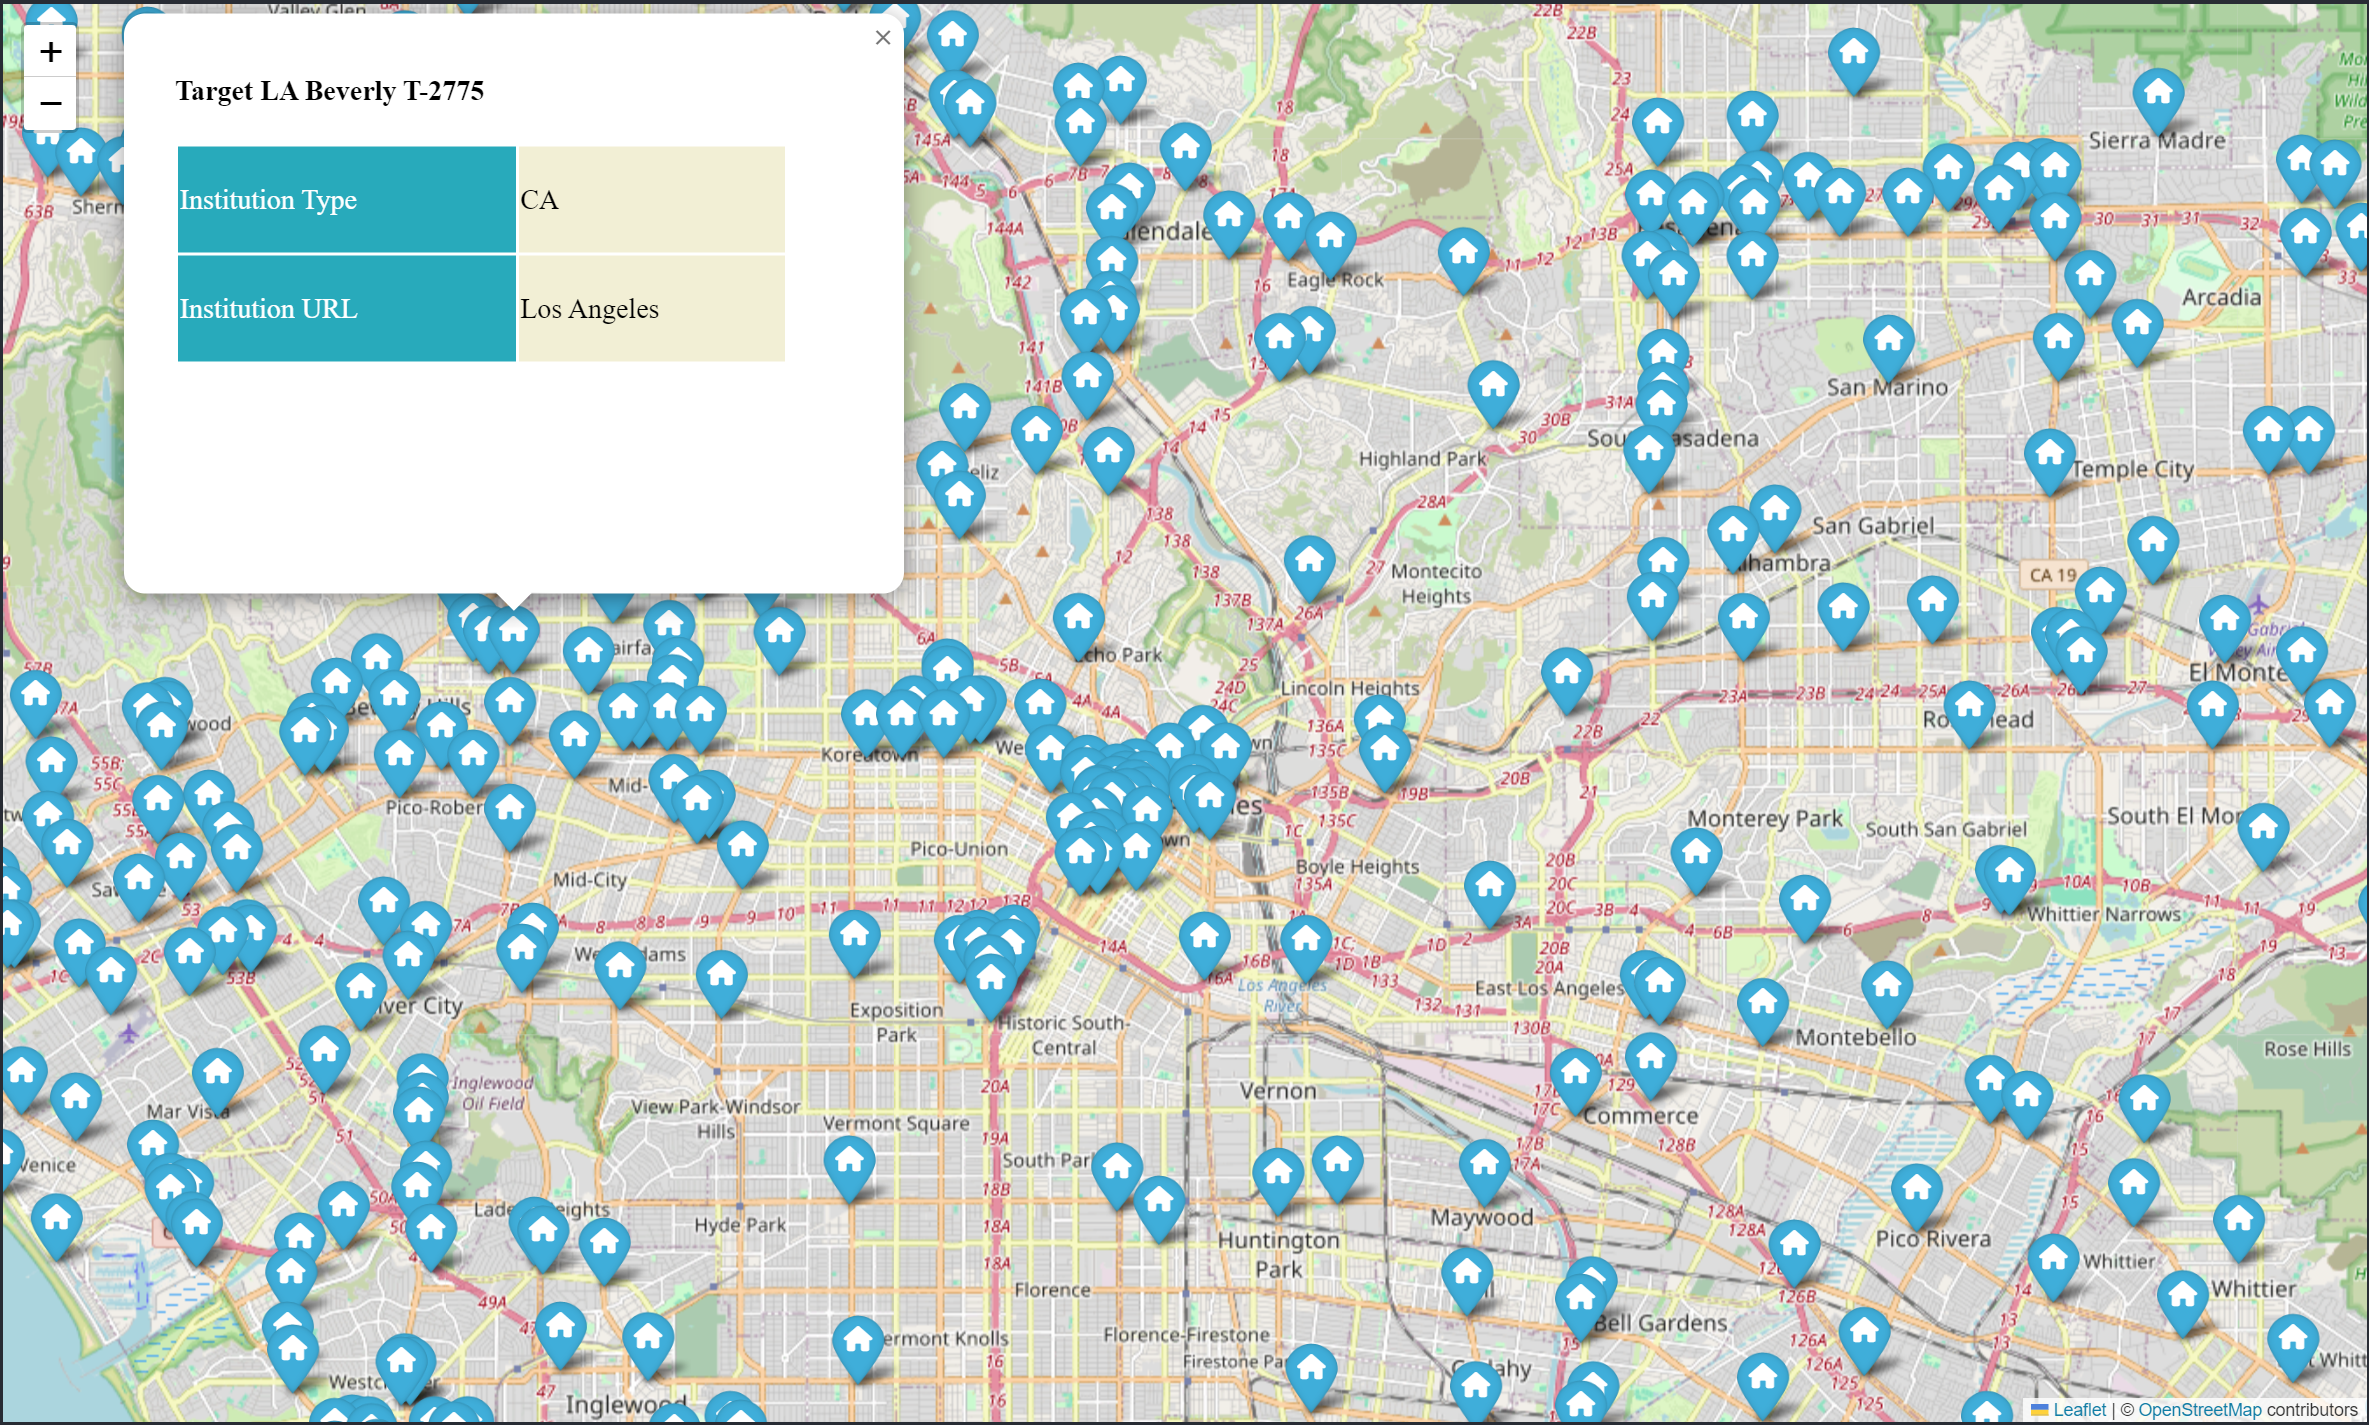
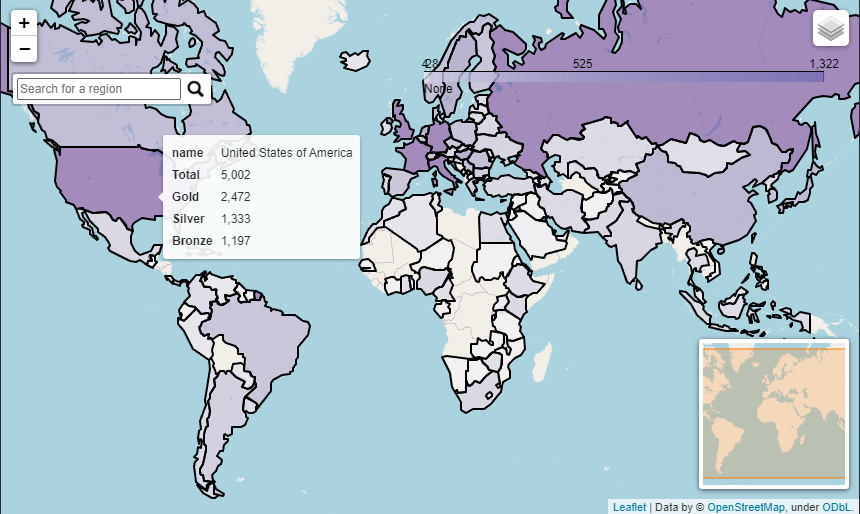
choropleth map
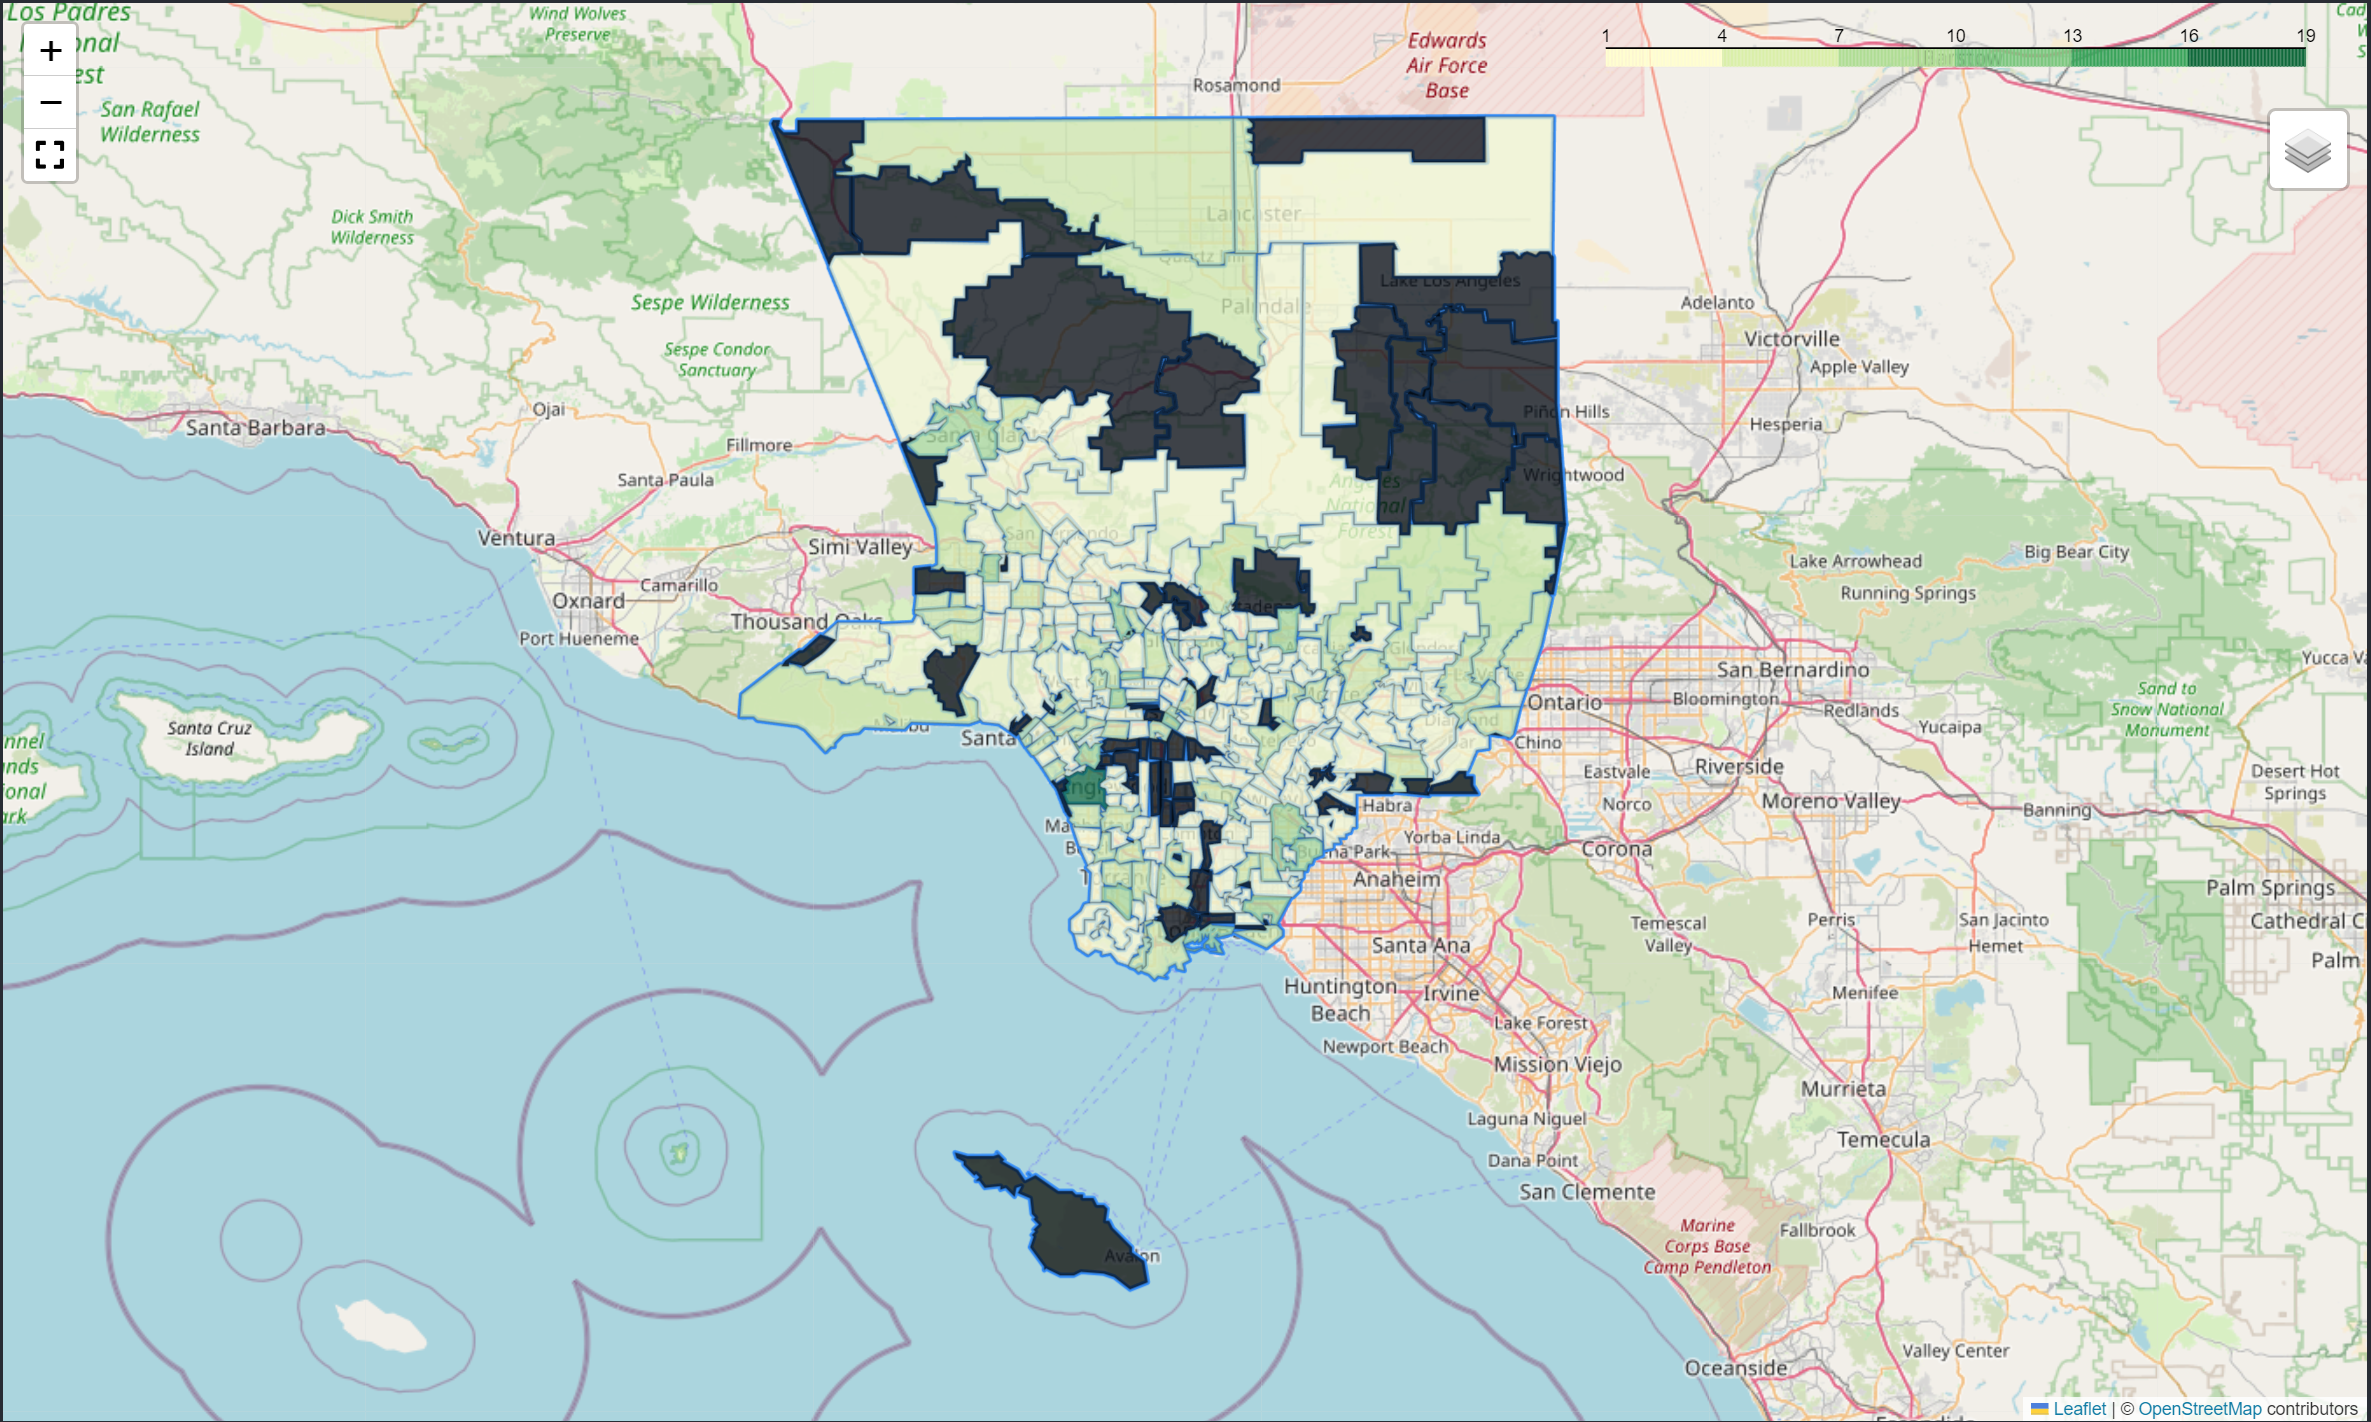
Deep Interactive map
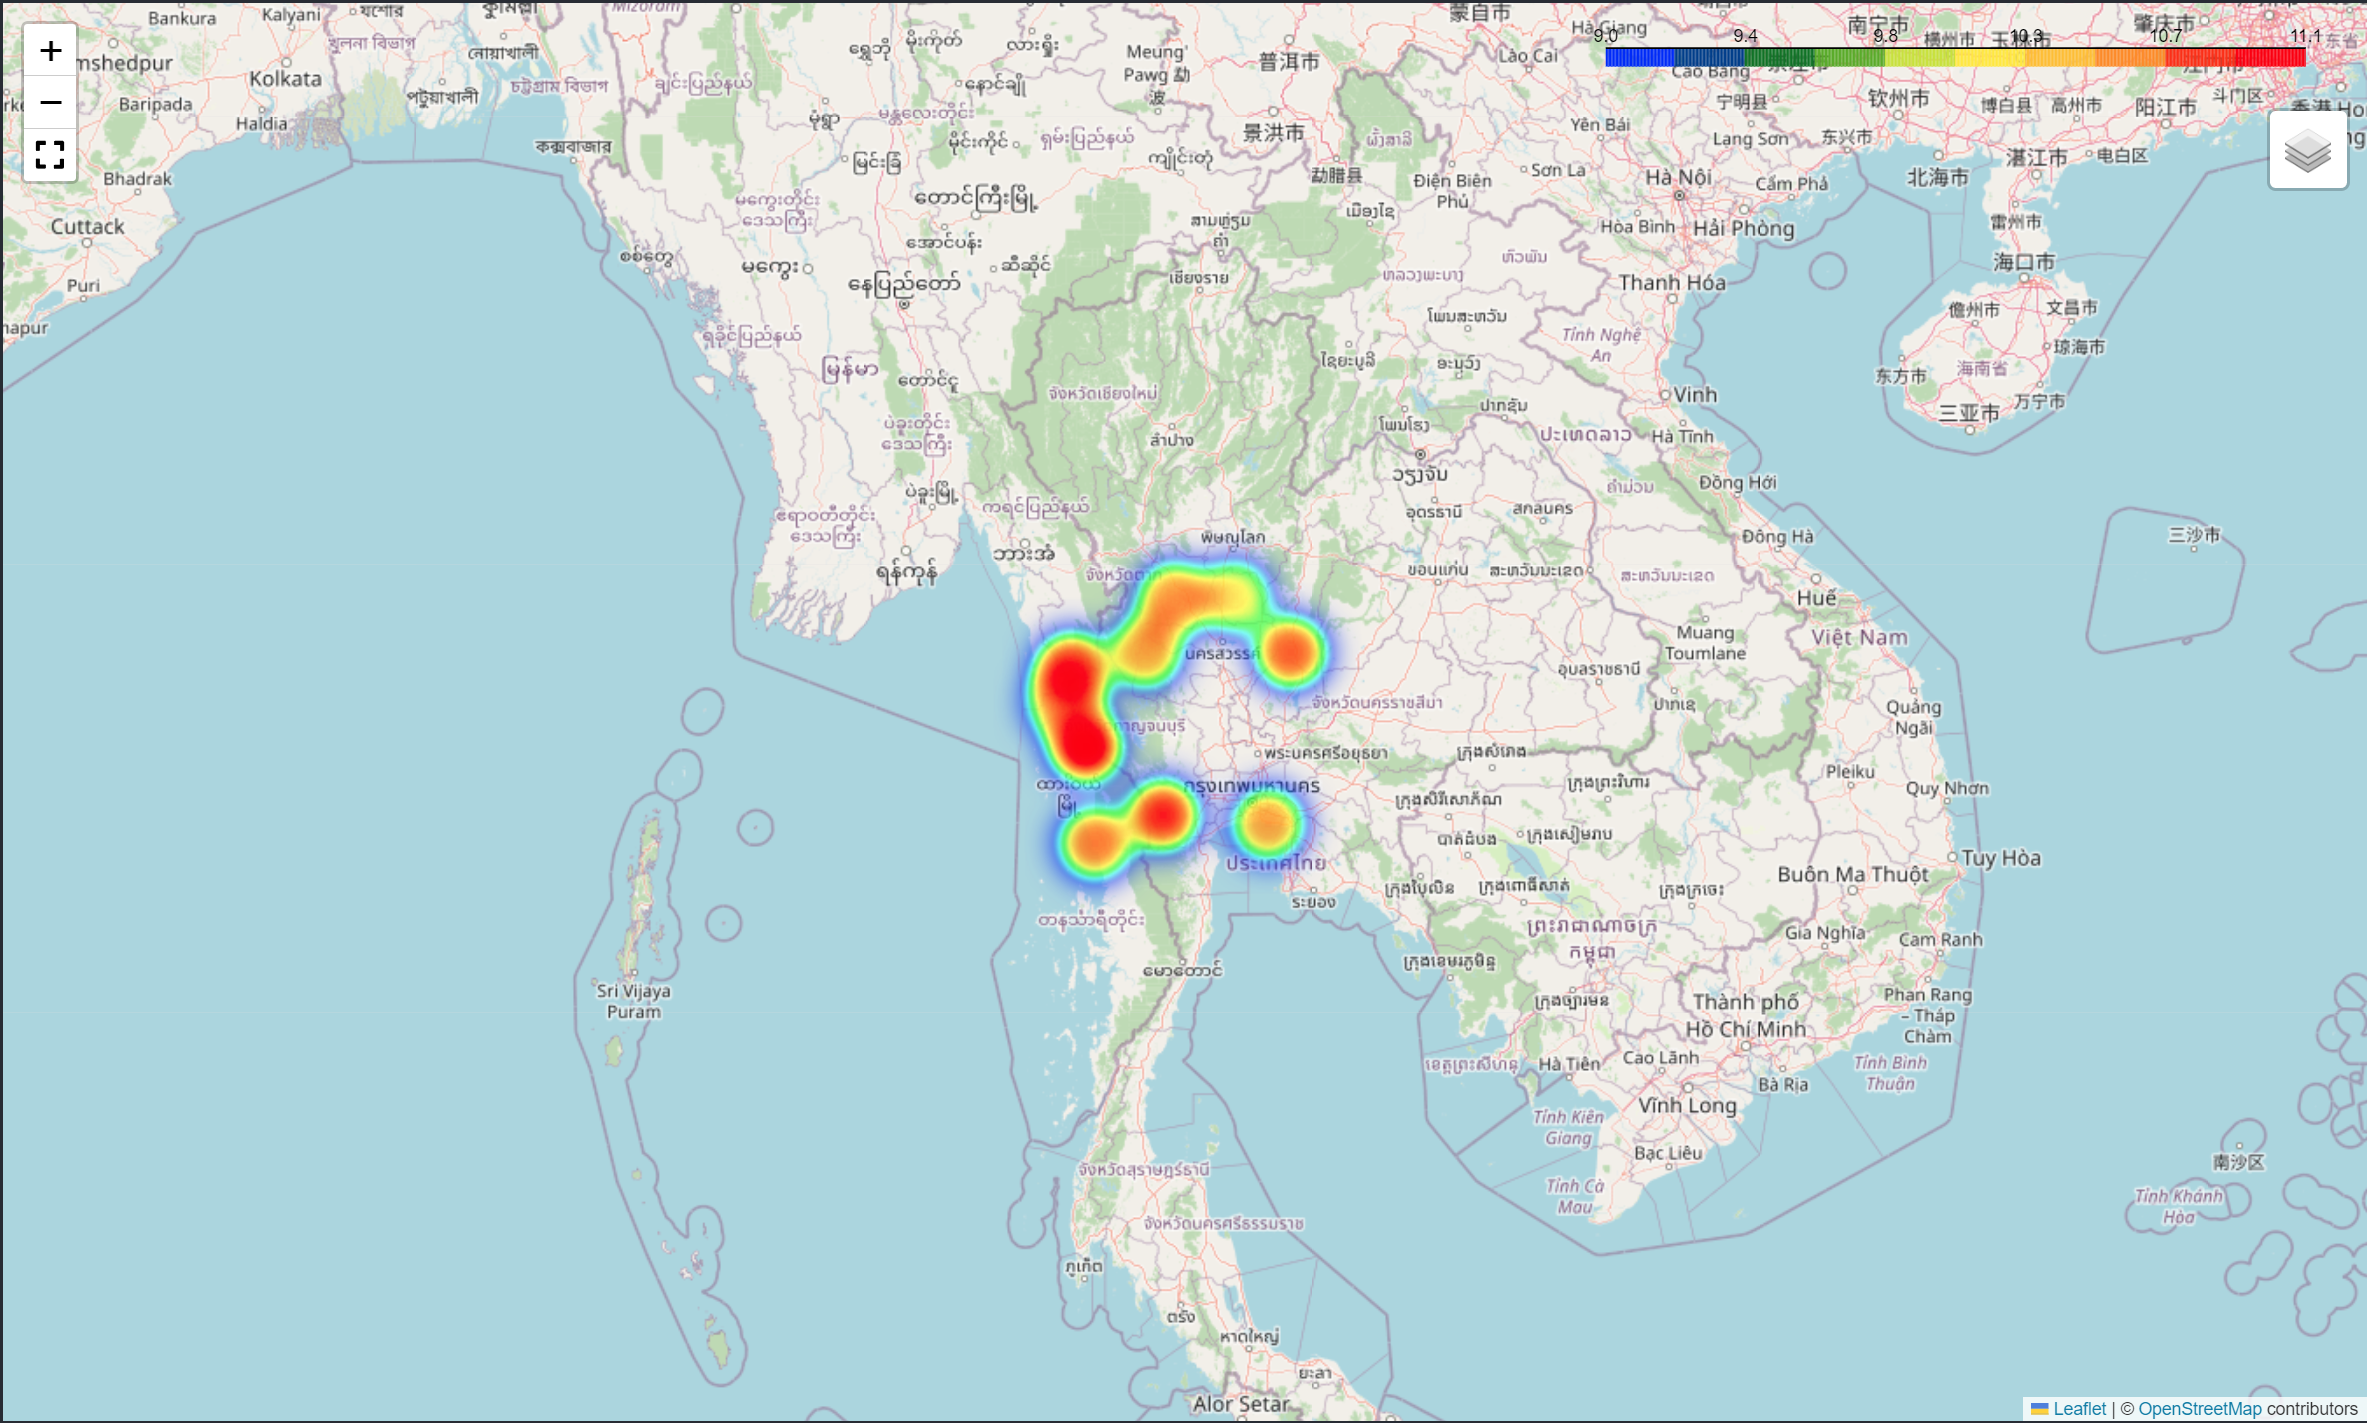
heatmap map
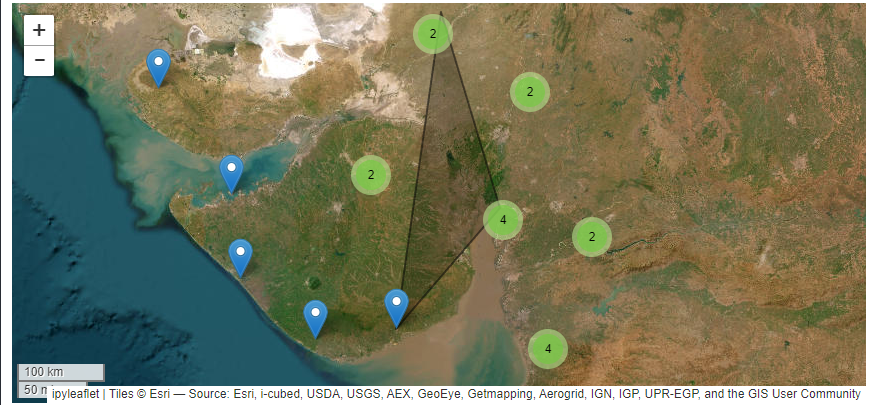
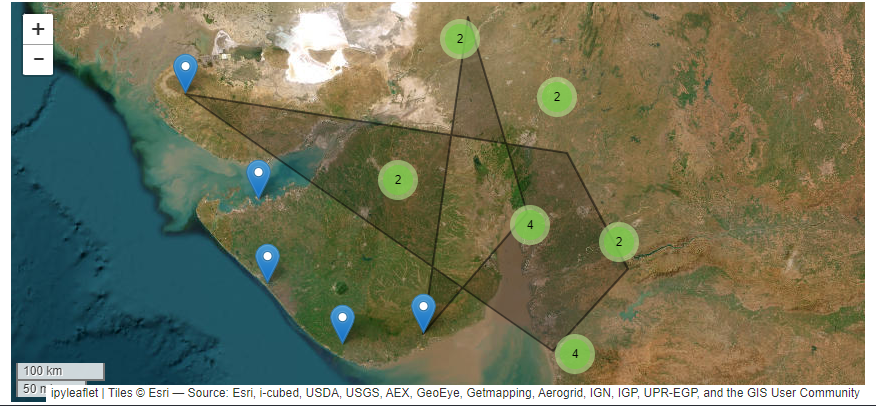
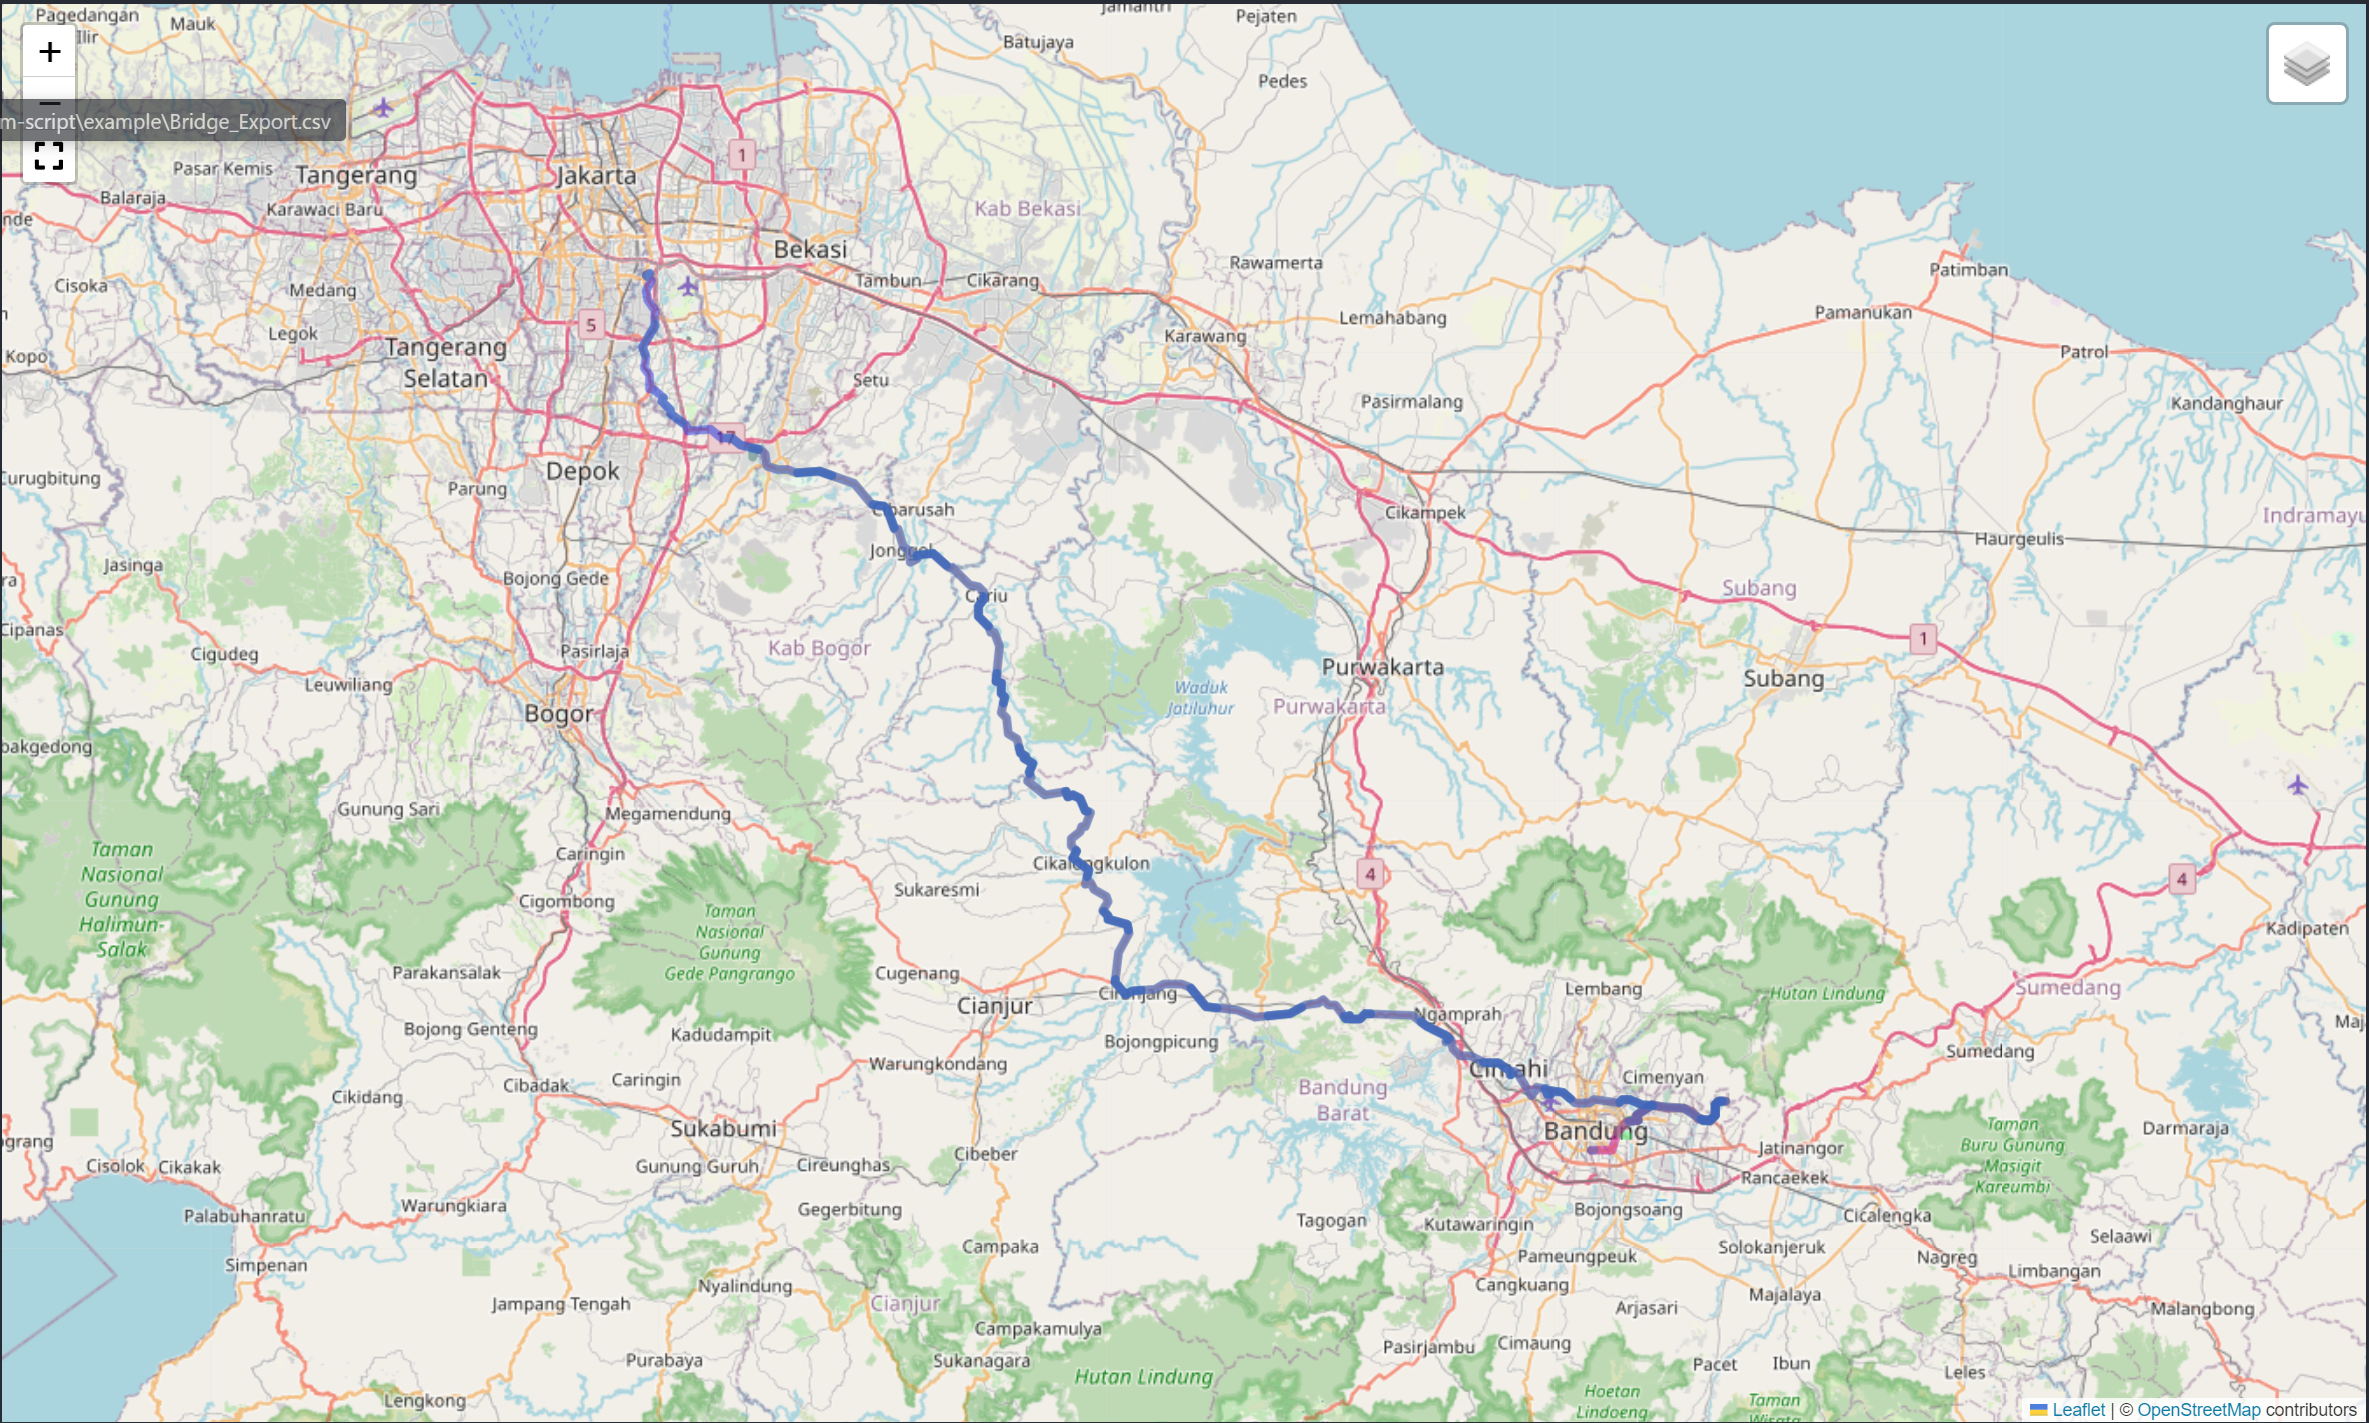
route path map
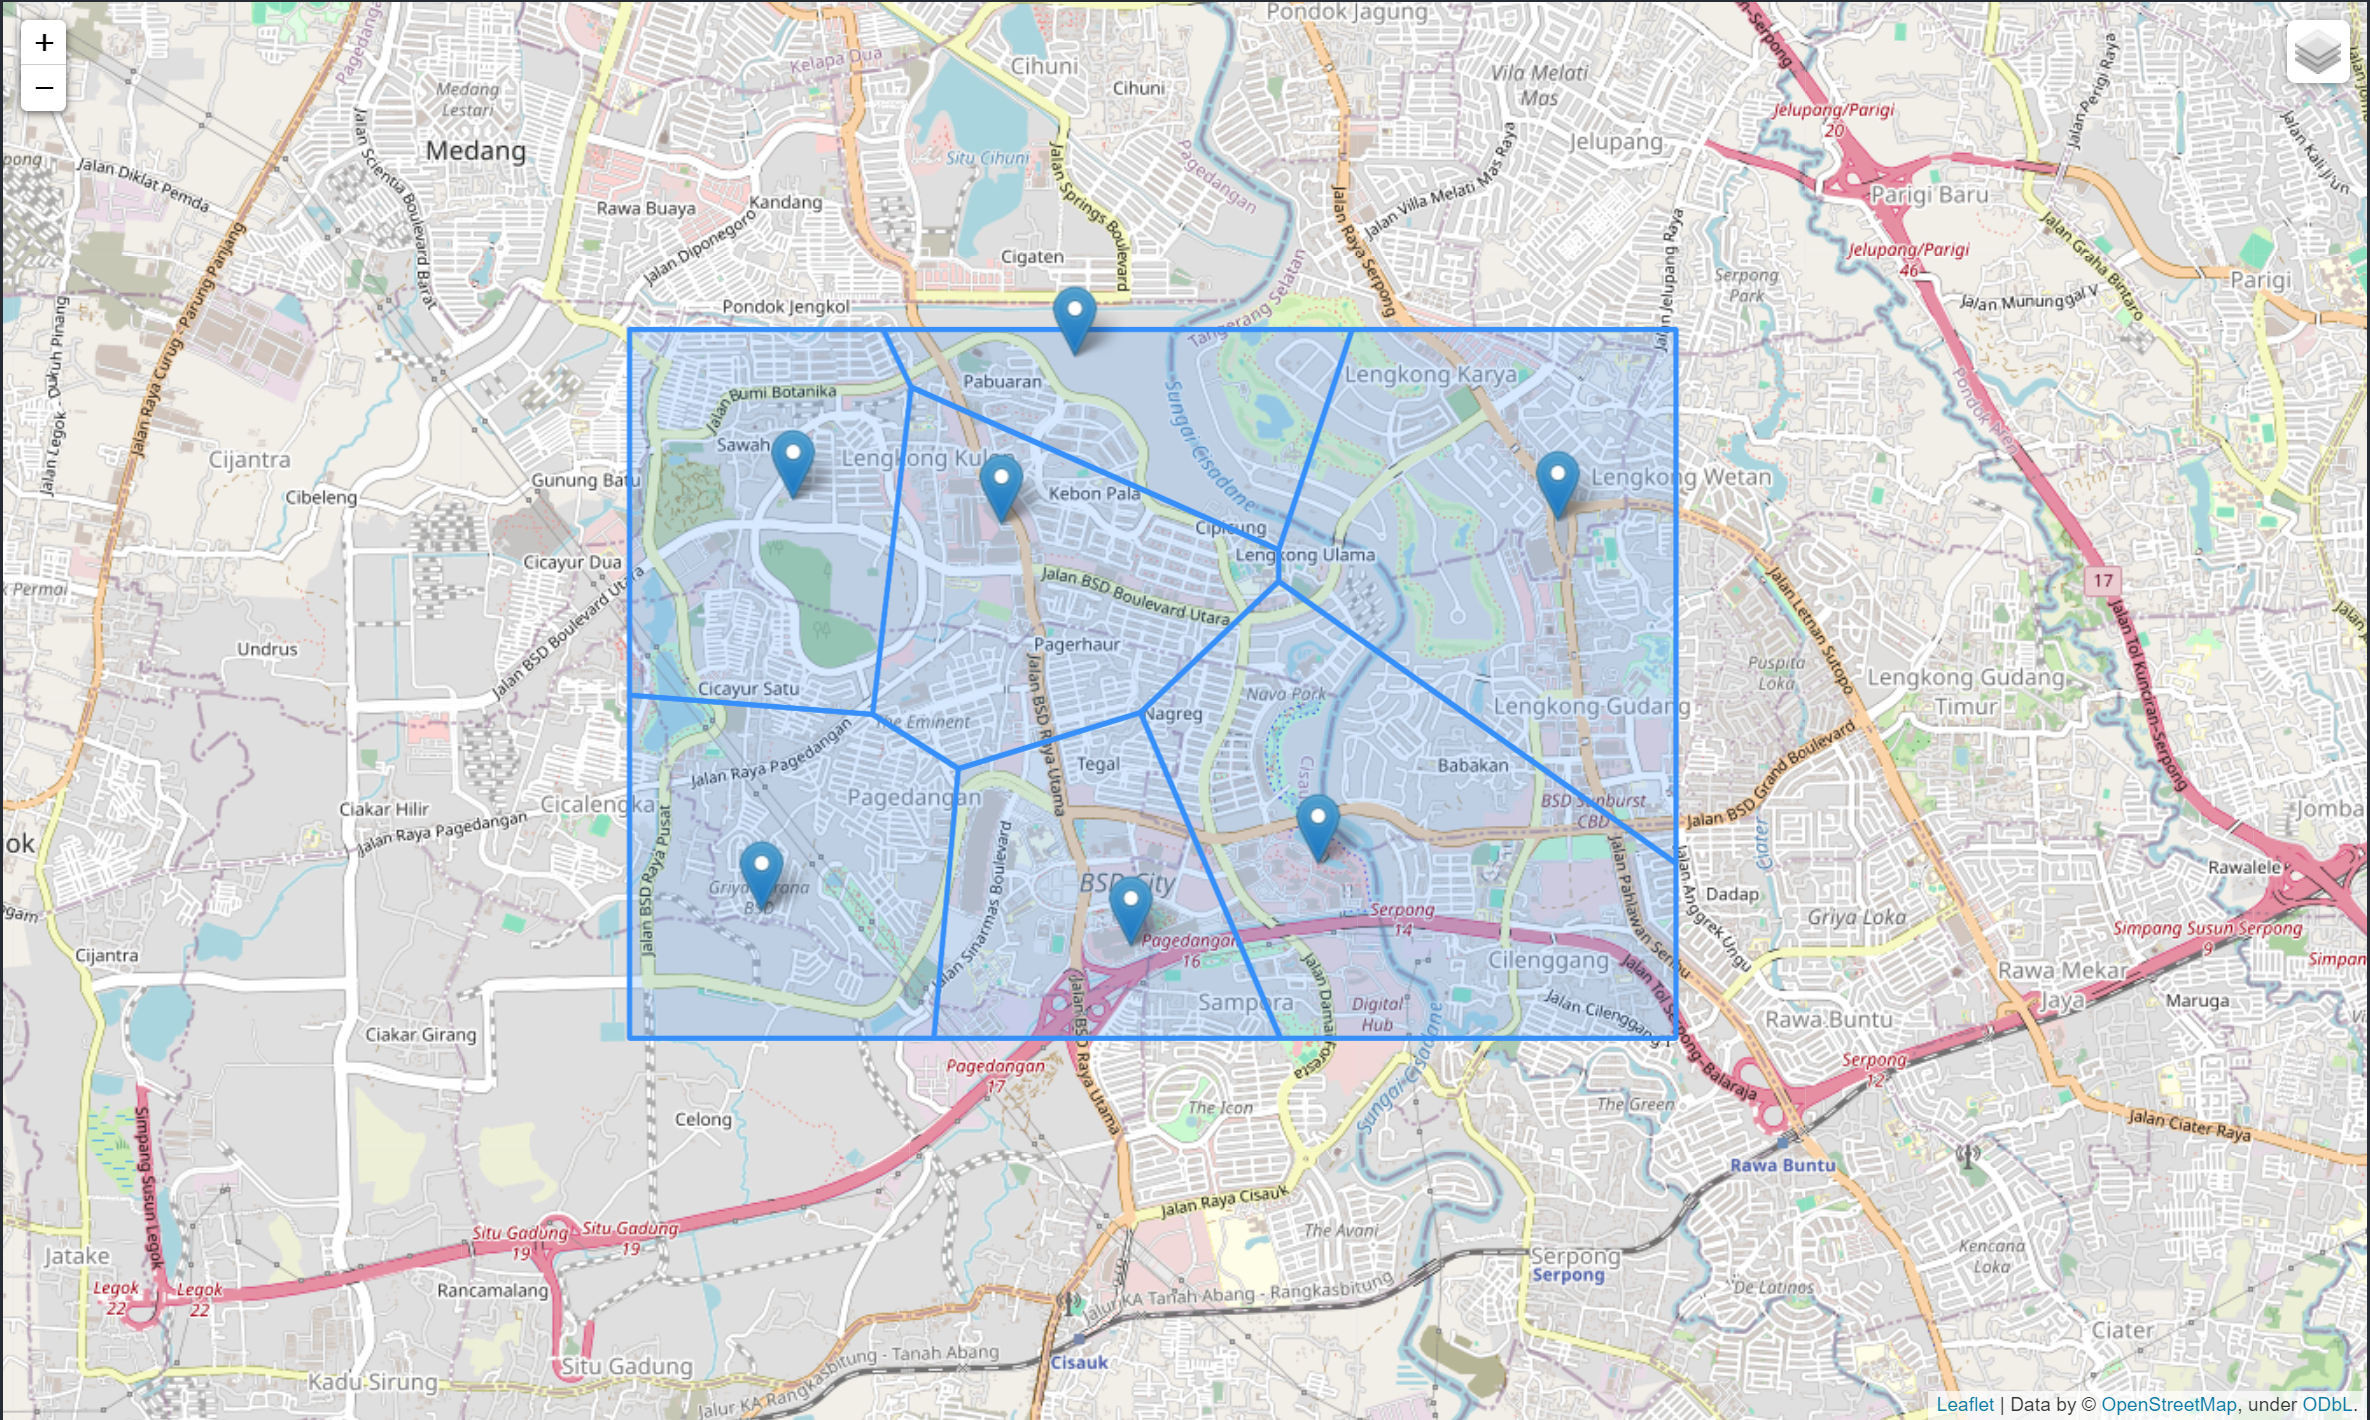
voronoi map
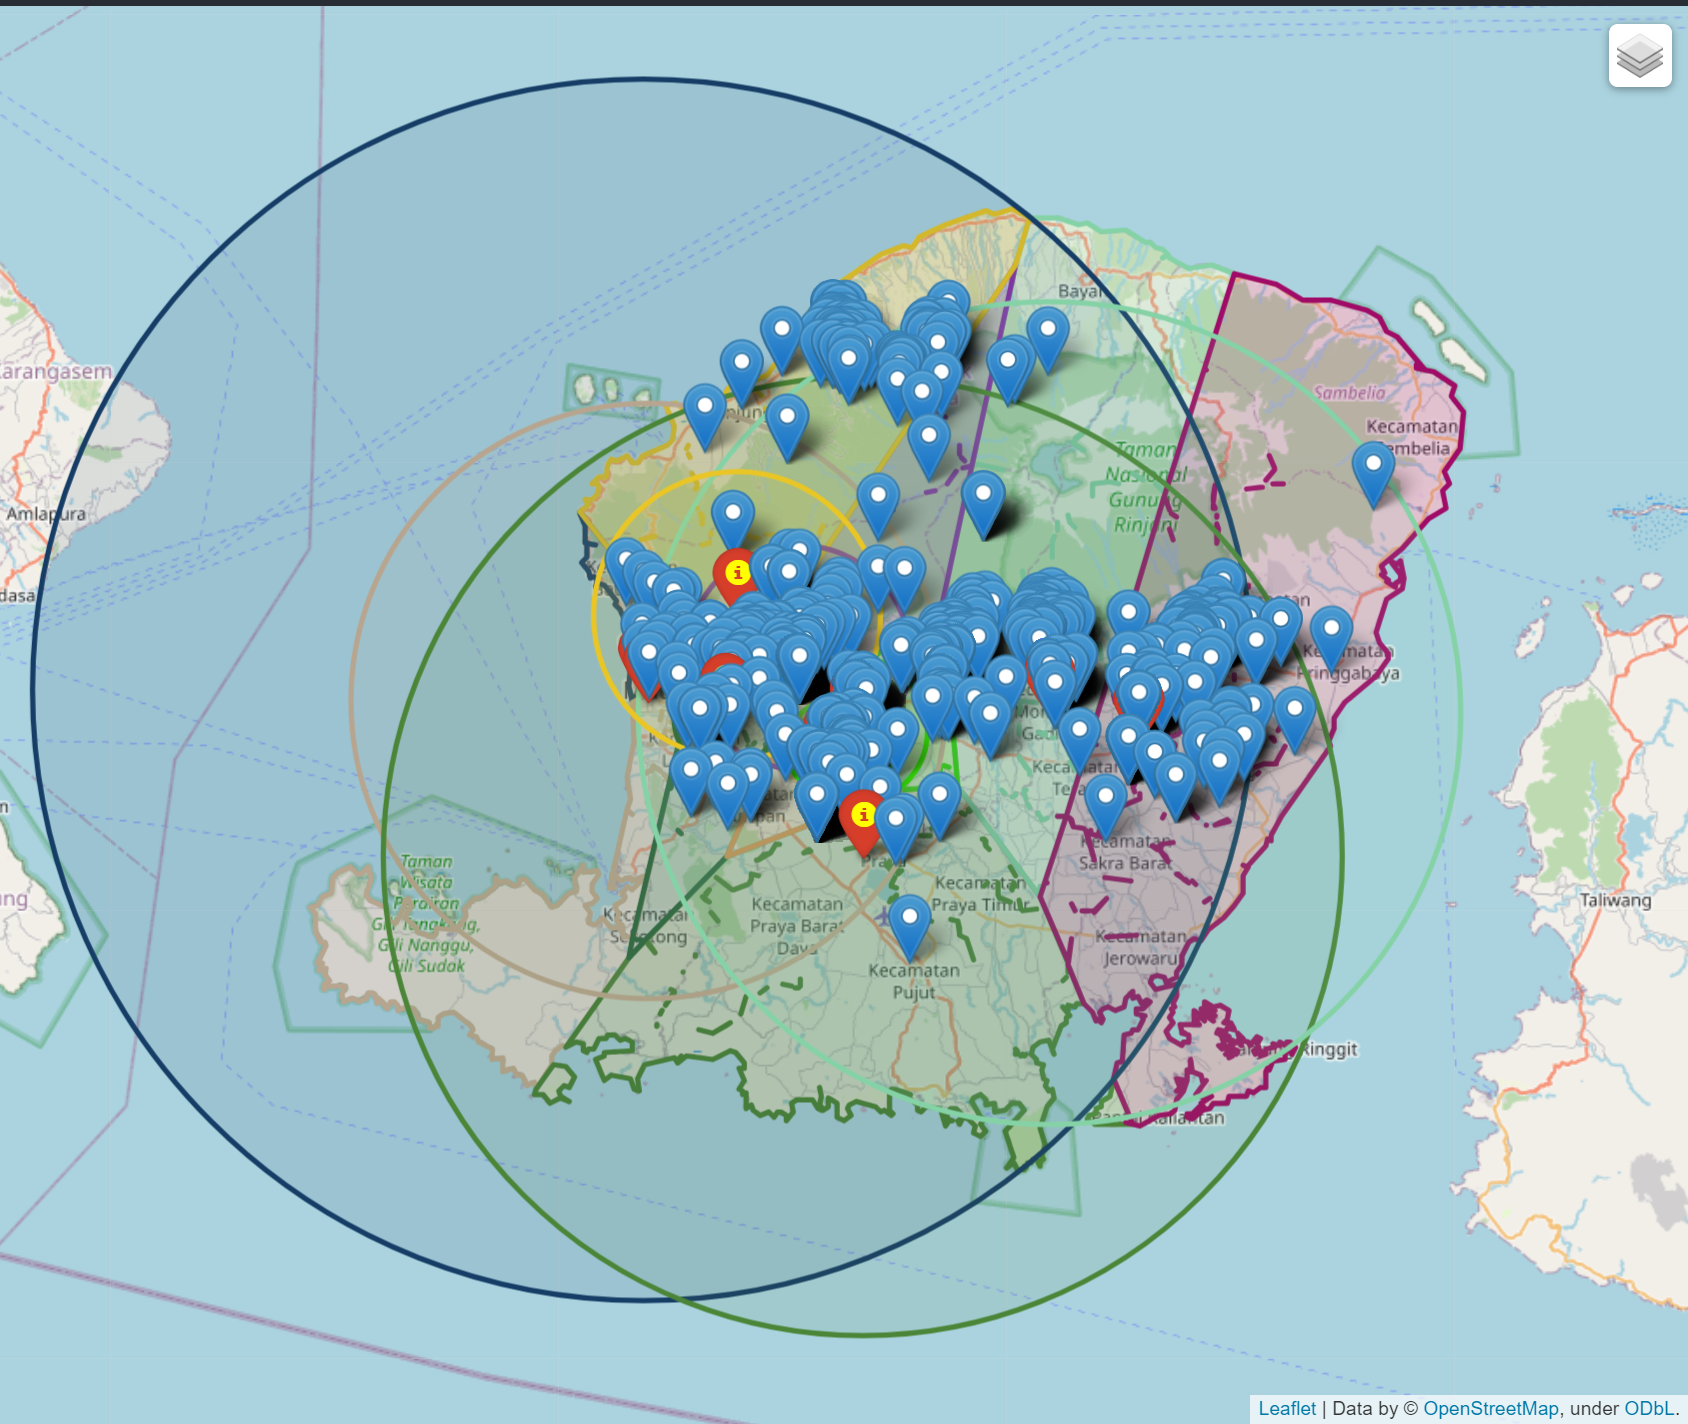
Radius cover-area
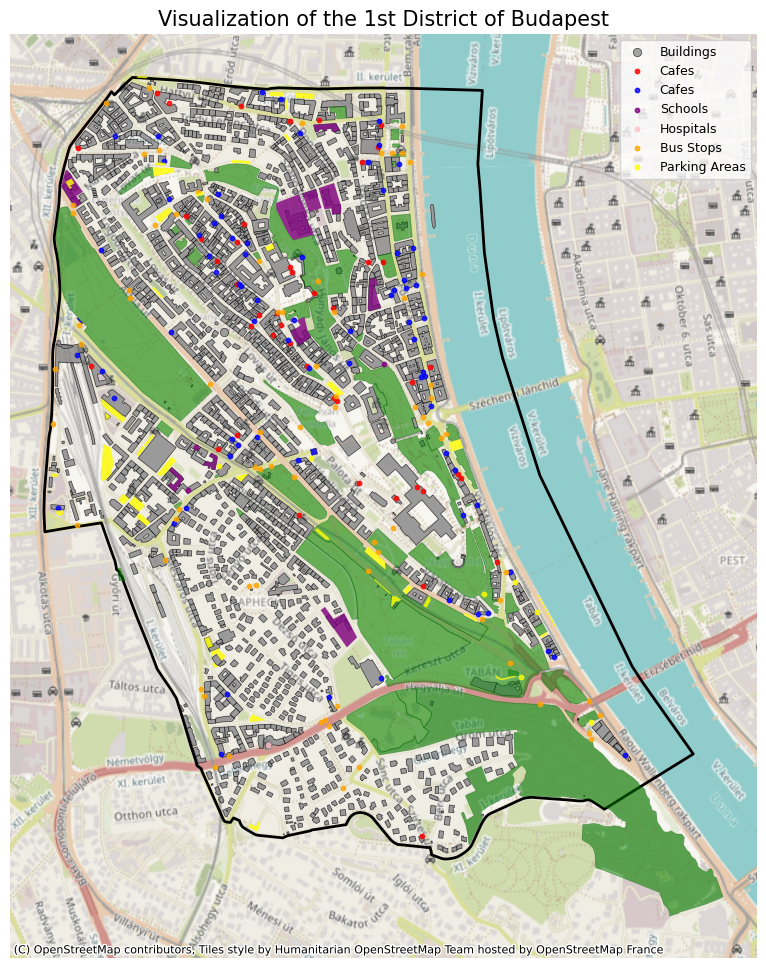
POI map plot
World map
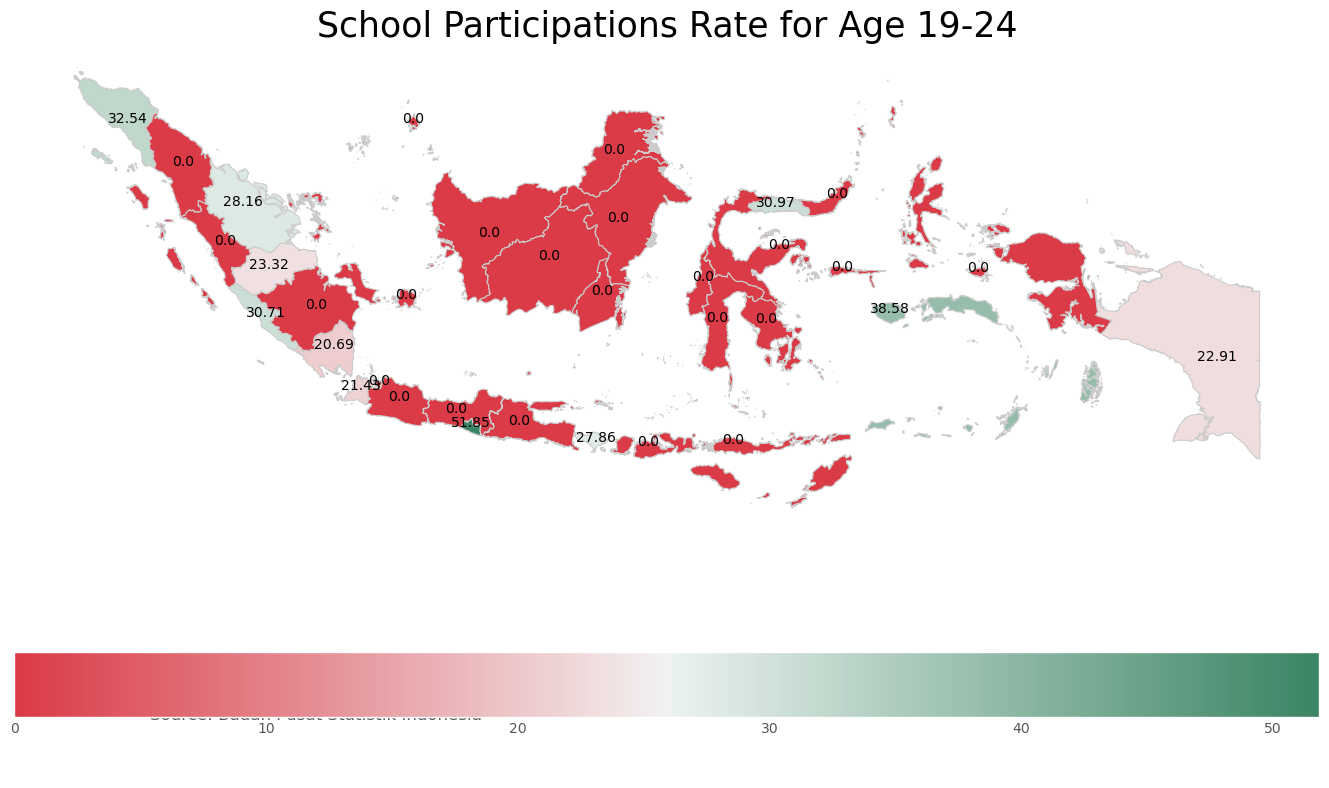
Indonesia map
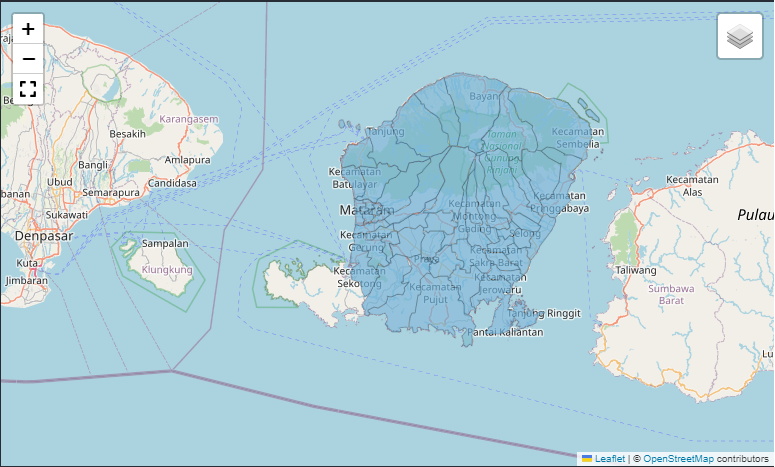
Province choropleth map
Topography map