YOLOv12 (You Only Look Once) Object Detection Model
Computer Vision
yolo
What Is YOLOv12?
Released on February 18th, 2025, YOLOv12 is a state-of-the-art computer vision model architecture. YOLOv12 was made by researchers Yunjie Tian, Qixiang Ye, David Doermann and introduced in the paper “YOLOv12: Attention-Centric Real-Time Object Detectors”. YOLOv12 has an accompanying open source implementation that you can use to fine-tune models.
The model achieves both a lower latency and higher mAP when benchmarked on the Microsoft COCO dataset. Here are the performance graphs released with the model paper:
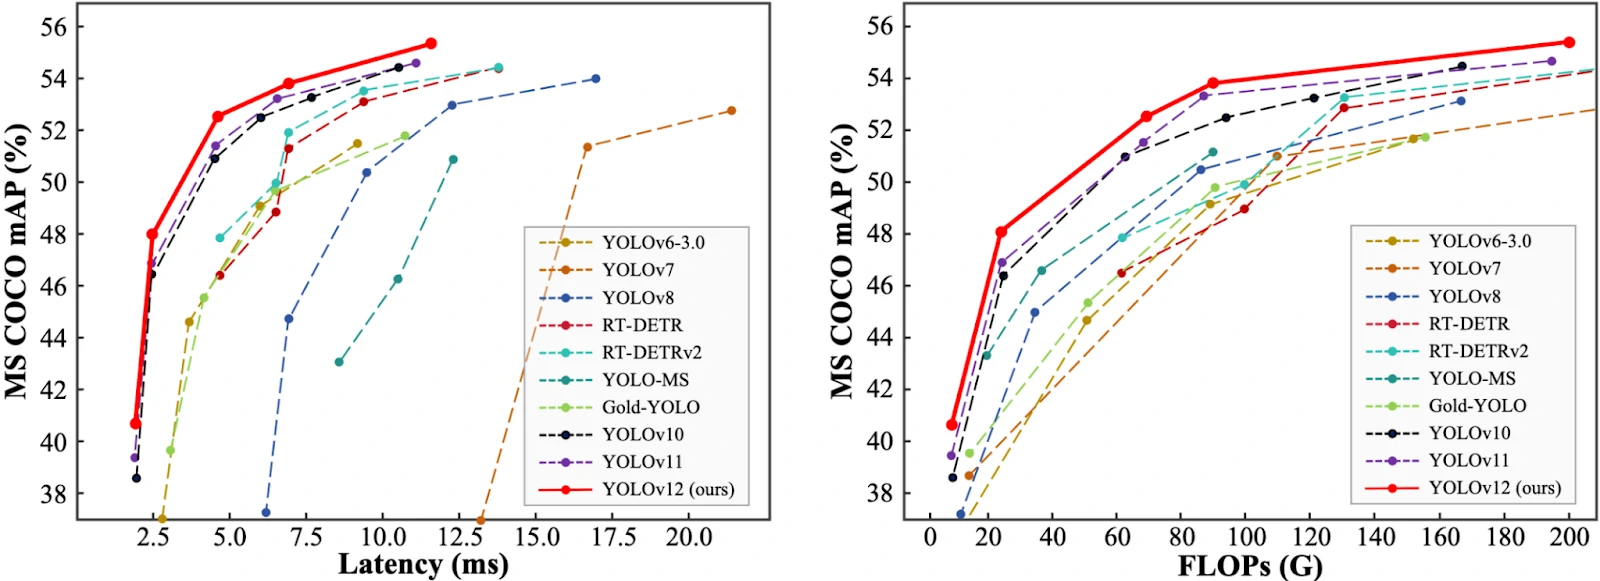
The model uses an attention-centric architecture-based YOLO implementation that “matches the speed of previous CNN-based ones while harnessing the performance benefits of attention mechanisms” according to the paper accompanying the model.
Training YOLOv12 Detecting Objects (Pothole)
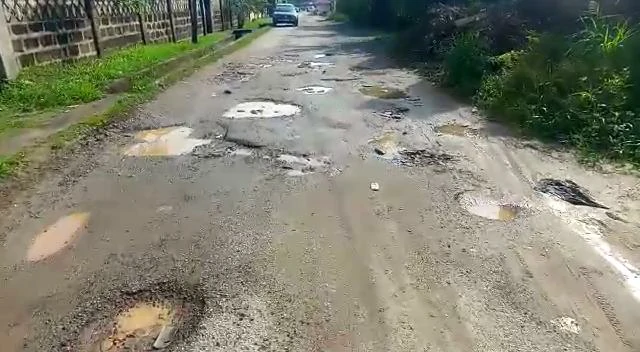
Cracks and potholes on the road aren’t just a nuisance. They’re a hazard. From damaging vehicles to causing accidents, poorly maintained roads pose a serious safety risk. Traditional inspection methods involve manual surveys, which are time-consuming, expensive, and often ineffective for real-time monitoring.
This is where deep learning steps in — specifically, object detection models that can analyze images or videos of roads and automatically detect potholes. Among the many options available, YOLOv12 stands out as one of the most powerful and efficient models to date. It builds on the success of previous YOLO versions. It incorporates cutting-edge attention mechanisms (e.g., RELAN and Area Attention), making it the first attention-powered YOLO designed for real-time applications.
Dataset
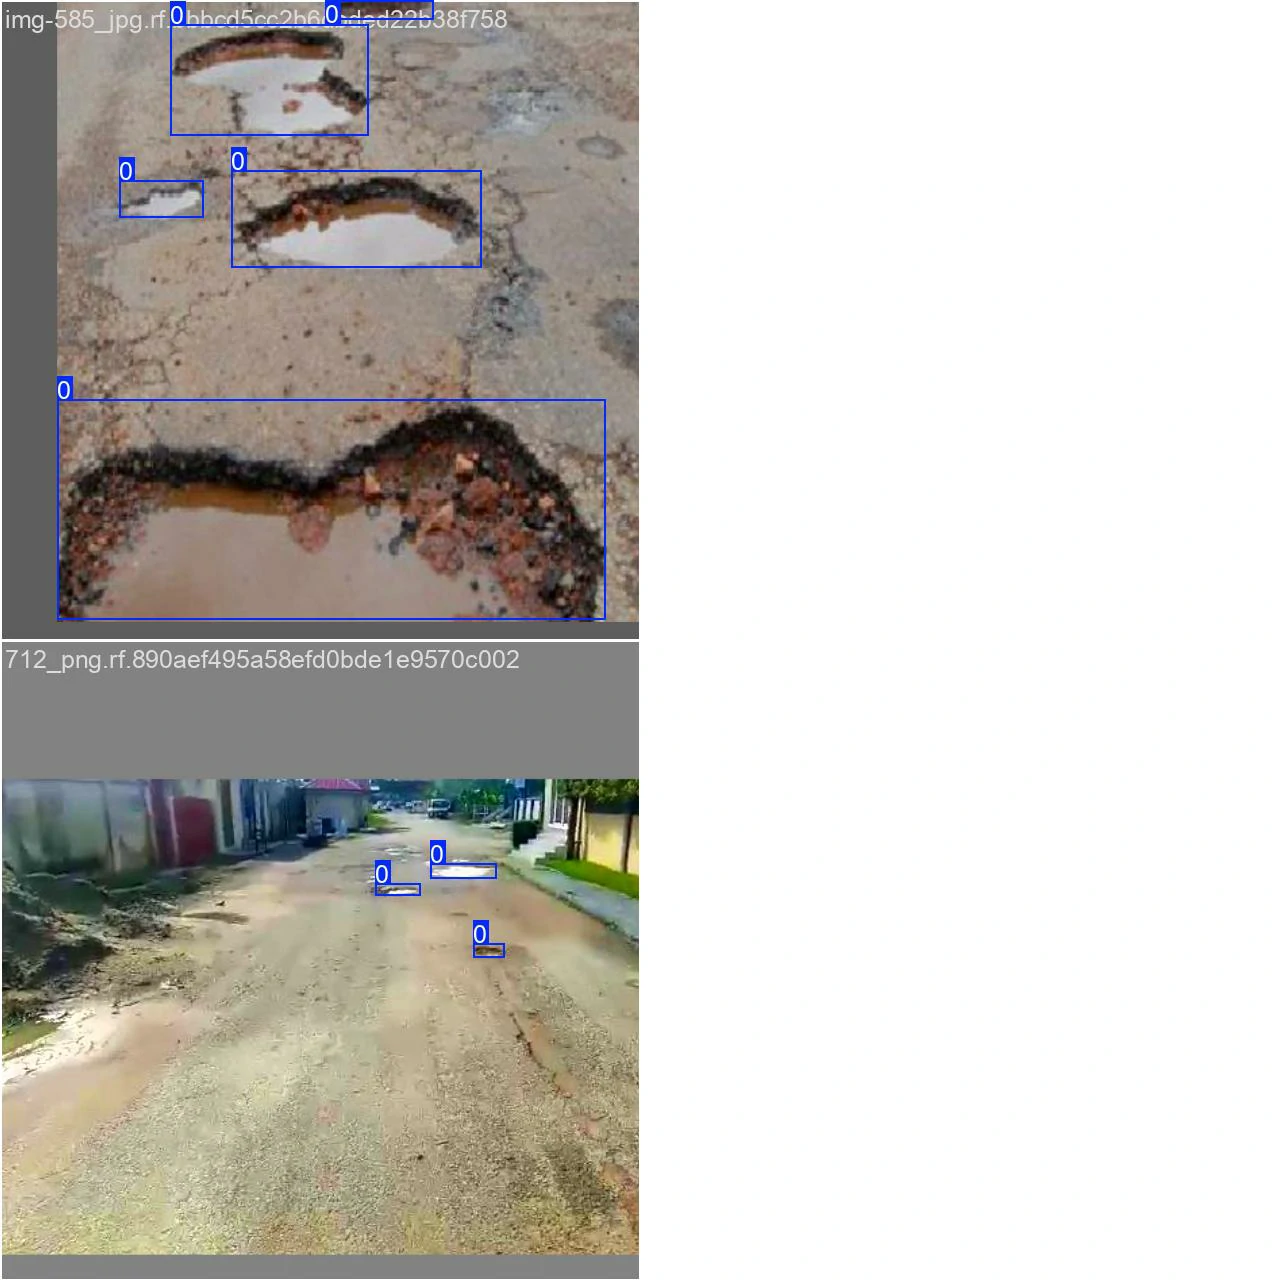
To train our YOLOv12 model for pothole detection, we’re using a public dataset from Roboflow’s Pothole Detection collection. This dataset features a diverse set of annotated pothole images captured from real roads, enabling us to fine-tune YOLOv12 on a practical use case.
Dataset Detail
- Source: Roboflow Universe
- Dataset Link: Pothole Detection Dataset v2
- Total Images: 1482
- Training: 1037 images
- Validation: 296 images
- Testing: 149 images
- Format: YOLOv12-compatible annotations
- Class: Single class (pothole)
The dataset covers potholes under varying lighting conditions, road textures, and image resolutions. Since the annotations are already in YOLO format, it’s plug-and-play for our fine-tuning workflow.
Goal
The task is to detect potholes in both images and video streams. Each detection will return a bounding box around the pothole.
From this goal, we will:
- Create a custom dataset with labeled images
- Export the dataset for use in model training
- Train the model using the a notebook
- Run inference with the model
Development Environment
let’s ensure our development environment is properly set up. We’ll need a Python environment with the following key libraries installed:
- opencv-python: For image and video handling
- numpy, scipy, matplotlib: Core scientific libraries
- YOLOv12: (cloned directly from the official repo)
- ultralytics, supervision: for training and inference model
Pre-Processing
Dataset Structure
For YOLO training, organize our data as follows:
  Dataset/
  ├── data.yaml        # Dataset configuration
  ├── train/
  │   ├── images/      # Training images
  │   └── labels/      # Training labels (YOLO format)
  ├── valid/
  │   ├── images/      # Validation images
  │   └── labels/      # Validation labels
  └── test/
      ├── images/      # Test images
      └── labels/      # Test labels
The data.yaml file should contain:
  train: /path/to/train/images
  val: /path/to/val/images
  test: /path/to/test/images
  nc: 3  # Number of classes
  names: ['class1', 'class2', 'class3']  # Class names
set data path
We set all path at pre-processing to help us for repetting input. In this path, we define all necessary paths such as dataset path, model result path, etc.
    path = r"./dataset_pothole/test"
    data_yaml_path = r'./dataset_pothole'
    model_path = r'./runs/detect/train2/weights/best.pt'
    image_path = r"./dataset_pothole/image.jpg"
    source_path=r"./dataset_pothole/video/videoPart001_2.mp4"
    target_path=r"./dataset_pothole/video/videoPart001_2_r.mp4"
    class_path= r"dataset_pothole/class.names"
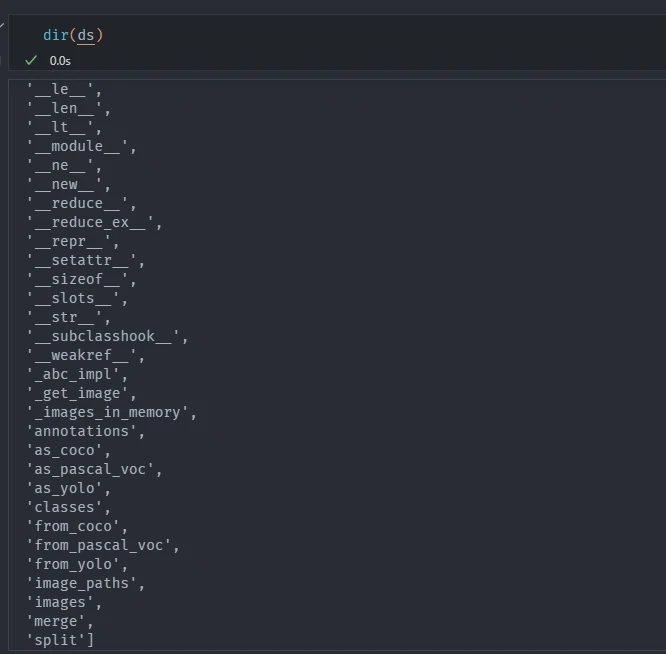
By calling, cv_class.dataset_info we can generate callable dataset path and load our test dataset in YOLO format. That will used for training and inference, such as, to check the classes that we used, total images, merging images, split images, ect. This Function parses the test image directory, label annotations, and data.yaml file to create structured dataset object (ds) that can be directly used for evaluation.
cv_class.dataset_info(path, data_yaml_path)
This function requires the following parameters:
- path (
string): Dataset location - data_yaml_path (
string): dataset yaml metadata
The result
Training Model
Fine-tune model
We are now ready to train a YOLOv12 model. Below, we can select the checkpoint from which we want to start training. You can use:
- yolov12n.pt
- yolov12s.pt
- yolov12m.pt
- yolov12l.pt
- yolov12x.pt
Each name relate to variant sizes of models in every task, Nano (N), Small (S), Medium (M), Large (L), and eXtra large (X). Nano and small are used primarily in test batches, medium and large are used in small applications, and extra large is used in industrial standards with large datasets or to provide the best performing model. Beside that, if we are doing something other than detect or track you need to have an extension to the base name:
- Segment =
-seg - OBB =
-obb - Pose =
-pose - Classify =
-cls
We fine-tune the small variant yolov12s.pt for 50 epochs. Training for 50 epochs takes ~30 minutes on a T4 GPU. We can try larger variants (e.g., yolov12m, yolov12l, or yolov12x) for better performance (with longer training time).
By calling, cv_class.dataset_info we can generate callable dataset path that will used for training and inference, such as, to check the classes that we used, total images, merging images, split images, ect.
cv_class.pre_training(model_path, data_yaml_path, epochs=1, batch=2)
This function requires the following parameters:
- path (
string): Dataset location - data_yaml_path (
string): dataset yaml metadata - epochs: number of iteration that we will run on out model
- batch: batch images that consume to GPU
Load architecture and model
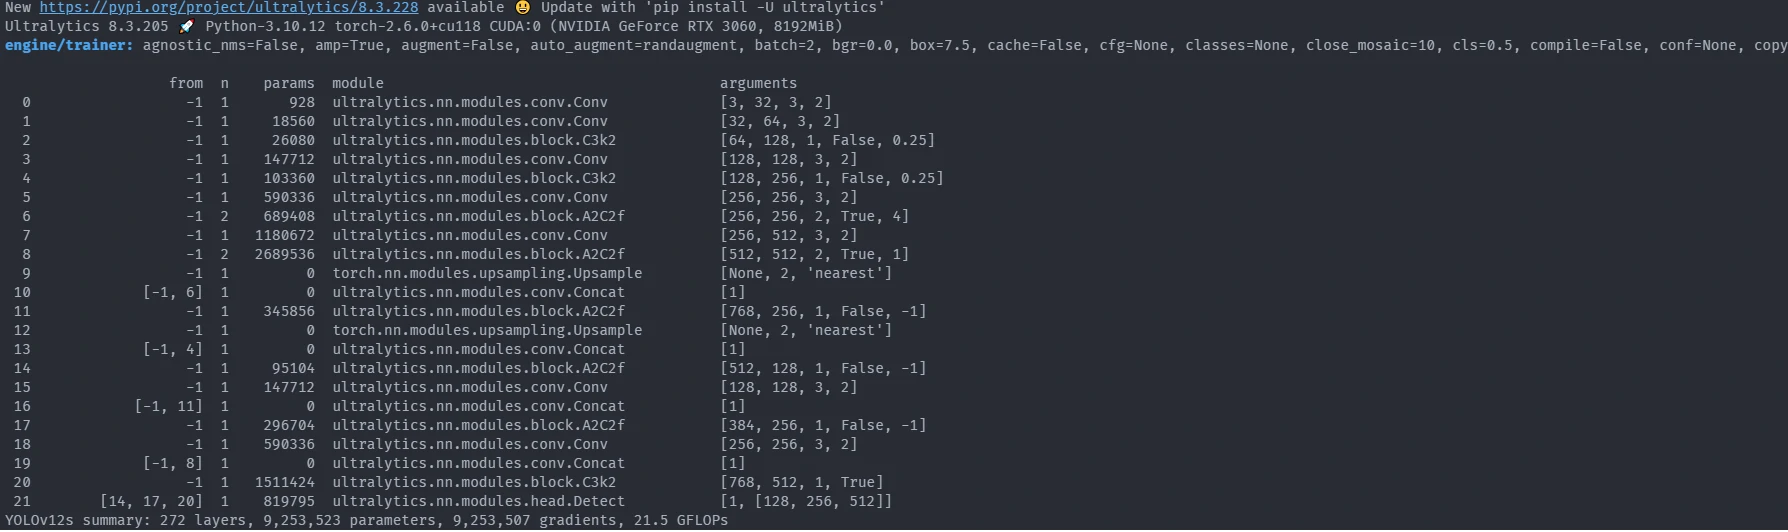
From the image above, we can collect some information for our training process:
- Python version: Python-3.10.12
- Torch version: torch-2.6.0+cu118
- GPU: CUDA:0 (NVIDIA GeForce RTX 3060, 8192MiB)
- Default parameters: agnostic_nms=False, amp=True, augment=False, auto_augment=randaugment, batch=2, bgr=0.0, box=7.5, cache=False, cfg=None, classes=None, close_mosaic=10, cls=0.5, compile=False, conf=None, copy_paste=0.0, copy_paste_mode=flip, cos_lr=False, cutmix=0.0, data=./dataset_pothole/data.yaml, degrees=0.0, deterministic=True, device=0, dfl=1.5, dnn=False, dropout=0.0, dynamic=False, embed=None, epochs=1, erasing=0.4, exist_ok=False, fliplr=0.5, flipud=0.0, format=torchscript, fraction=1.0, freeze=None, half=True, hsv_h=0.015, hsv_s=0.7, hsv_v=0.4, imgsz=640, int8=False, iou=0.7, keras=False, kobj=1.0, line_width=None, lr0=0.01, lrf=0.01, mask_ratio=4, max_det=300, mixup=0.0, mode=train, model=./runs/detect/train2/weights/best.pt, momentum=0.937, mosaic=1.0, multi_scale=False, name=train, nbs=64, nms=False, opset=None, optimize=False, optimizer=auto, overlap_mask=True, patience=100, perspective=0.0, plots=True, pose=12.0, pretrained=True, profile=False, project=None, rect=False, resume=False, retina_masks=False, save=True, save_conf=False, save_crop=False, save_dir=/mnt/f/computer_vision/yolo12/runs/detect/train, save_frames=False, save_json=False, save_period=-1, save_txt=False, scale=0.5, seed=0, shear=0.0, show=False, show_boxes=True, show_conf=True, show_labels=True, simplify=True, single_cls=False, source=None, split=val, stream_buffer=False, task=detect, time=None, tracker=botsort.yaml, translate=0.1, val=True, verbose=True, vid_stride=1, visualize=False, warmup_bias_lr=0.1, warmup_epochs=3.0, warmup_momentum=0.8, weight_decay=0.0005, workers=8, workspace=None
- Pre-training model
- YOLOv12s summary: 272 layers, 9,253,523 parameters, 9,253,507 gradients, 21.5 GFLOPs
- pretrained weights: 691/691 items
- Freezing layer: model.21.dfl.conv.weight
Training pretrained weights
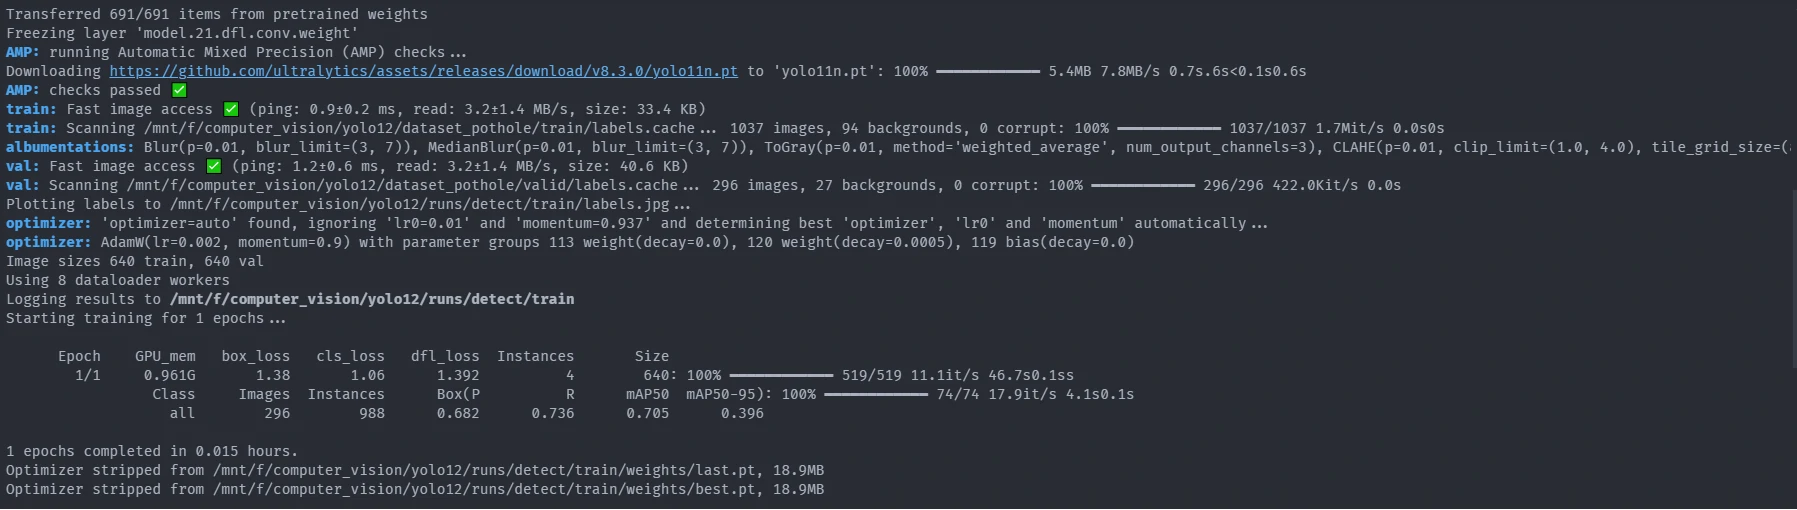
From the image above, we can see how each epoch run, allocate GPU memory, Training and Validing loss, and metrics.
Validating
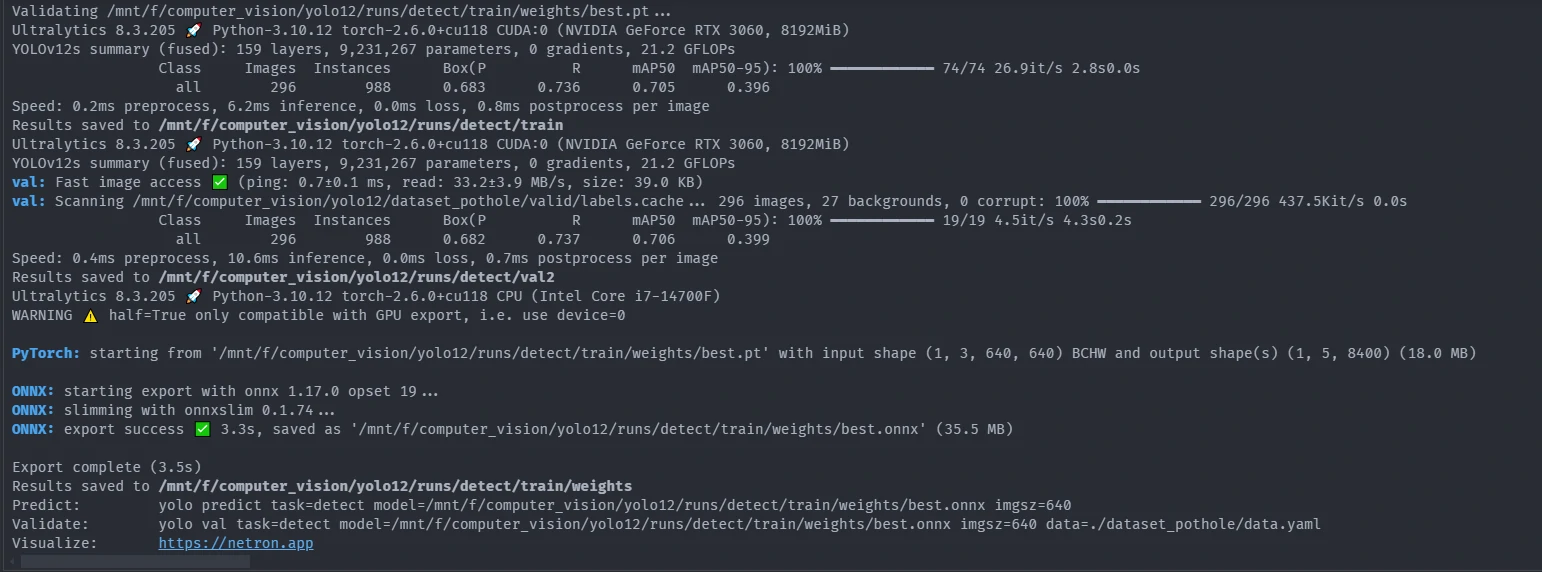
From the image above, we can get final validation value for each class, matrics Box(PR mAP50 mAP50-95), preprocess time, inference time, postprocess per image time and where it store the data.
Save The Model
From the image above, we can store our model using onnx library.
Training Results and Performance Analysis
Once the YOLOv12 model is fine-tuned on the pothole detection dataset, several useful artifacts are generated, including loss curves and a confusion matrix. We also compute the mean average precision with the help of the supervision library. These help us understand how well the model has learned.
We can view F1 confidence curve, Precision-Recall (PR) Curve, Precision-Confidence Curve, Recall-Confidence Curve. 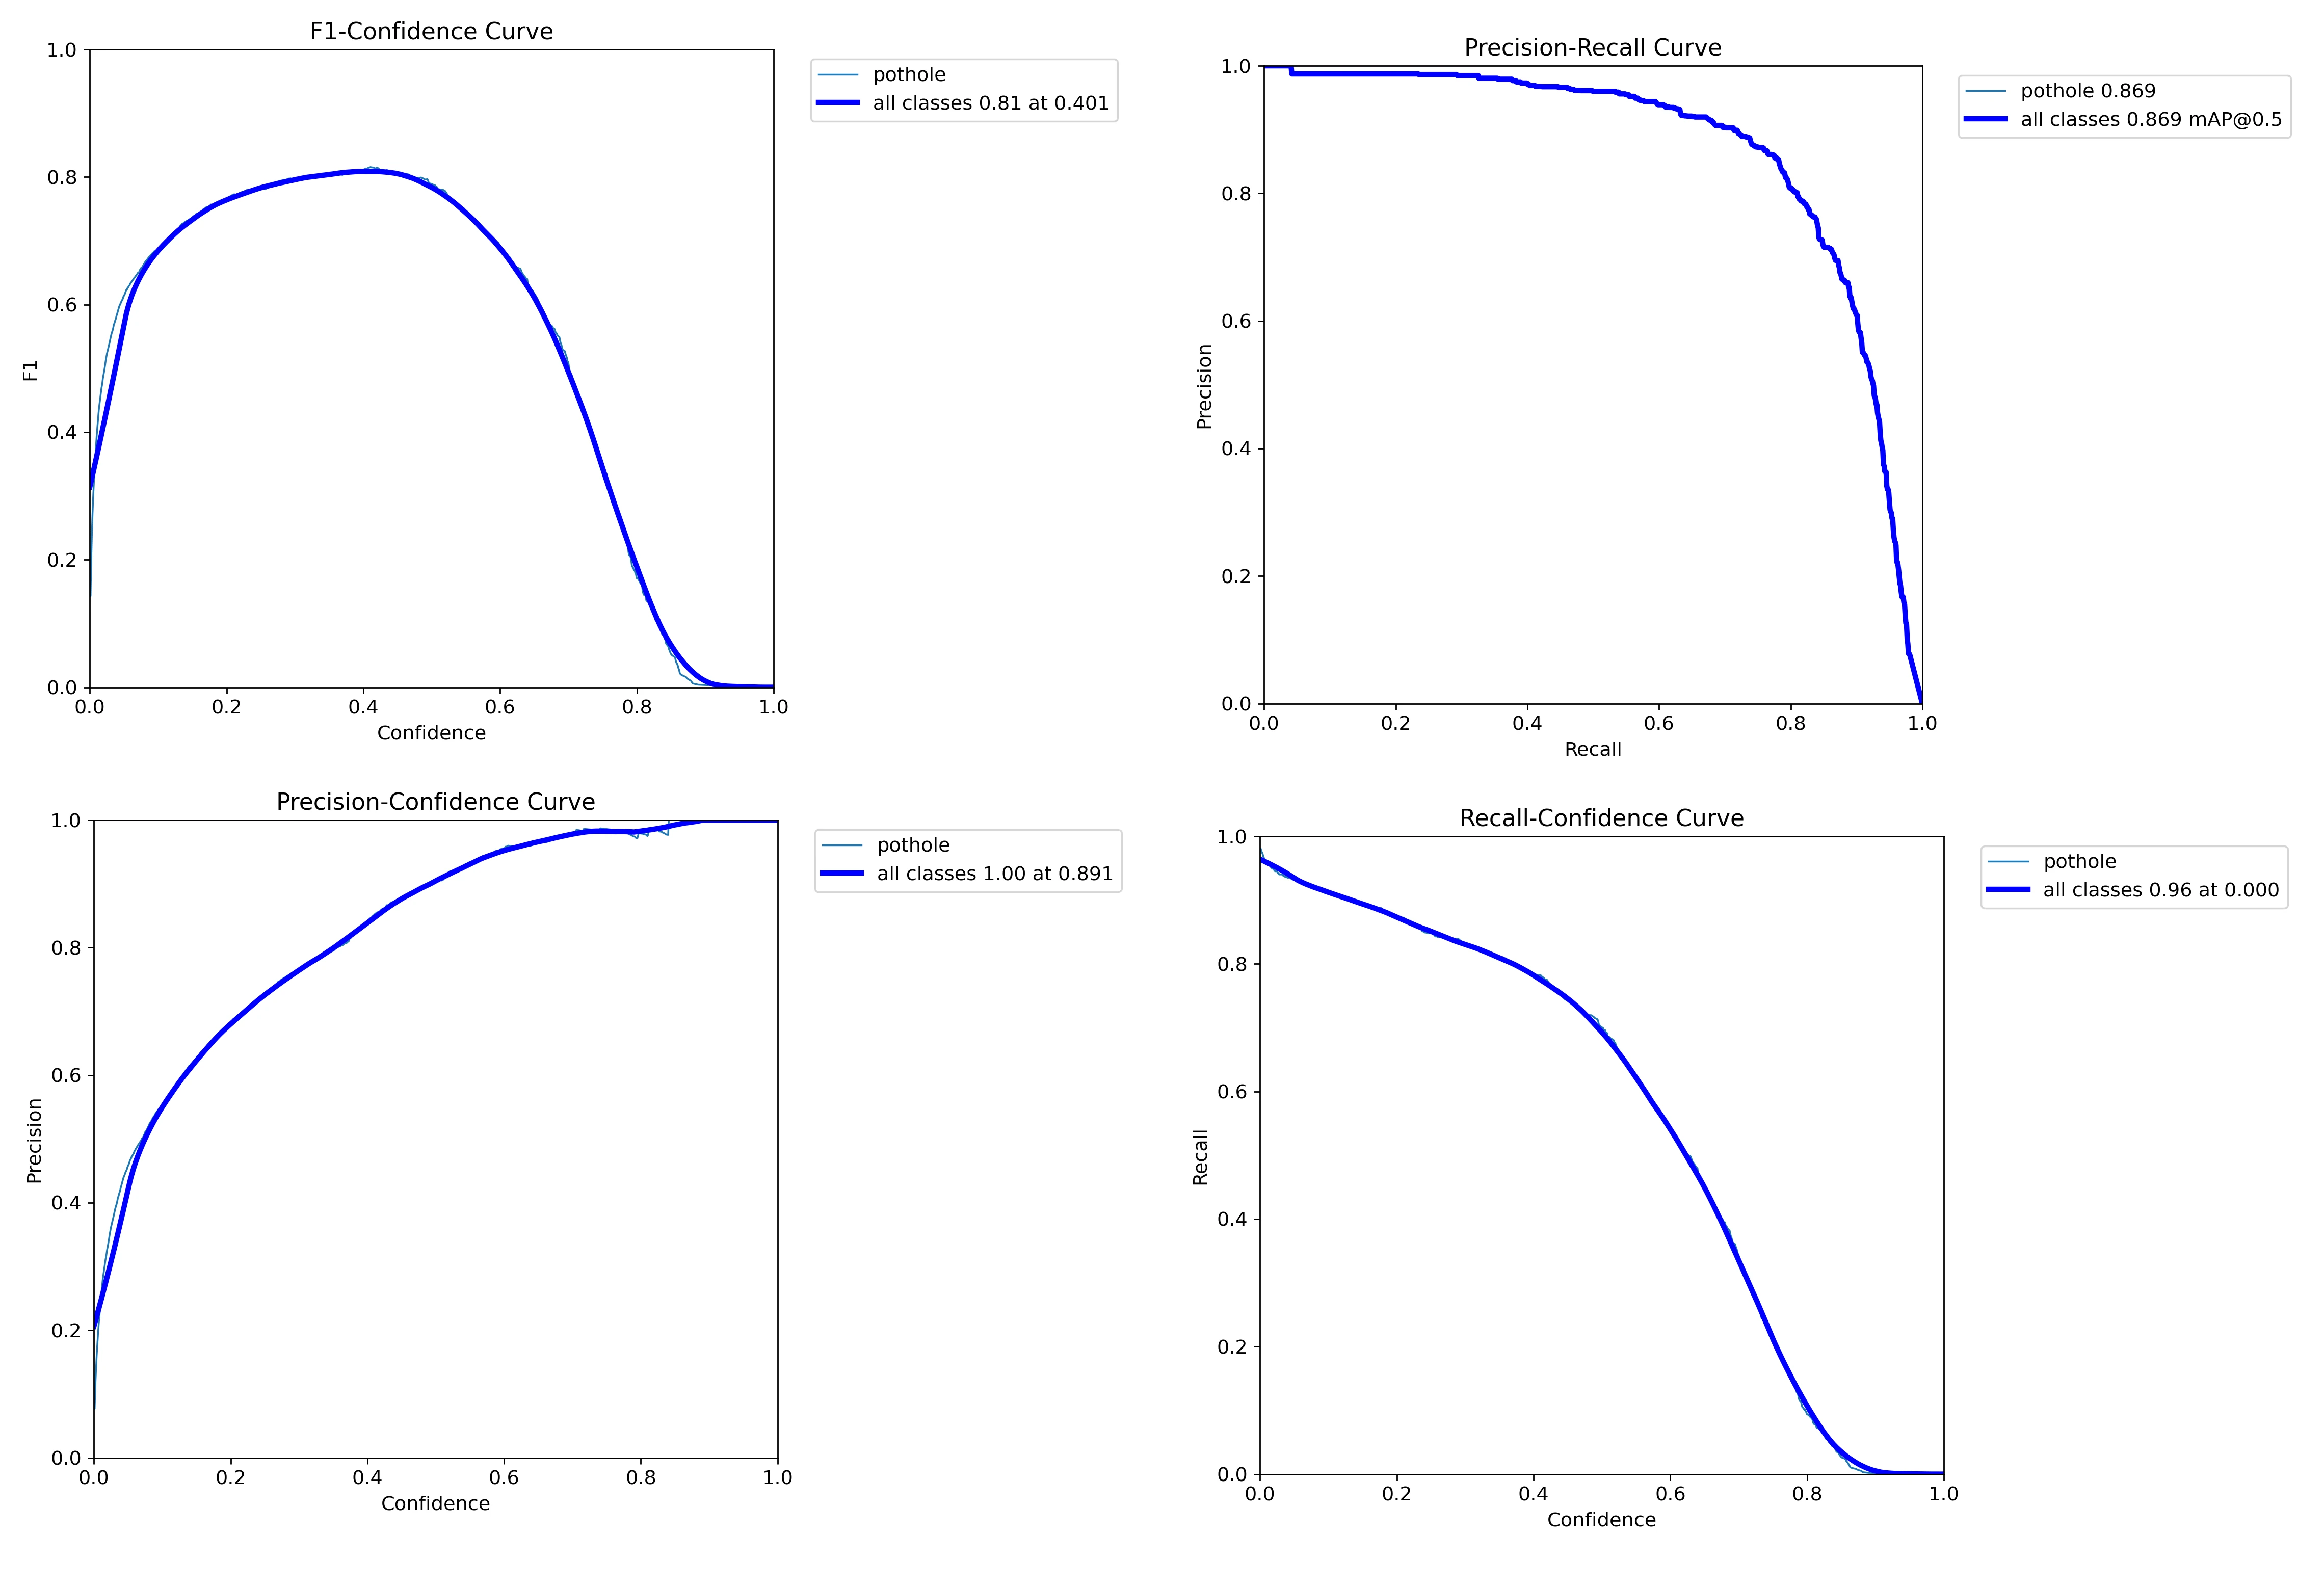
Confusion matrix
We can view your model confusion matrix at this path: /runs/detect/train/confusion_matrix.png. Here is the confusion matrix after training a model for 50 epochs on the pothole container dataset: 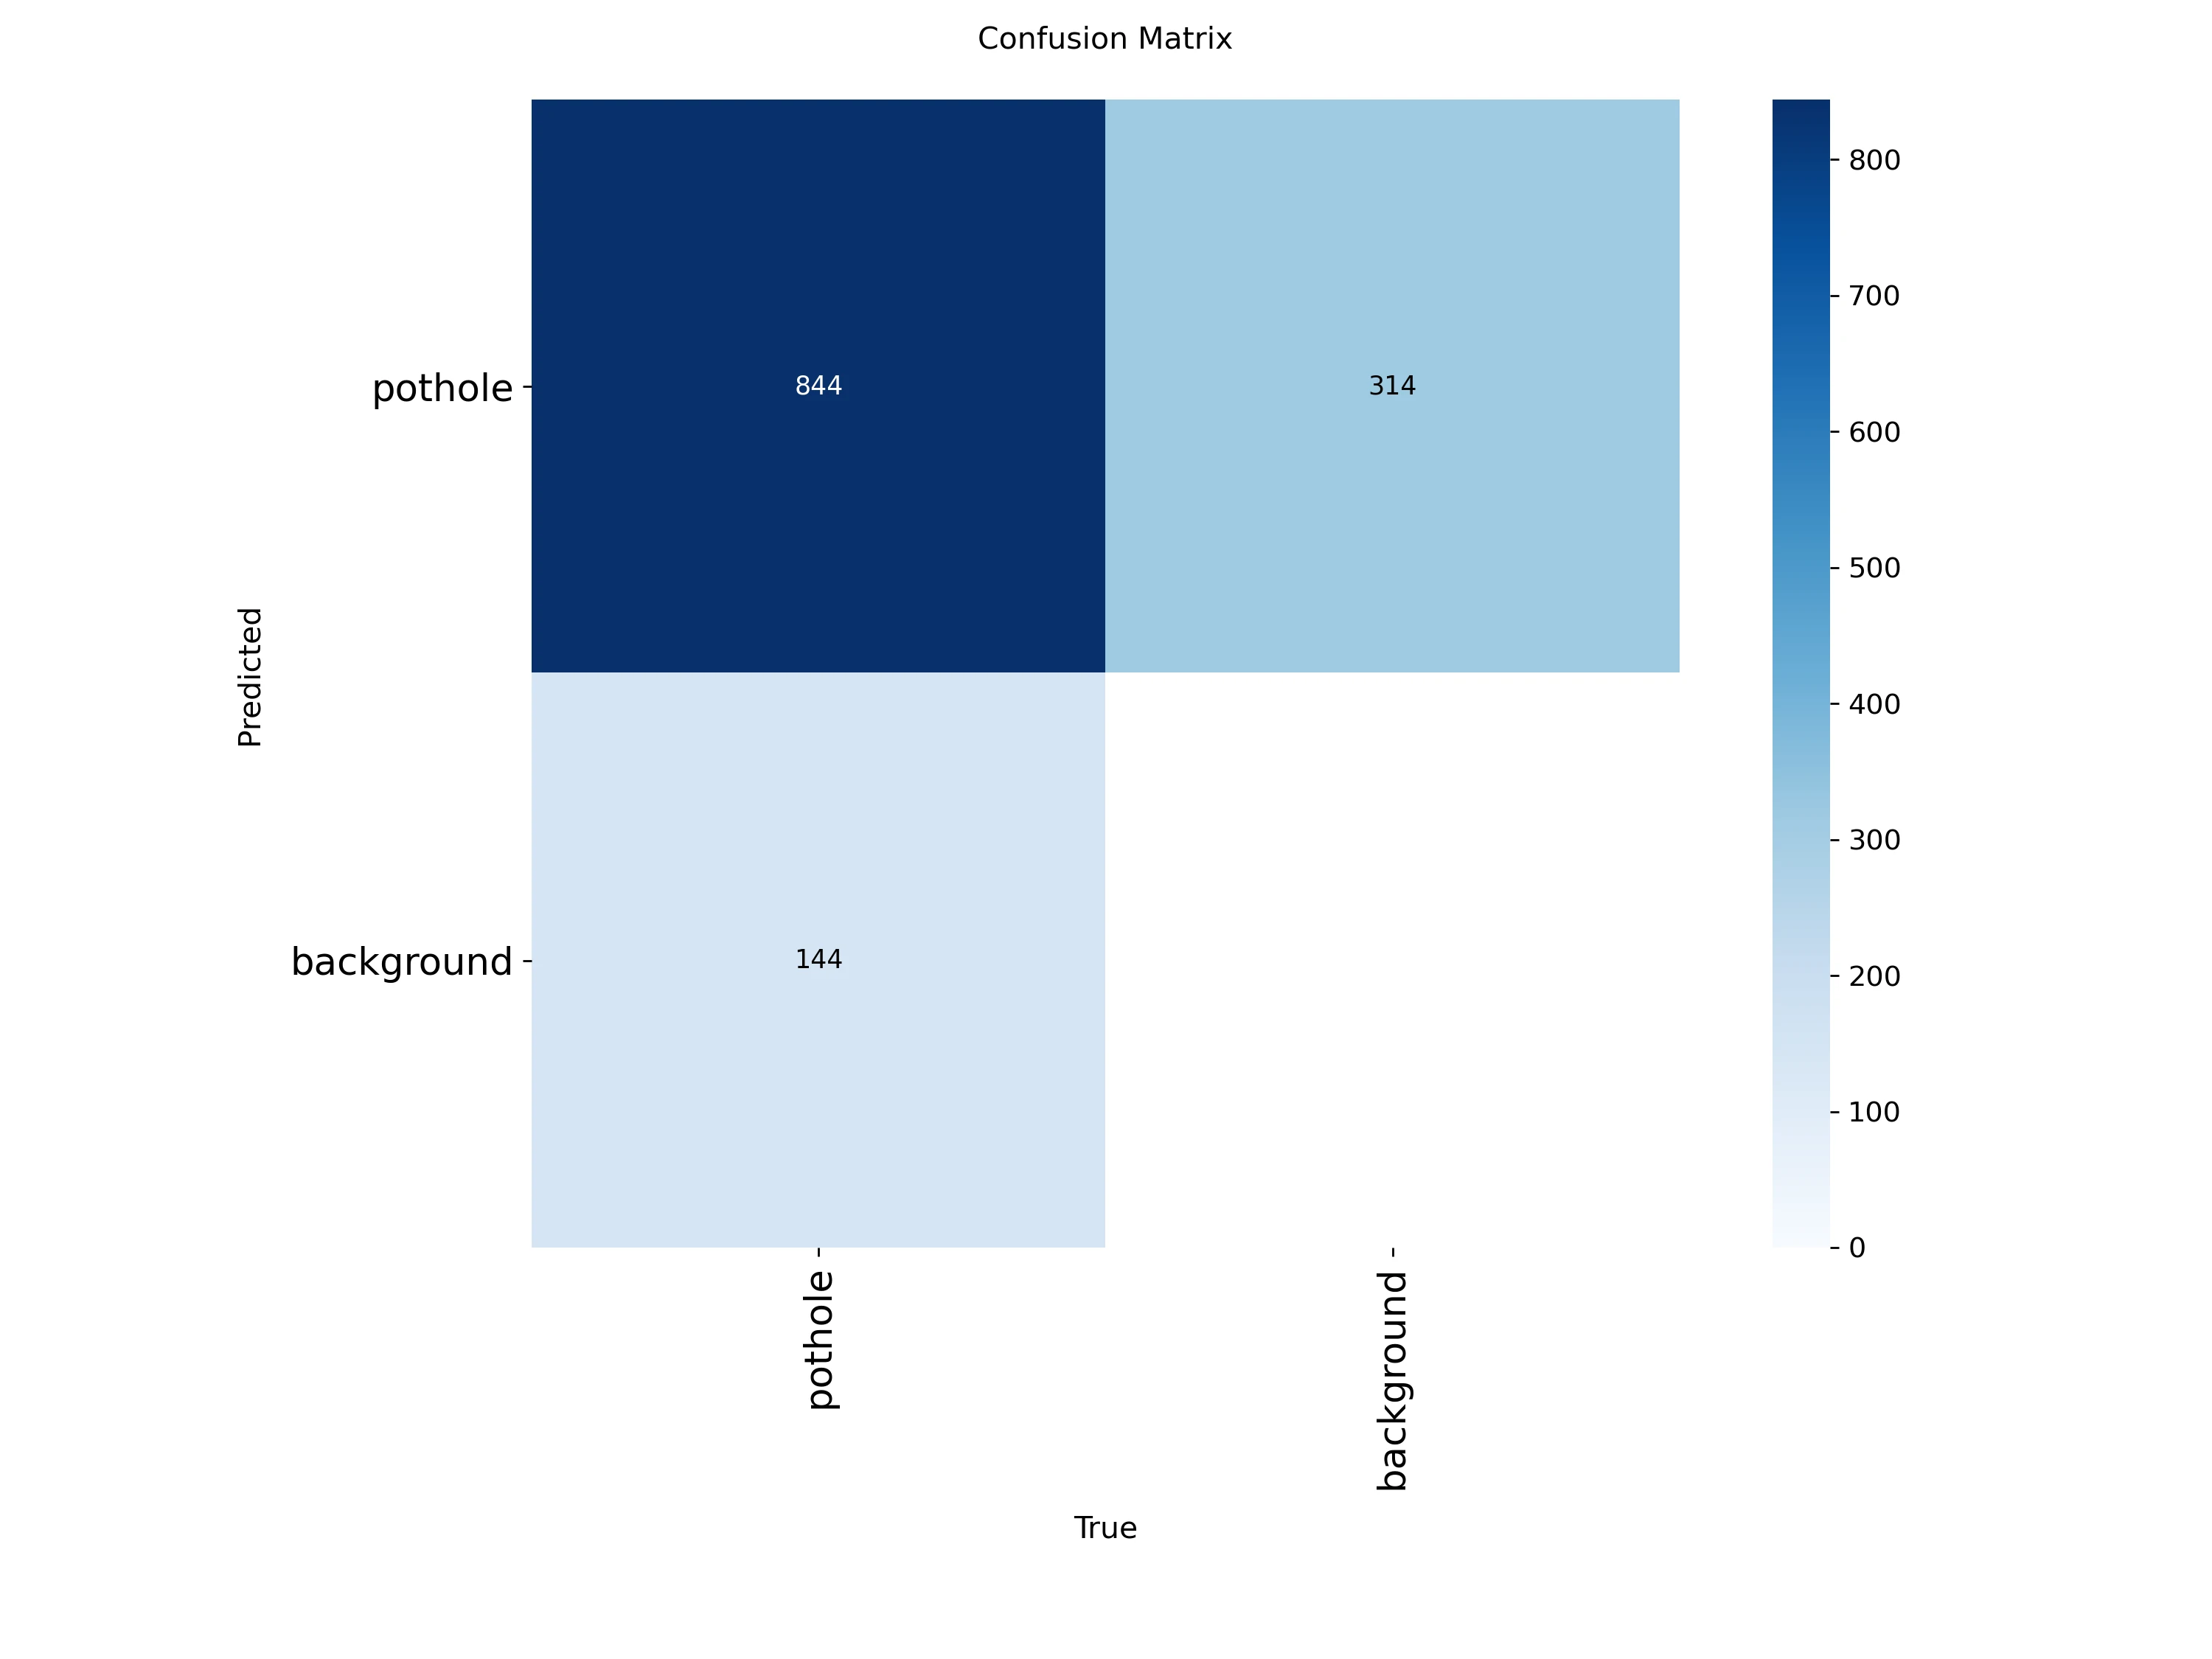
Figure above displays a binary setup (pothole vs. background):
- Top-left (844): Correctly predicted potholes (True Positives).
- Top-right (314): Background regions incorrectly labeled as potholes (False Positives).
- Bottom-left (144): Missed potholes (False Negatives).
- Bottom-right: Not meaningful here since we don’t explicitly label “background” in object detection. This value is often inferred or unused.
Loss and Metric Curves
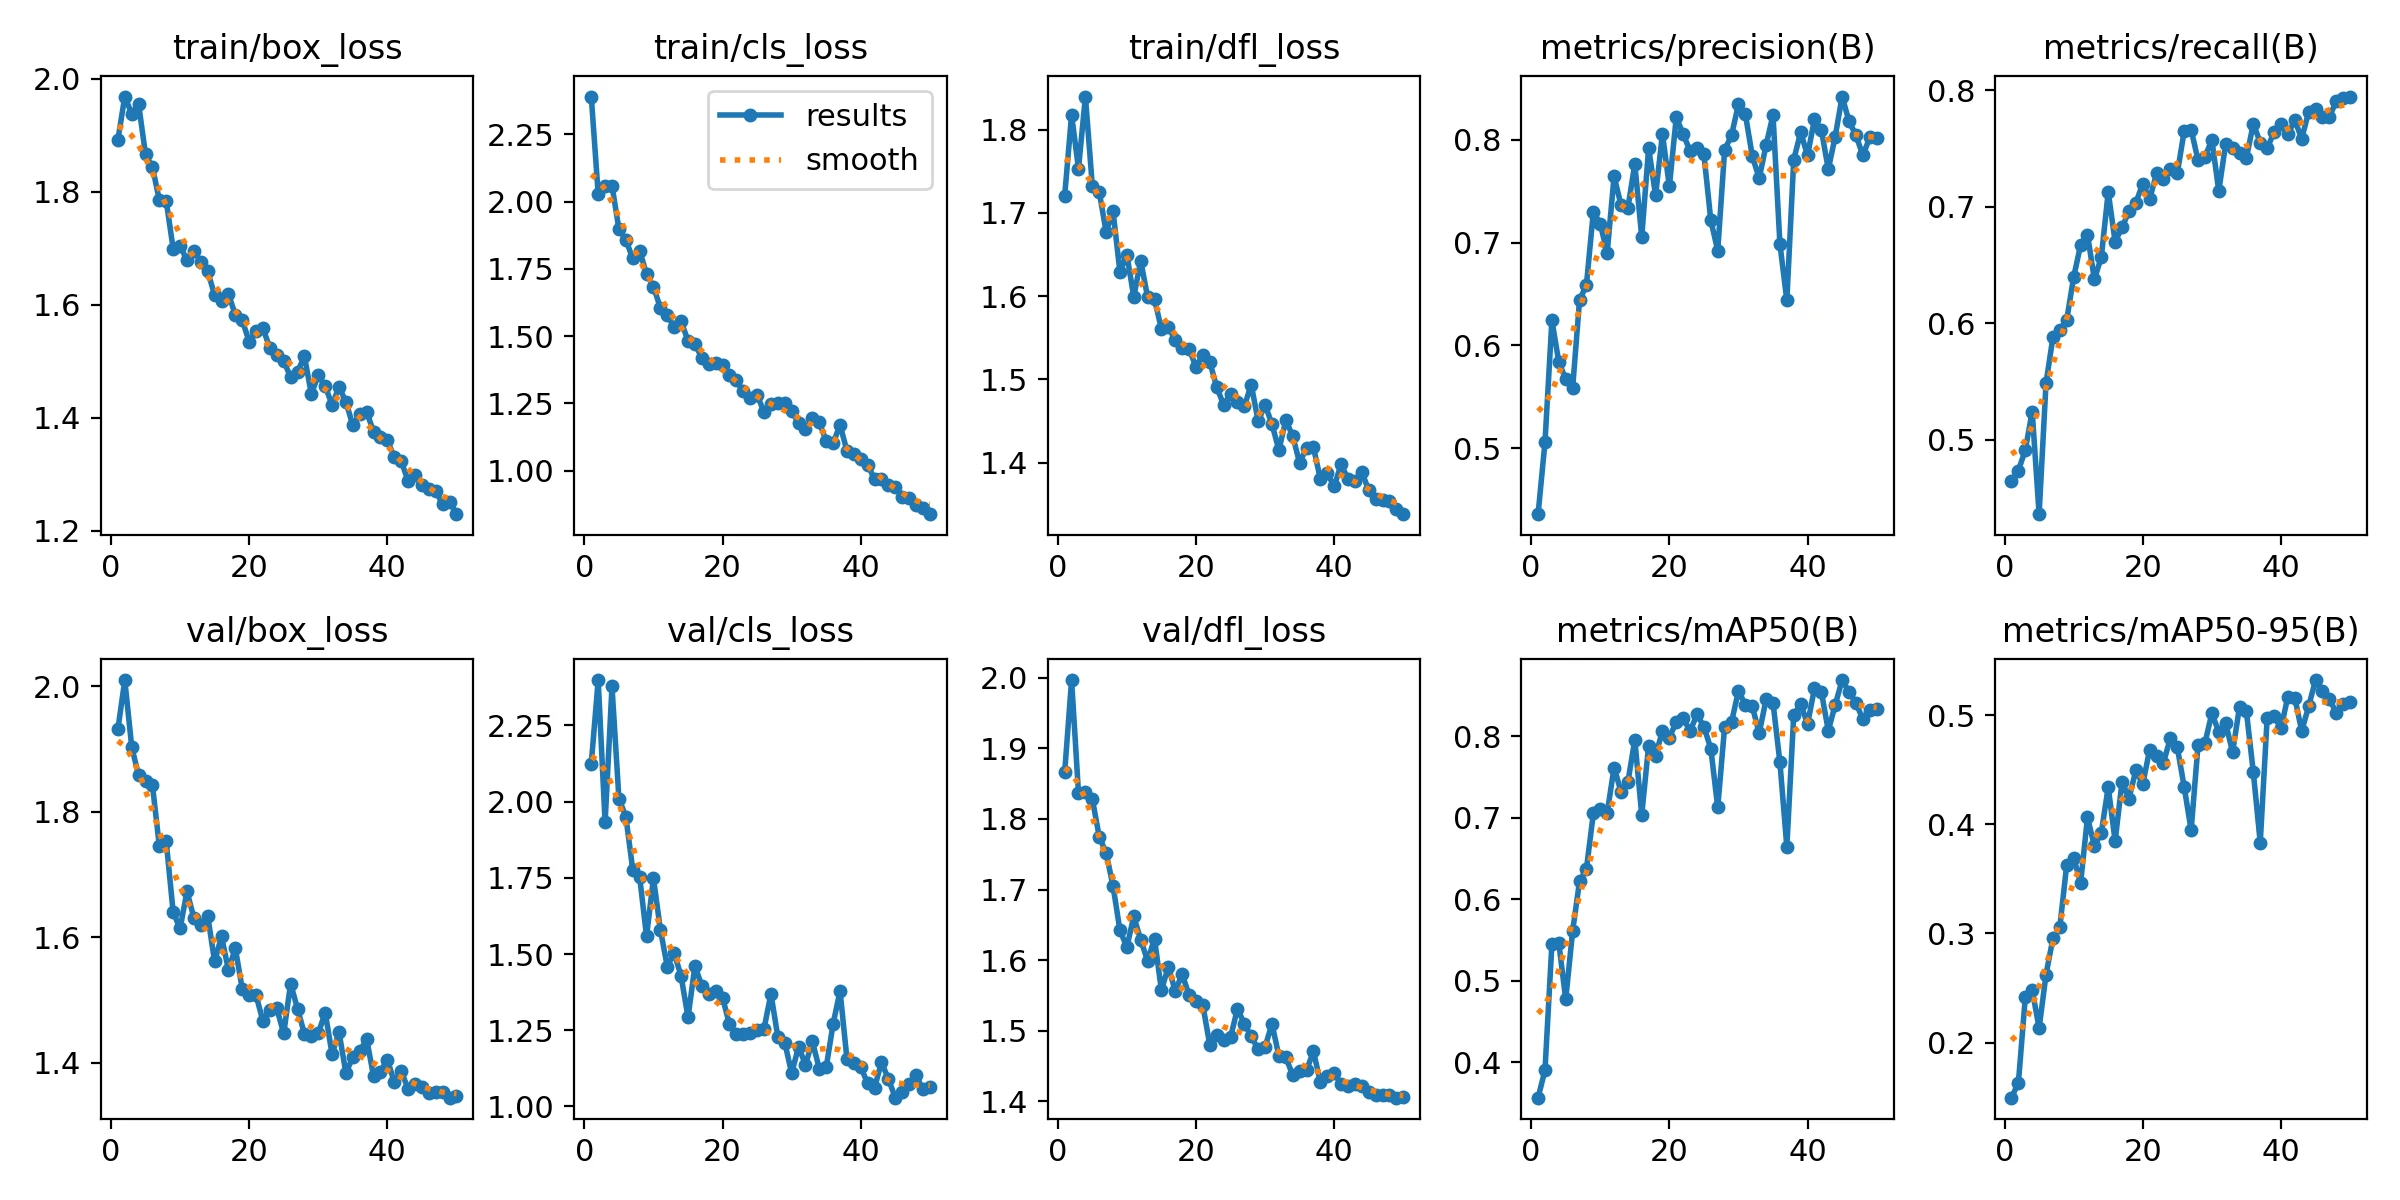
In Figure below:
- Box, Classification, and Distributed Focal Loss (DFL) losses (both training and validation) decrease steadily across 50 epochs, indicating healthy convergence.
- Precision and Recall curves consistently improve, indicating the model’s growing ability to detect potholes while minimizing false positives.
- mAP50 and mAP50-95 trends also rise, validating the improved performance across a range of Intersection over Union (IoU) thresholds.
Mean Average Precision (mAP)
By calling, cv_class.map_matric we can generate mAP by using loading the best model checkpoint of our fine-tuned YOLOv12 model, then iterate over each image and its corresponding ground-truth target in the test dataset.
cv_class.map_matric(model_path, ds)
This function requires the following parameters:
- model_path (
string): model location - ds (
string): structured dataset object (ds ) fromcv_class.dataset_info(path, data_yaml_path)
For each image, we perform inference using the model and convert the output predictions into sv.Detections format for consistency. These predictions and their corresponding targets are collected into lists. Finally, we utilize the MeanAveragePrecision class to compute evaluation metrics, which include the mAP@50, mAP@75, and mAP@50:95 scores, providing a robust quantitative measure of the model’s accuracy across various IoU thresholds.
Figure below, presents a granular view of mean Average Precision (mAP) performance across different IoU thresholds and object sizes:
- mAP@50:95: The overall average precision across IoU thresholds from 0.5 to 0.95. In our case, it’s ~ 0.50, which is quite solid given a real-world dataset.
- mAP@50: Hits 0.81 — showing that the model is confident in identifying whether a pothole exists.
- mAP@75: Slightly lower (0.57), indicating the model struggles a bit with precise localization at higher IoU thresholds.
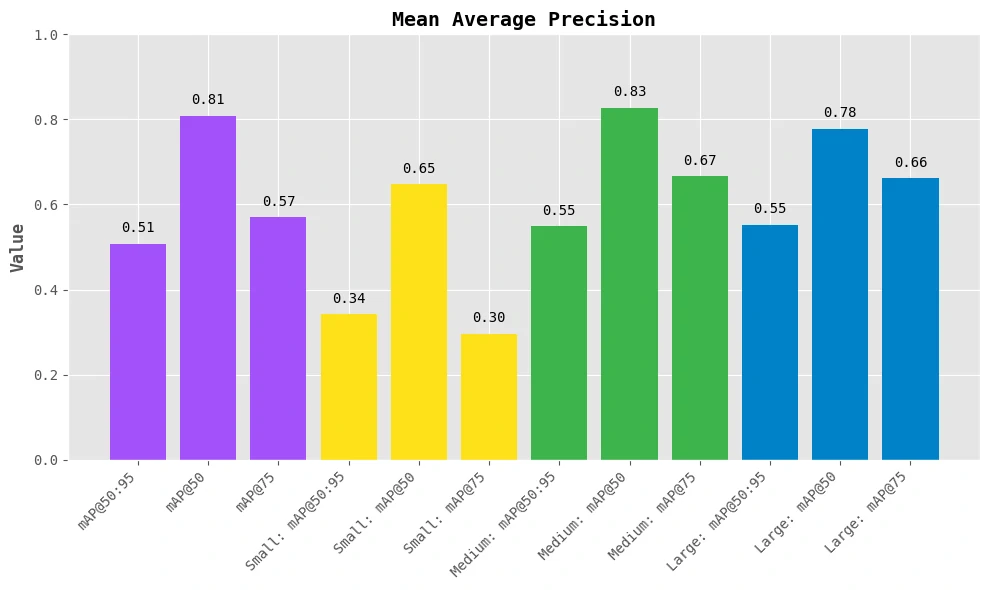
Interpretable (Size-Wise Performances)
- Small objects: mAP@50: 0.65 → decent for tiny potholes but with some drop at mAP@75: 0.30
- Medium objects: Best results! mAP@50: 0.83 and mAP@75: 0.67 → model handles average potholes very well
- Large objects: Still good: mAP@50: 0.78, mAP@75: 0.66 → slight dip likely due to fewer large examples in training
Training batch input
Validating batch input
These results suggest that YOLOv12 effectively learns both the object structure and the background in this dataset. Furthermore, this suggest that YOLOv12 learns well across all sizes but performs best on medium potholes, which are most consistent in terms of size, shape, and visibility.
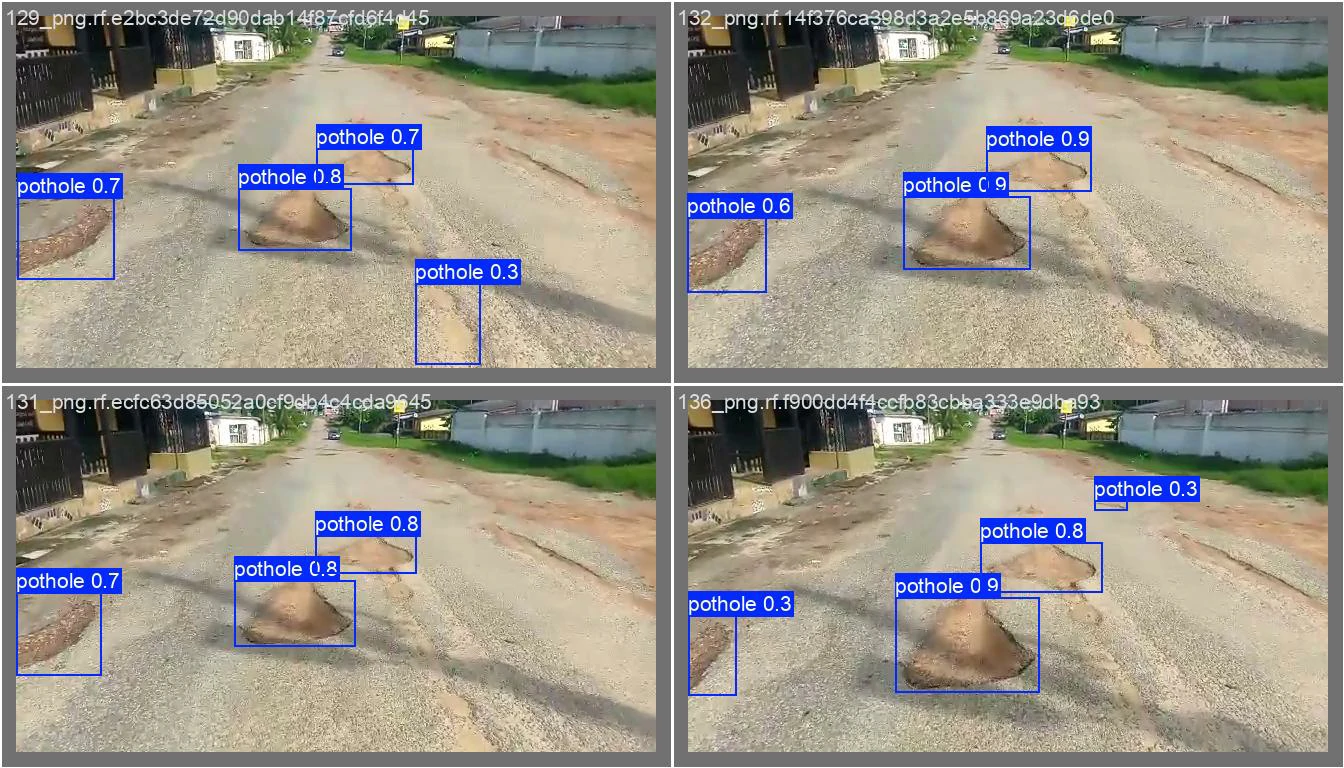
Run inference with trained model
We can run our trained model on a random image from the test set of our dataset.
By calling, cv_class.inference we can run inference from simple image, single more detail image, custom (webcam and video).
cv_class.inference(path=image_path, model_path=model_path, types='simple',tresh=0.25, thickness=2)
This function requires the following parameters:
- image_path (
string): image location- use
0for webcam input
- use
- model_path (
string): model location - class_path (
string): class info in txt file - types (
string): inference type that we want to usesimple: simple imagesingle_image: single but more detail image and informationcustom: for video and webcam
- tresh (
float): Confidence Threshold - thickness (
float): Line Thickness on Bounding Boxes
Simple image
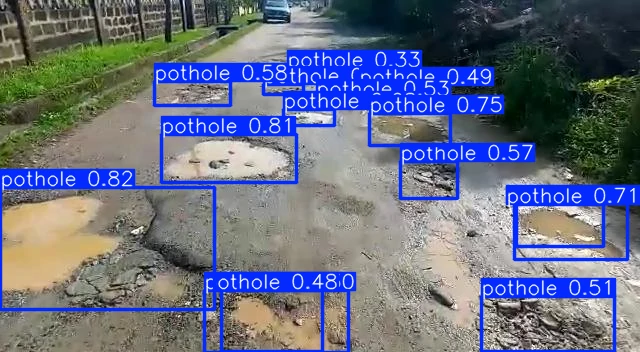
    image 1/1 /mnt/f/computer_vision/yolo12/dataset_pothole/image.jpg: 352x640 15 potholes, 56.3ms
    Speed: 0.9ms preprocess, 56.3ms inference, 1.3ms postprocess per image at shape (1, 3, 352, 640)
Single more detail image
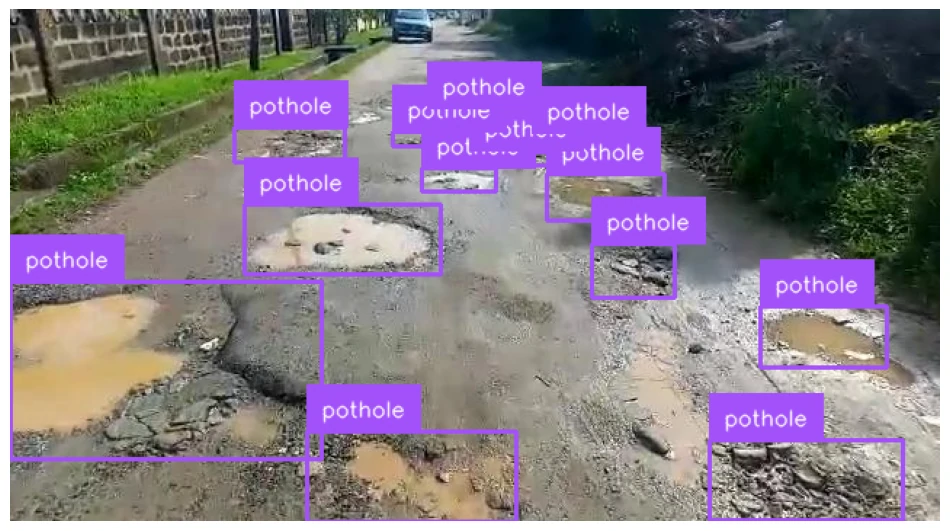
    0: 352x640 15 potholes, 8.6ms
    Speed: 0.7ms preprocess, 8.6ms inference, 1.0ms postprocess per image at shape (1, 3, 352, 640)
Track objects
Leverage Supervision’s advanced capabilities for enhancing your video analysis by seamlessly tracking objects recognized by a multitude of object detection and segmentation models.
By using YOLO12 and calling, cv_class.tracking we can run inference on video and make tracking for it.
cv_class.tracking(model_path, source_path, target_path)
This function requires the following parameters:
- source_path (
string): video location- use
0for webcam input
- use
- model_path (
string): model location - target_path (
string): output video that has tracking object labels.
Result
Reference
- https://github.com/sunsmarterjie/yolov12/
- https://blog.roboflow.com/train-yolov12-model/
- https://supervision.roboflow.com/how_to/track_objects/