Simple Map plot using Shapefile
Dataset
Load dataset
First, we load a dataset containing the store location in San Francisco. For this project, we just want to combine all polygon data, so we used dissolve function to combine it into single polygon.
study_area = gpd.read_file(r"..\map\map_service_area\ServiceAreas_4.shp").dissolve()
| name | latitude | longitude | ran | |
|---|---|---|---|---|
| 0 | Battery Park City | 40.7122 | -74.0161 | 12 |
| 1 | Bowery | 40.7253 | -73.9903 | 3 |
| 2 | Chinatown | 40.7158 | -73.997 | 10 |
| 3 | Civic Center | 40.7141 | -74.0028 | 13 |
| 4 | East Village | 40.7265 | -73.9815 | 6 |
The Code
By calling maps.generate_point_in_poly, we can plot the locations in New York based on their coordinates and use the shapefile to add map features.
result = maps.generate_point_in_poly(number=50, polygon=study_area, plot=True)
This function requires the following parameters:
- number (
int): number of point - polygon (
geodataframe): Data location and value - plot (
Boolean): generate map plot
The result
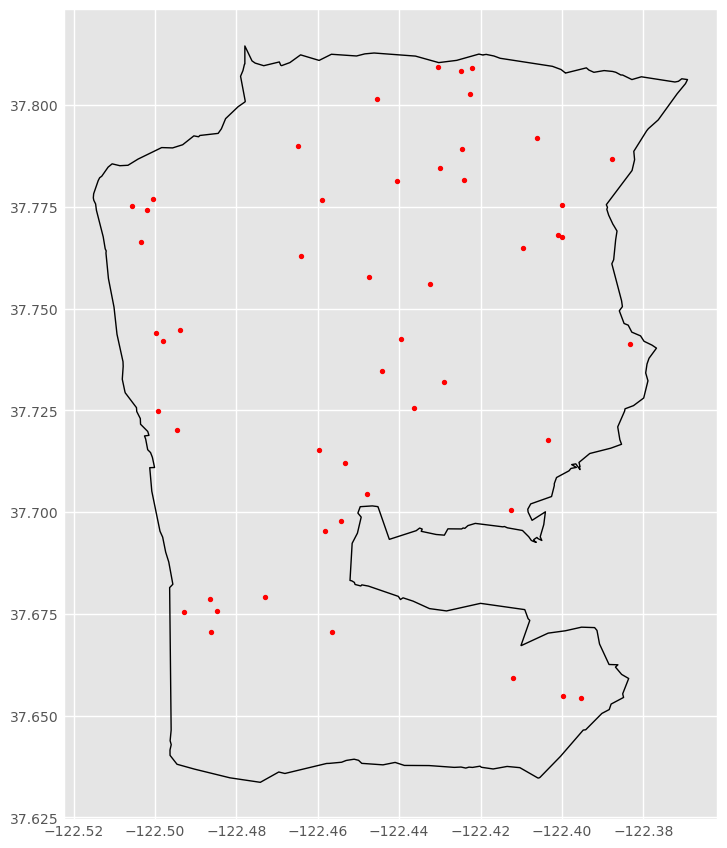
| geometry | longitude | latitude | color_id | |
|---|---|---|---|---|
| 0 | POINT (-122.39972868320467 37.6549101038248) | -122.4 | 37.6549 | #DD24CA |
| 1 | POINT (-122.42893183957628 37.731905695938906) | -122.429 | 37.7319 | #13169C |
| 2 | POINT (-122.43047326165174 37.80931007882086) | -122.43 | 37.8093 | #D17AA8 |
| 3 | POINT (-122.49456426917857 37.72010485096661) | -122.495 | 37.7201 | #4D5D77 |
| 4 | POINT (-122.43233852473985 37.75616139708076) | -122.432 | 37.7562 | #6E66A7 |