Simple Map plot using Shapefile
Dataset
Load dataset
First, we load a dataset containing the names of locations in New York, their coordinates, and a random number assigned to each row as a value.
df = pd.read_csv(r'..\map\nyc\coded_locs.csv',names=['name','latitude','longitude'])

df['ran'] = np.random.randint(1, 17, df.shape[0])
| name | latitude | longitude | ran | |
|---|---|---|---|---|
| 0 | Battery Park City | 40.7122 | -74.0161 | 12 |
| 1 | Bowery | 40.7253 | -73.9903 | 3 |
| 2 | Chinatown | 40.7158 | -73.997 | 10 |
| 3 | Civic Center | 40.7141 | -74.0028 | 13 |
| 4 | East Village | 40.7265 | -73.9815 | 6 |
load shape file
Next, we load or provide the path to the shapefile.
shape = r'..\map\nyc\geo_export_82ac2965-ee41-4025-a13c-a89394b58021.shp'
The Code
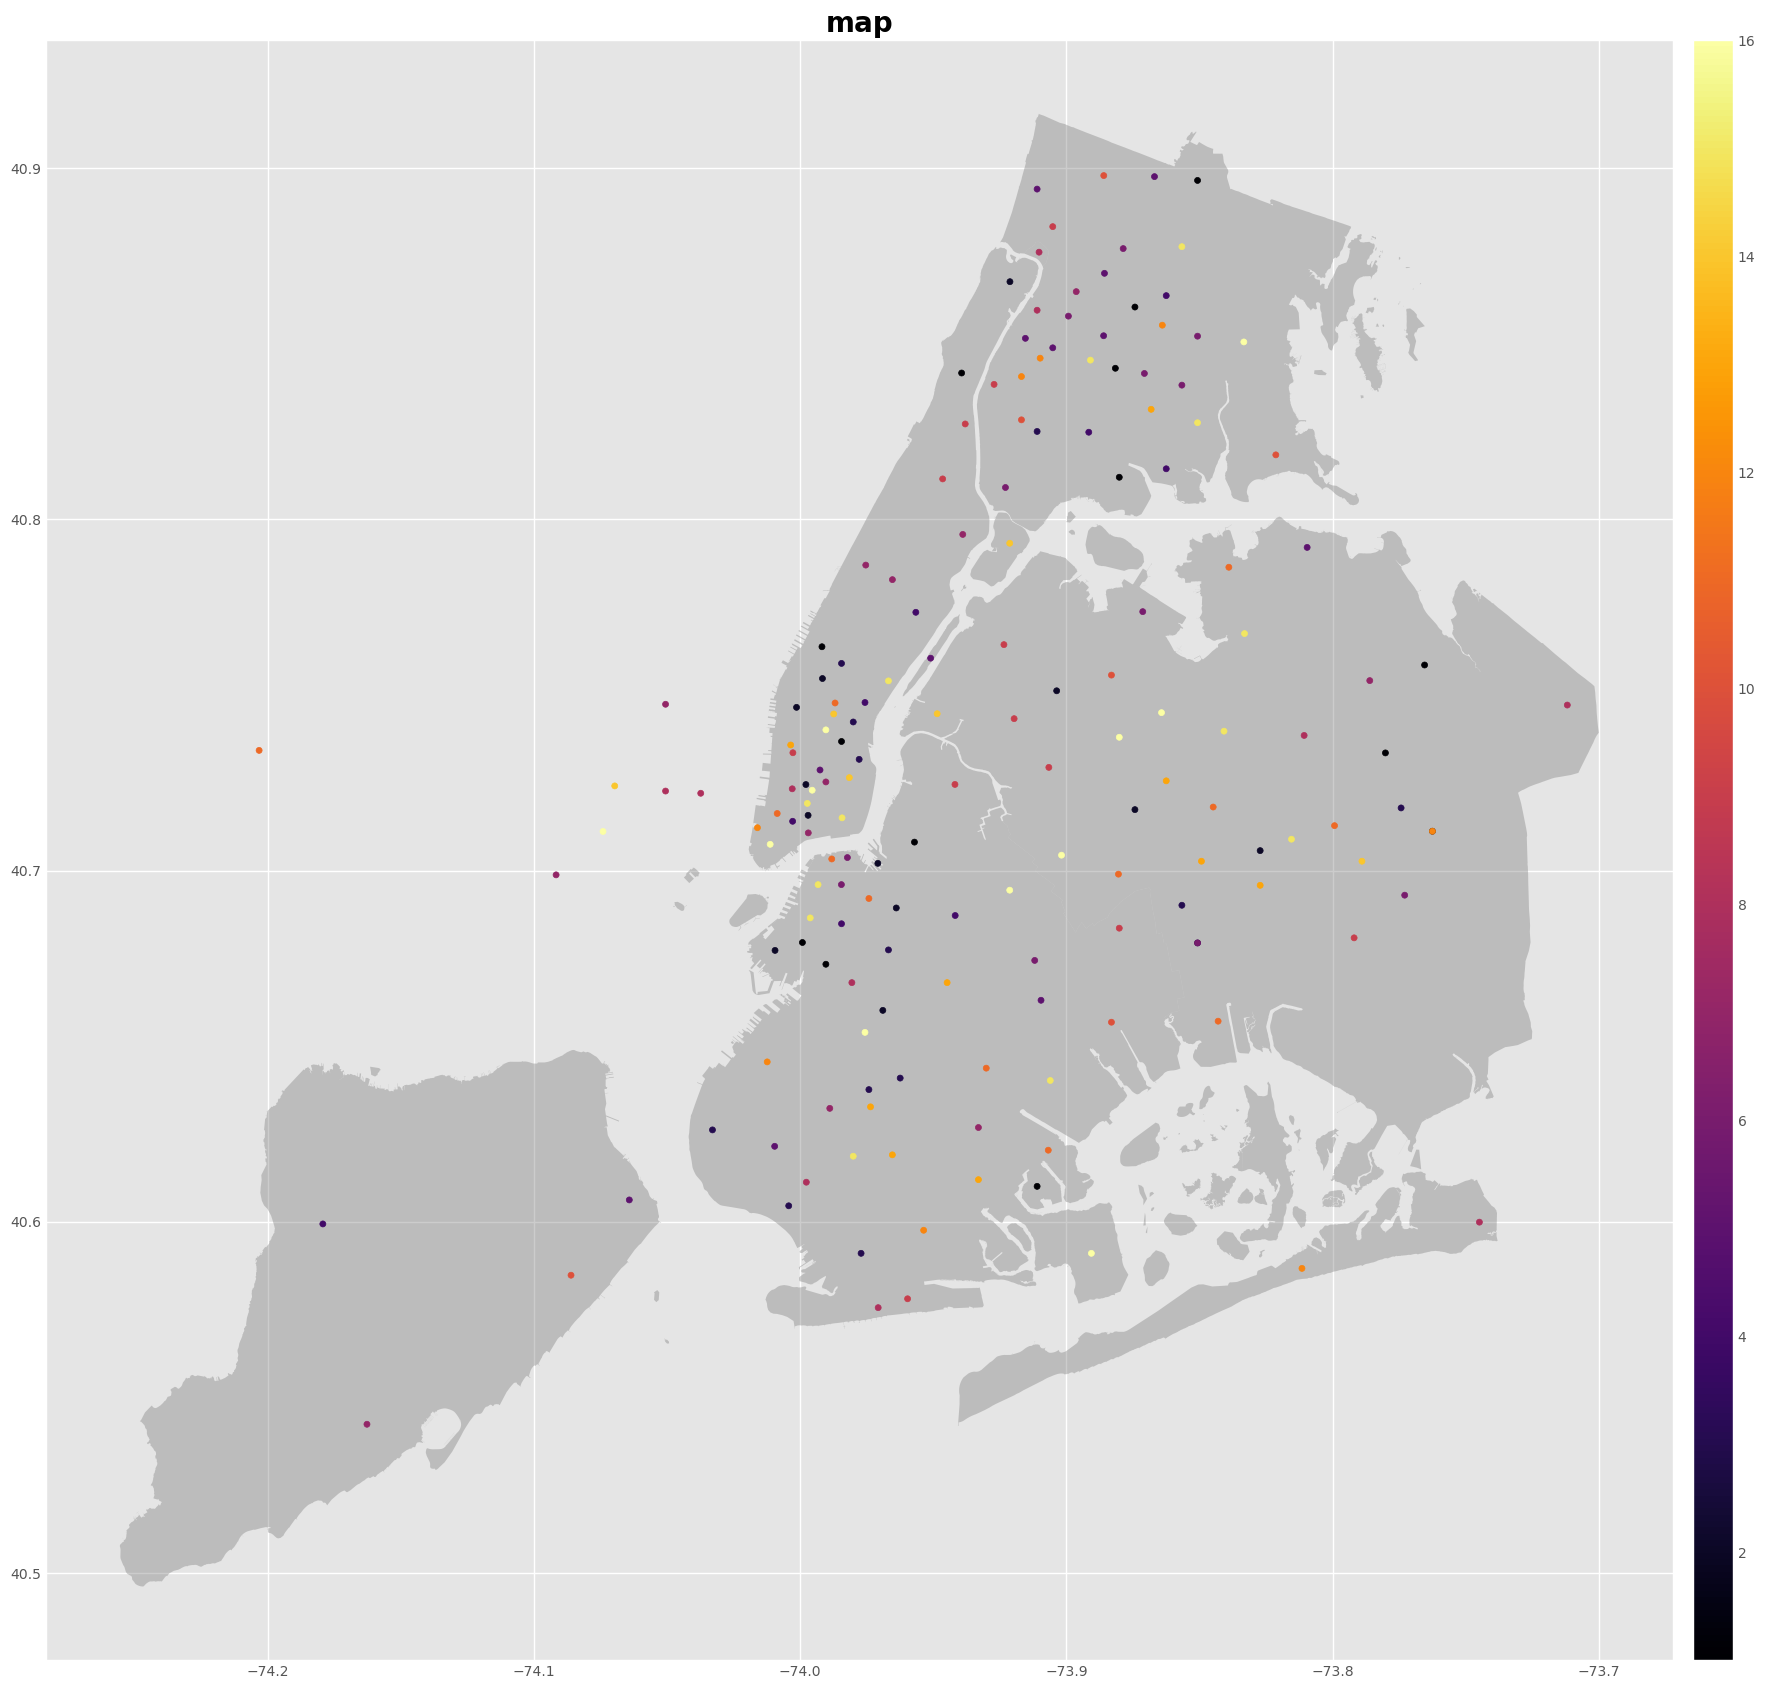
By calling maps.map_shape, we can plot the locations in New York based on their coordinates and use the shapefile to add map features.
maps.map_shape(df,shape,'ran',col_loc=['longitude','latitude'],title='map')
This function requires the following parameters:
- main_data (
dataframe): Data location and value - shape (
string): Shapefile - col_val (
string): Column name of targeted value - col_loc (
list): Two column names of location['longitude', 'latitude'] - title (
string): Title - footnote (
string): Footnote
The result