Exploring Nearby Places with Spatial Data: Fetching Points of Interest
scraping data
geospatial
Introduction
When you're looking for places around you—whether it's coffee shops, ATMs, parks, or gas stations—you’re essentially looking for Points of Interest (POIs). These are specific locations that serve a purpose for people, like businesses, landmarks, or public facilities. One of the best ways to fetch and analyze POIs is by using OpenStreetMap (OSM), a rich, community-driven map database.
How It Works: Filtering POIs with Spatial Queries
Instead of fetching all available data (which can be overwhelming), we can refine our request by filtering POIs based on categories that matter to us. For example, if you’re building a travel app that suggests must-visit spots, you can pull only restaurants, museums, and parks. If you’re working on a logistics tool, you might focus on warehouses, loading docks, and transport hubs.
The process typically involves:
- Defining the area – We specify a boundary (like a city, neighborhood, or radius from a point).
- Filtering by category – We request only certain types of POIs (e.g., hotels, hospitals, supermarkets).
- Fetching and processing the data – Using tools like Overpass API or other OSM-based services, we retrieve relevant POIs and integrate them into our application.
To do this kind of feature engineering, let us first walk through what we need to do at a conceptual level:
- Decide what is nearby. This will dictate how far we go from each point when counting the number of “nearby” bars & restaurants. For this example, we will use 500 meter buffer, which is approximately the distance of a leisurely ten-minute walk.
- For each point, determine whether POIs are within a leisurely ten-minute walk.
- Count how many POIs are within the specified radius of each point.
Dataset
Load dataset
We’ll be working with the AirBNB dataset, which includes various details about AirBNB in San Diego.
airbnbs = gpd.read_file(r"..\map\regression_db.geojson")
| accommodates | bathrooms | bedrooms | beds | neighborhood | pool | d2balboa | coastal | price | log_price | id | pg_Apartment | pg_Condominium | pg_House | pg_Other | pg_Townhouse | rt_Entire_home/apt | rt_Private_room | rt_Shared_room | geometry | |
|---|---|---|---|---|---|---|---|---|---|---|---|---|---|---|---|---|---|---|---|---|
| 0 | 5 | 2 | 2 | 2 | North Hills | 0 | 2.97208 | 0 | 425 | 6.05209 | 6 | 0 | 0 | 1 | 0 | 0 | 1 | 0 | 0 | POINT (-117.12970521881205 32.75399315770343) |
| 1 | 6 | 1 | 2 | 4 | Mission Bay | 0 | 11.5014 | 1 | 205 | 5.32301 | 5570 | 0 | 1 | 0 | 0 | 0 | 1 | 0 | 0 | POINT (-117.25253316779435 32.784211617029264) |
| 2 | 2 | 1 | 1 | 1 | North Hills | 0 | 2.49389 | 0 | 99 | 4.59512 | 9553 | 1 | 0 | 0 | 0 | 0 | 0 | 1 | 0 | POINT (-117.1412083878189 32.753266324386914) |
| 3 | 2 | 1 | 1 | 1 | Mira Mesa | 0 | 22.2938 | 0 | 72 | 4.27667 | 14668 | 0 | 0 | 1 | 0 | 0 | 0 | 1 | 0 | POINT (-117.1526853433049 32.93110404721571) |
| 4 | 2 | 1 | 1 | 1 | Roseville | 0 | 6.82945 | 0 | 55 | 4.00733 | 38245 | 0 | 0 | 1 | 0 | 0 | 0 | 1 | 0 | POINT (-117.21870072593777 32.74201976865927) |
The Code
By calling maps.geo_to_hexagon, we can convert geometry from specific dataset into a hexagonal grid.
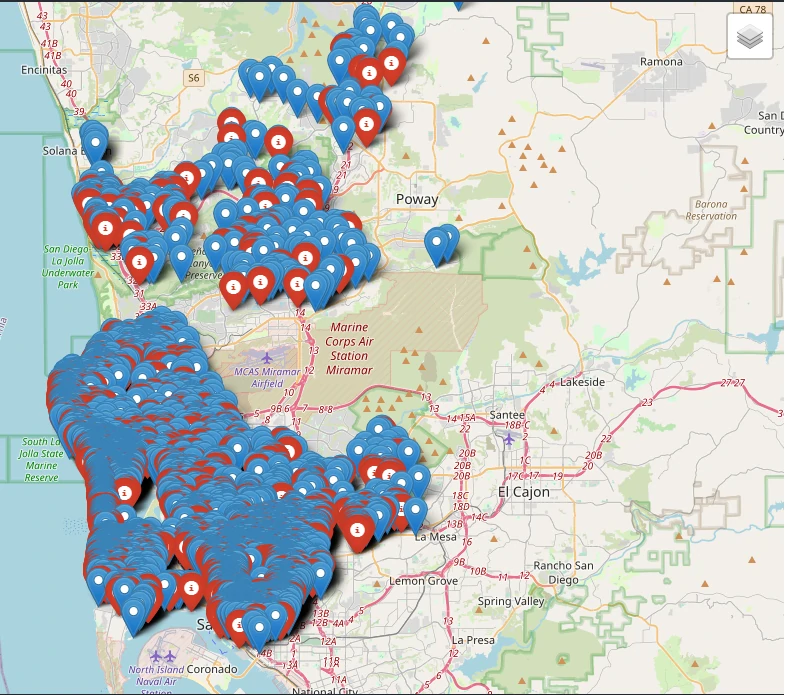
main_data_w_counts,pois,joined,laMap = maps.nearby_feat_spatial(airbnbs, col_list=['id'],
                        source_type='osm', features=["restaurant", "bar"],
                        plots_show=True, radius_m=500, figsize=[15,15],plots_folium = True)
This function requires the following parameters:
- main_data (
geodataframe): point source data - col_list (
string): col name id - source_type (
string): source measurement. Defaults to ‘osm’. - features (
list): tag from source. Defaults to []. - plots_show (
Boolean): generate map plot. Defaults to False. - radius_m (
int): Buffer radius from point source. Defaults to 500. - figsize (
list): figure size for map plot. Defaults to [6,6]. - plots_folium (
Boolean): generate map plot with folium. Defaults to False.
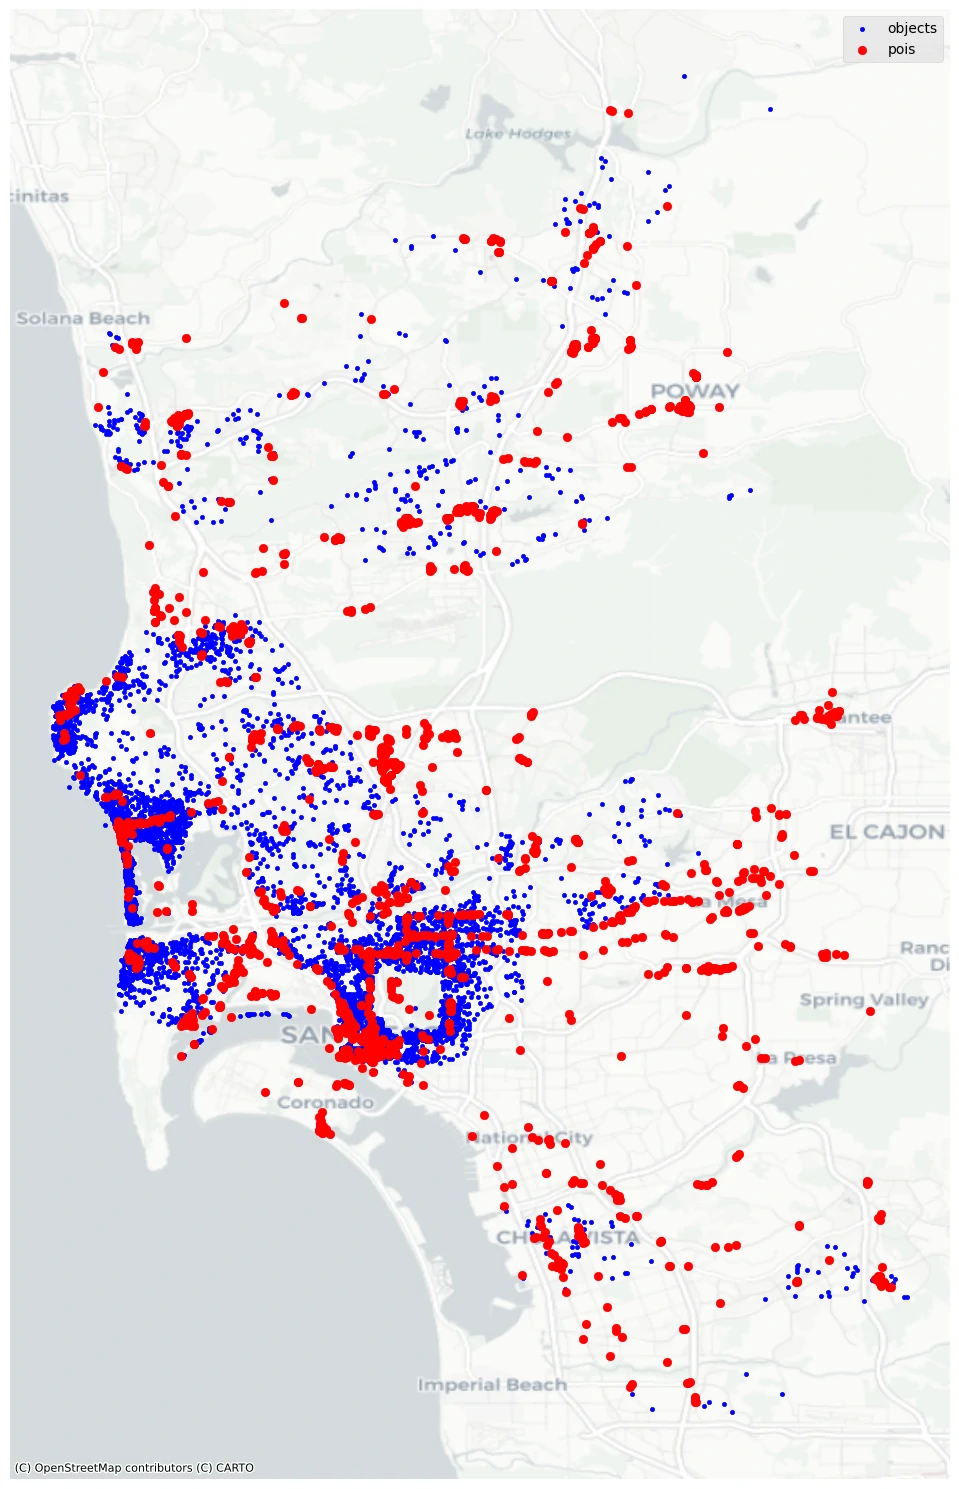
The result
| amenity | total |
|---|---|
| bar | 339 |
| restaurant | 1505 |
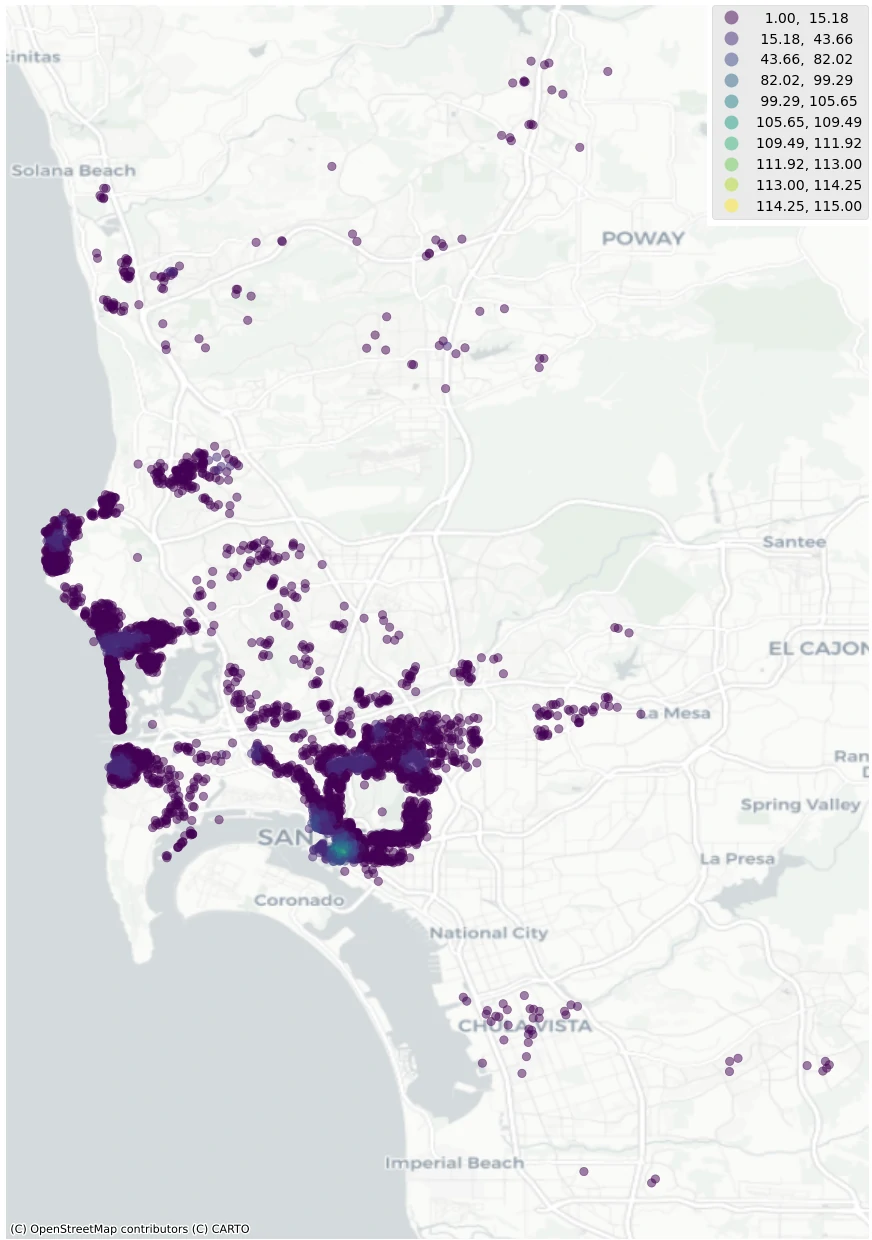
data point
| accommodates | bathrooms | bedrooms | beds | neighborhood | pool | d2balboa | coastal | price | log_price | id | pg_Apartment | pg_Condominium | pg_House | pg_Other | pg_Townhouse | rt_Entire_home/apt | rt_Private_room | rt_Shared_room | geometry | buffer_500m | poi_count | |
|---|---|---|---|---|---|---|---|---|---|---|---|---|---|---|---|---|---|---|---|---|---|---|
| 0 | 5 | 2 | 2 | 2 | North Hills | 0 | 2.97208 | 0 | 425 | 6.05209 | 6 | 0 | 0 | 1 | 0 | 0 | 1 | 0 | 0 | POINT (-117.129705218814 32.75399315770497) | POLYGON ((269812.639421743 -580195.743780701, 269810.2317850791 -580244.7523508657, | 14 |
| 1 | 6 | 1 | 2 | 4 | Mission Bay | 0 | 11.5014 | 1 | 205 | 5.32301 | 5570 | 0 | 1 | 0 | 0 | 0 | 1 | 0 | 0 | POINT (-117.2525331677963 32.784211617030756) | POLYGON ((258194.37551237055 -577191.9218819323, 258191.96787570664 -577240.9304520971, | 7 |
| 2 | 2 | 1 | 1 | 1 | North Hills | 0 | 2.49389 | 0 | 99 | 4.59512 | 9553 | 1 | 0 | 0 | 0 | 0 | 0 | 1 | 0 | POINT (-117.14120838782084 32.75326632438842) | POLYGON ((268736.0848482558 -580308.8118752316, 268733.6772115919 -580357.8204453964, | 13 |
| 4 | 2 | 1 | 1 | 1 | Roseville | 0 | 6.82945 | 0 | 55 | 4.00733 | 38245 | 0 | 0 | 1 | 0 | 0 | 0 | 1 | 0 | POINT (-117.21870072593971 32.74201976866074) | POLYGON ((261503.77557854165 -581770.0571856308, 261501.36794187775 -581819.0657557956, | 1 |
| 12 | 6 | 2.5 | 3 | 4 | Mission Bay | 0 | 11.7835 | 1 | 250 | 5.52146 | 69385 | 0 | 0 | 1 | 0 | 0 | 1 | 0 | 0 | POINT (-117.25439875416923 32.78652495716805) | POLYGON ((258012.02689323173 -576940.8920077793, 258009.61925656782 -576989.9005779441, | 9 |
joined data
| element_type | osmid | amenity | cuisine | name | geometry | index_right | id | |
|---|---|---|---|---|---|---|---|---|
| 0 | node | 273607070 | restaurant | italian | Leucadia | POINT (260051.55752578154 -568468.1881589917) | 656 | 2043418 |
| 1 | node | 273607369 | restaurant | sushi | Subarashi | POINT (260052.7737039272 -568498.8361691902) | 656 | 2043418 |
| 4 | node | 276540072 | restaurant | chinese | Shanghai Cafe | POINT (260074.93012593564 -568426.8692622595) | 656 | 2043418 |
| 0 | node | 273607070 | restaurant | italian | Leucadia | POINT (260051.55752578154 -568468.1881589917) | 991 | 3113120 |
| 1 | node | 273607369 | restaurant | sushi | Subarashi | POINT (260052.7737039272 -568498.8361691902) | 991 | 3113120 |