How to evaluate your machine learning models?
machine learning
supervised learning
evaluation
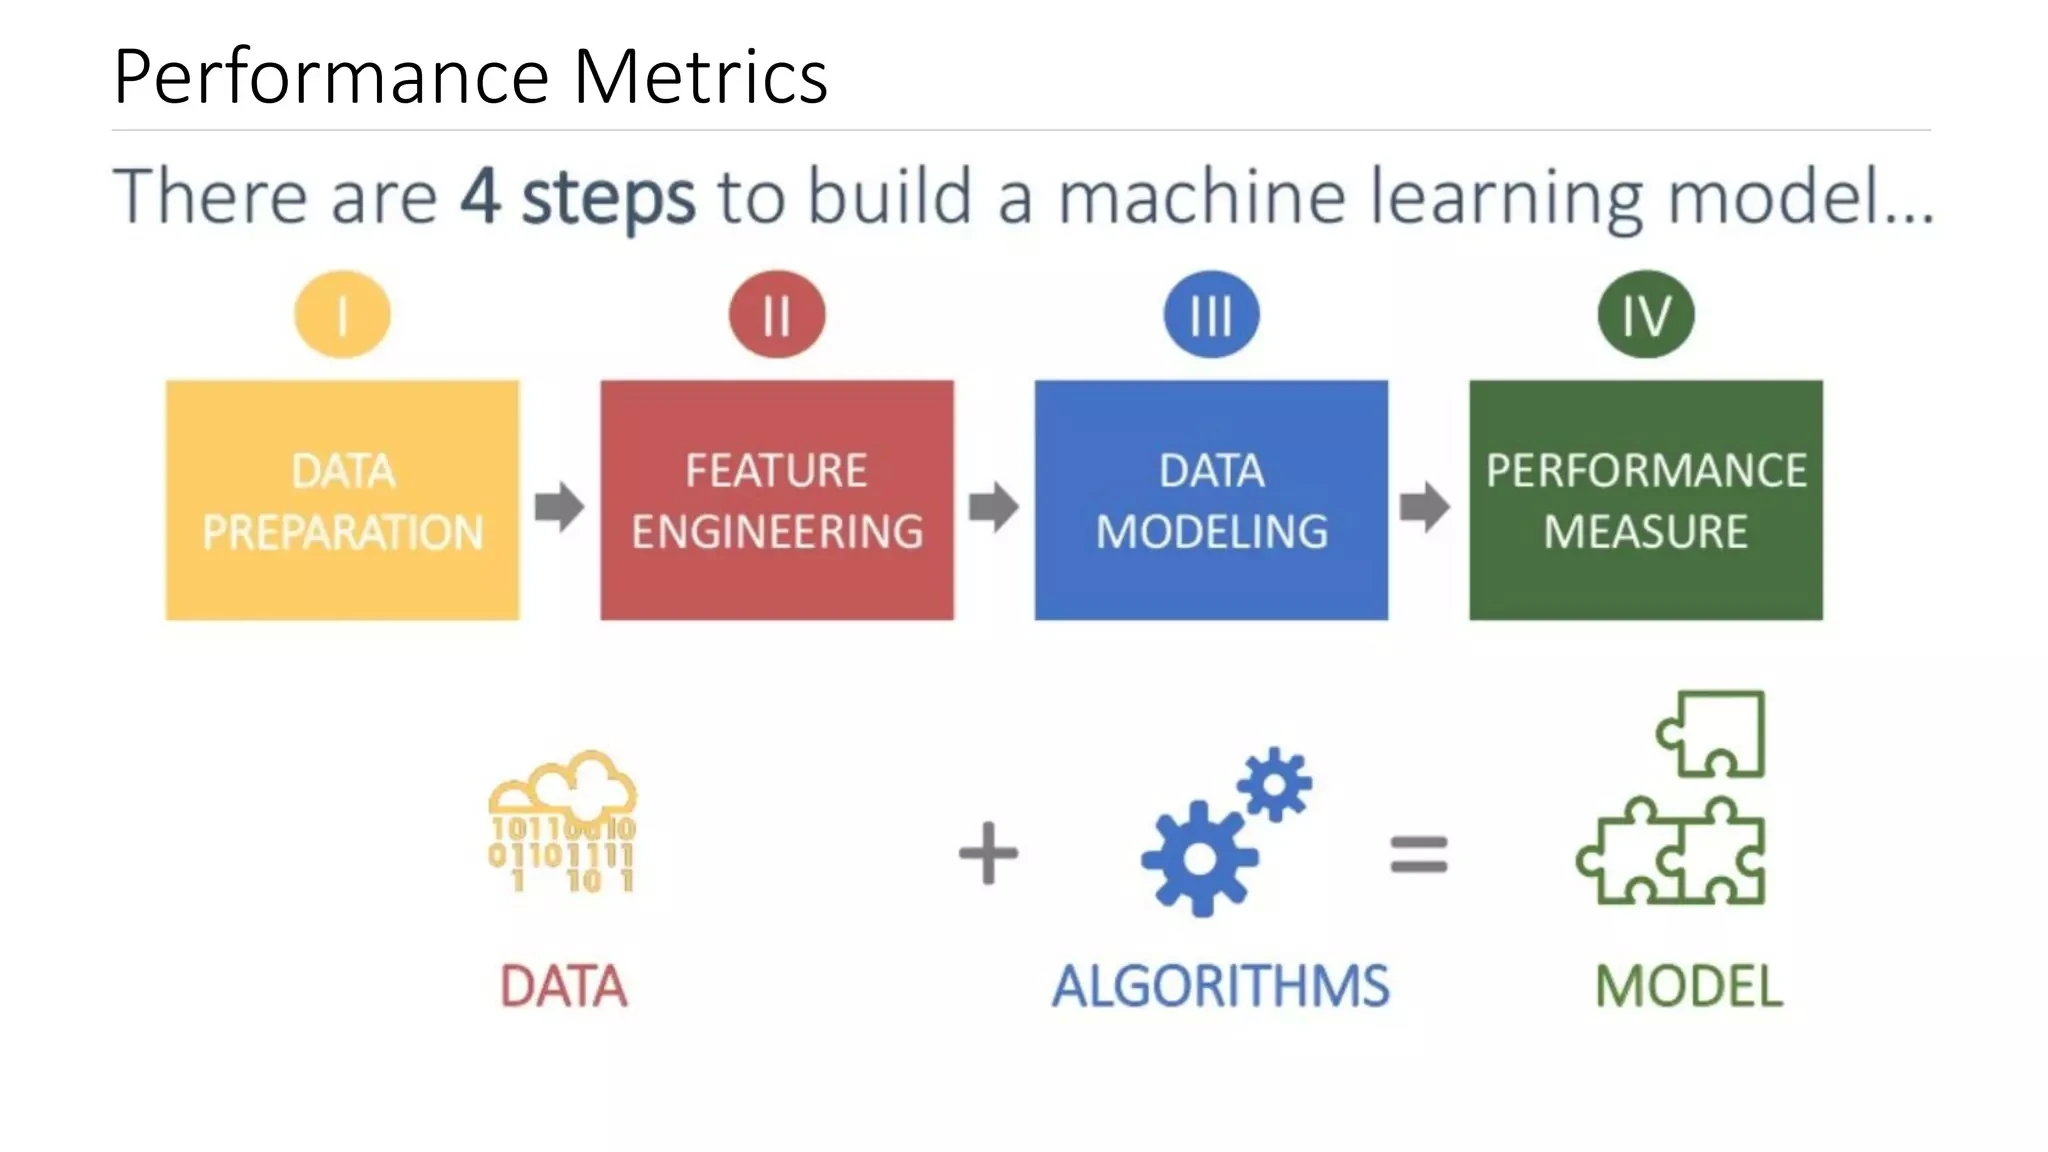
Performance metrics
There are (minimum) 4 steps to build a machine learning model
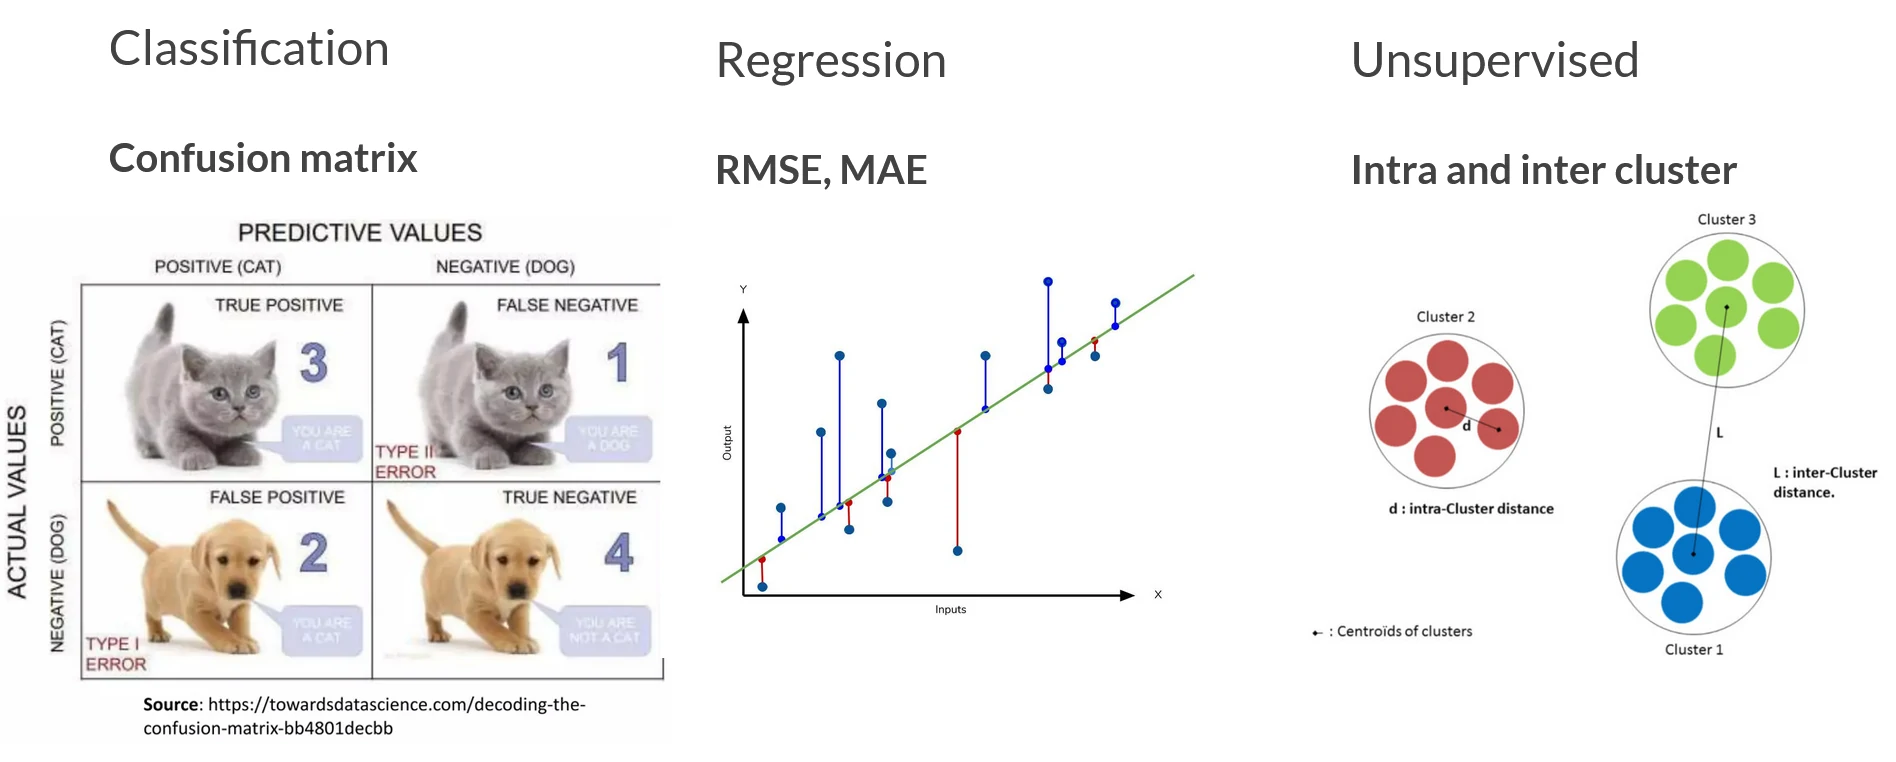
Evaluation Metrics Types
Difference types of evaluation metrics for different type of algorithms
In this section, we will focus on evaluation metrics for classification problems. It starts with a confusion matrix, and we go through its derived metrics and their pros and cons.
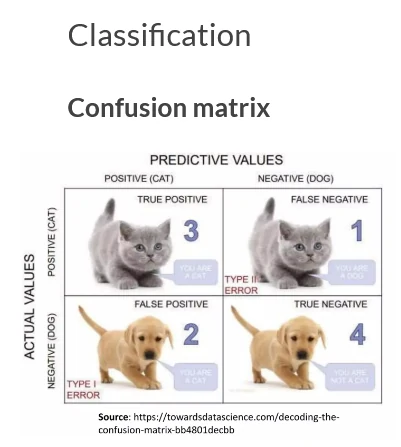
Confusion matrix
When dealing with classification problems, it is better to use a confusion matrix as main matrices, we can calculate other matrices based on these values.
- True positives (TP): Predicted positive and are actually positive
- False positives (FP): Predicted positive and are actually negative
- True negatives (TN): Predicted negative and are actually negative
- False negatives (FN): Predicted negative and are actually positive
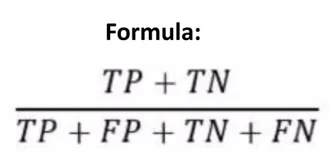
Accuracy
From confusion matrix, we can derived our metrics into most used metric to judge a model such as accuracy.
-
Not clear indicator of the performance
Example: Cancer detection model - Chance of having cancer are very low. Say out of 100, 90 of patients don’t have cancer and the remaining 10 have it.
- We don’t want to miss on a patient who is having cancer but goes undetected (false negative).
- Detecting everyone as not having cancer gives an accuracy of 90% straight. The model did nothing here but just gave cancer free for all the 100 predictions.
Precision
The precision is intuitively the ability of the classifier not to label as positive a sample that is negative.
- Gives percentage of positive instances out of the total predicted positive instances. Denominator is the model prediction done as positive from the whole given dataset.
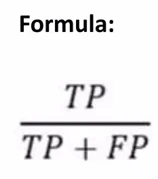
- Use it when you want to find the answer for the: How much the model is right when it says it is right!
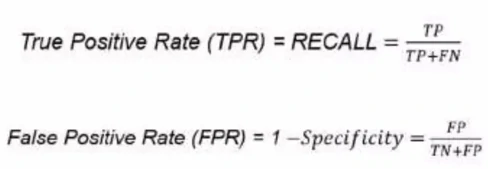
Recall/Sensitivity/True Positive Rate
The recall is intuitively the ability of the classifier to find all the positive samples.
- Gives percentage of positive instances out of the total actual positive instances. Denominator is actual number of positive instances present in the dataset
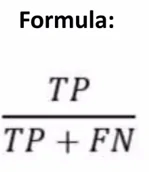
- Use it when you want to find the answer for the: How much extra right ones, the model missed when it showed the right ones!
Specificity
The recall is intuitively the ability of the classifier to find all the negative samples.
- Gives percentage of negative instances out of the total actual negative instances. Like Recall but the shift is on the negative instances. Denominator is actual number of negative instances present in the dataset
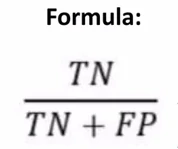
It is finding out how many healthy patients were not having cancer and were told they don’t have cancer.
F1 score
can be interpreted as a harmonic mean of the precision and recall, its best value at 1 and worst score at 0.
- It is harmonic mean of precision and recall so higher the F1 score, the better.
- The relative contribution of precision and recall to the F1 score are equal.
- Model does well in F1 score if the positive predicted are actually positives (precision) and doesn’t miss out on positives and predicts them negative (recall).
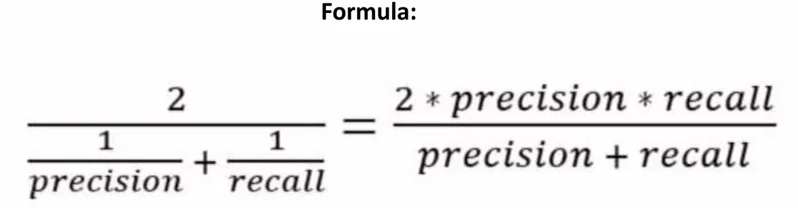
- One drawback: Both precision and recall are given equal importance due to which according to our application we may need one higher than the other and F1 score may not be the exact metric for it.
PR Curve
PR Curve is a plot of the precision (y-axis) and the recall (x-axis) for different probability thresholds.
- It is the curve between precision and recall for various threshold values.
- In the figure: 4 predictors showing their respective precision- recall curve for various threshold values.
- Top right part of the graph is the ideal space where we get high precision and recall
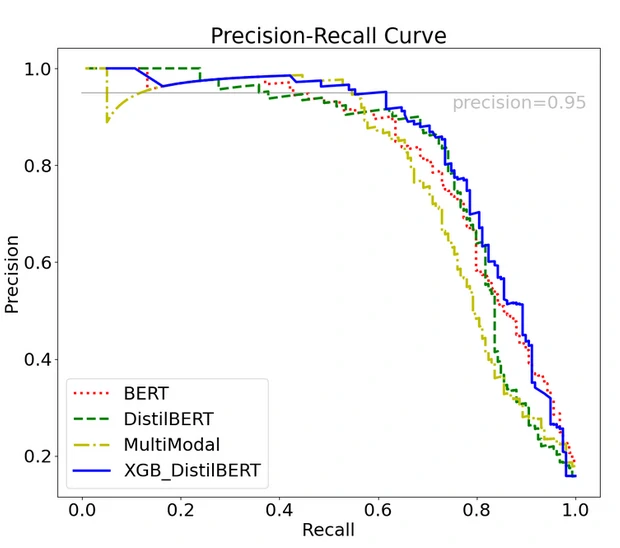
PR AUC is just the area under the curve.
How to choose the predictor and the threshold value?
Based on our application nature
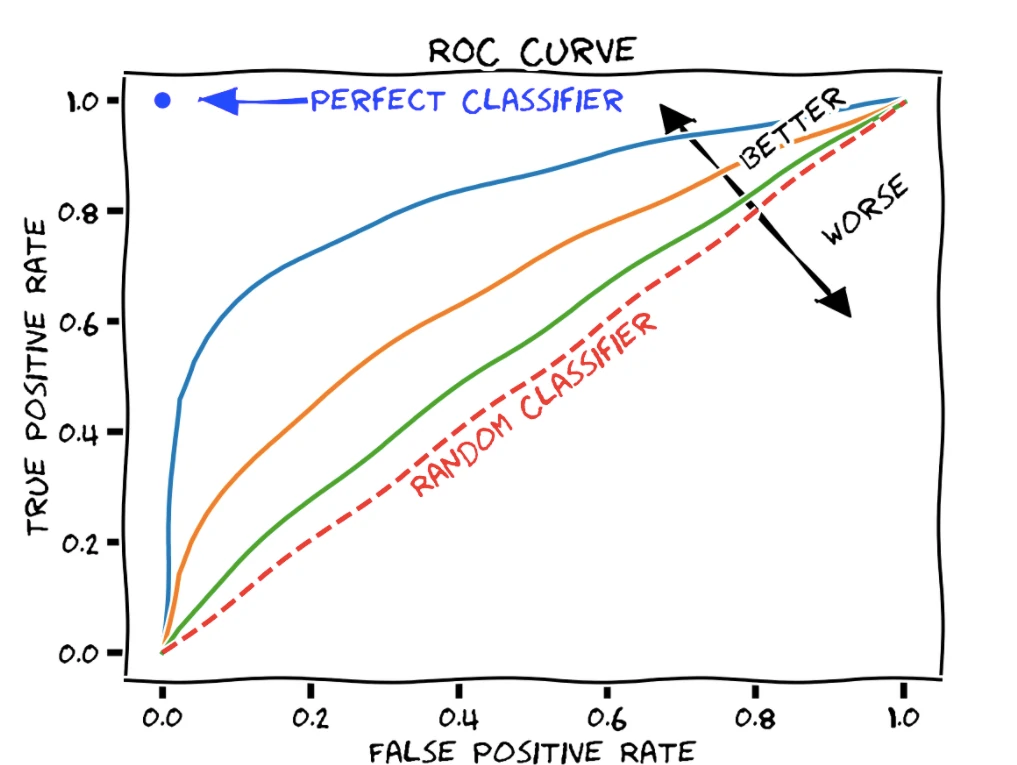
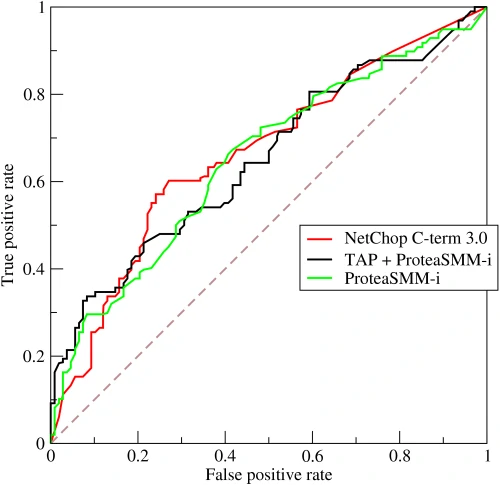
ROC Curve
ROC curve is a plot that summarizes the performance of a binary classification model on the positive class.
- ROC stands for Receiver Operating Characteristic.
- Graph is plotted against TPR and FPR for various threshold values.
- TPR increases, FPR also increases.
- Comparing different predictors (here 3) on a given dataset also becomes easy as you can see in right side figure, one can choose the threshold according to the application at hand.
Which metrics that we can use for our model?
Select metrics that match your goals, data, and methods.
- Moreover, there are a lot of metrics that we can use to evaluate our model, e.g.,
- Logloss
- F2 and F3
- Brier score
- Area under the curve (AUC), etc.
- How to choose evaluation metrics? Choosing evaluation metrics involves understanding project goals, analyzing the nature of the data and problem (classification, regression, etc.), considering the impact of false positives/negatives, aligning with stakeholder requirements, and being mindful of the model’s interpretability and practical constraints. This approach ensures the selected metrics effectively measure model performance and align with the project’s objectives.
Conclusion
Evaluation metric to use depends heavily on the task at hand.
- Confusion matrix Representation of the True positives (TP), False positives (FP), True negatives (TN), False negatives (FN) in a matrix format.
- Accuracy: Worse happens when classes are imbalanced.
- Precision: Find the answer of How much the model is right when it says it is right!
- Recall: Find the answer of How much extra right ones, the model missed when it showed the right ones!
- Various ways to evaluate a machine learning model’s performance
- Specificity: Like Recall but the shift is on the negative instances.
- F1 score: Is harmonic mean of precision and recall so higher the F1 score, the better.
- Precision-Recall or PR curve: Curve between precision and recall for various threshold values.
- ROC curve: Graph is plotted against TPR and FPR for various threshold values.