Remote Sensing Image Dataset
dataset
geospatial
Introduction
Remotely sensed imagery is acquired using various methods (aerial cameras, radar, lidar, satellite sensors) and aerial platforms (drones, aircraft, balloons, satellites). This Page briefly discusses some of the data available on the sites. Because the library expands regularly, we recommend examining the sites frequently.
Remote Sensing Basics
Various characteristics categorize different forms of remotely sensed imagery. For example, Landsat and Sentinel satellite imagery consist of multiple image bands. A distinctive region of the electromagnetic spectrum, specific radiometric properties, and a specific spatial resolution characterize each image band.
The electromagnetic spectrum encompasses a range of all types of radiation (energy). Humans can only see radiation in a very small range of the spectrum (the visible spectrum), but mechanical sensors can record radiation in those wavelengths outside of the visible spectrum, for display and analysis by computer systems.
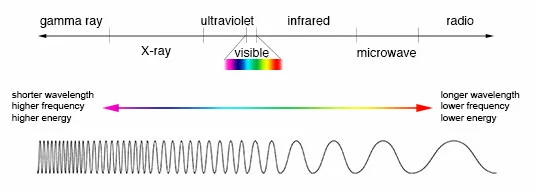
Features on the Earth’s surface (water, soil, plants, snow and all manmade objects, etc.) absorb and re-emit energy (conveying spectral properties that uniquely characterize the Earth’s surface and the objects we observe on its surface). Because of these unique spectral properties, we can “see” and analyze Earth’s features using remotely sensed imagery using more than just the spectral data that seen visually.
Radiometric properties refer to the “brightness” of the various features, defined by a range of brightness values used by a specific sensor. For example, an 8-bit image provides 256 brightness values, and a 16-bit image provides 65,536 brightness values.
Spatial properties refer to the area of the Earth’s surface covered by one pixel of the image. Spatial properties vary from sensor to sensor but also within one sensor, depending on its sensitivity to a specified region of the electromagnetic spectrum. For example, Landsat 9’s red band pixel size measures 30 meters by 30 meters, and Sentinel’s red band pixel size measures 10 meters by 10 meters. And while Landsat 9’s red band has a ground resolution of 30 meters by 30 meters, Landsat 9’s thermal band has a ground resolution of 100 meters by 100 meters.
Landsat
The U.S. Landsat program consists of a family of Earth imaging satellites, developed and maintained through a partnership between the USGS and NASA. The Landsat program retains the distinction of being the world’s longest-running system of land-observation satellites. Landsat 1 was launched in 1972, and its most recent satellite, Landsat 9 was launched on September 27, 2021.
Download
All Landsat images are available for download, at no cost, from the USGS’s EarthExplorer library.
- Sources
- Examples
- How to get 2 remote sensing image from Lansat 8 can be read at this link.
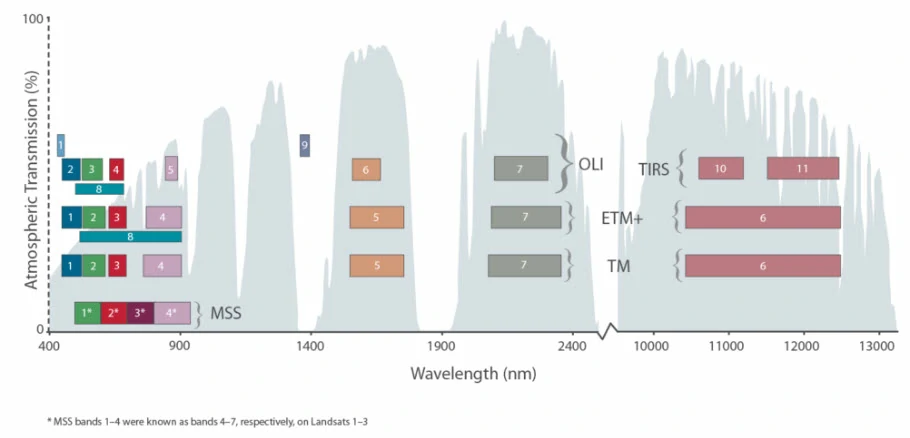
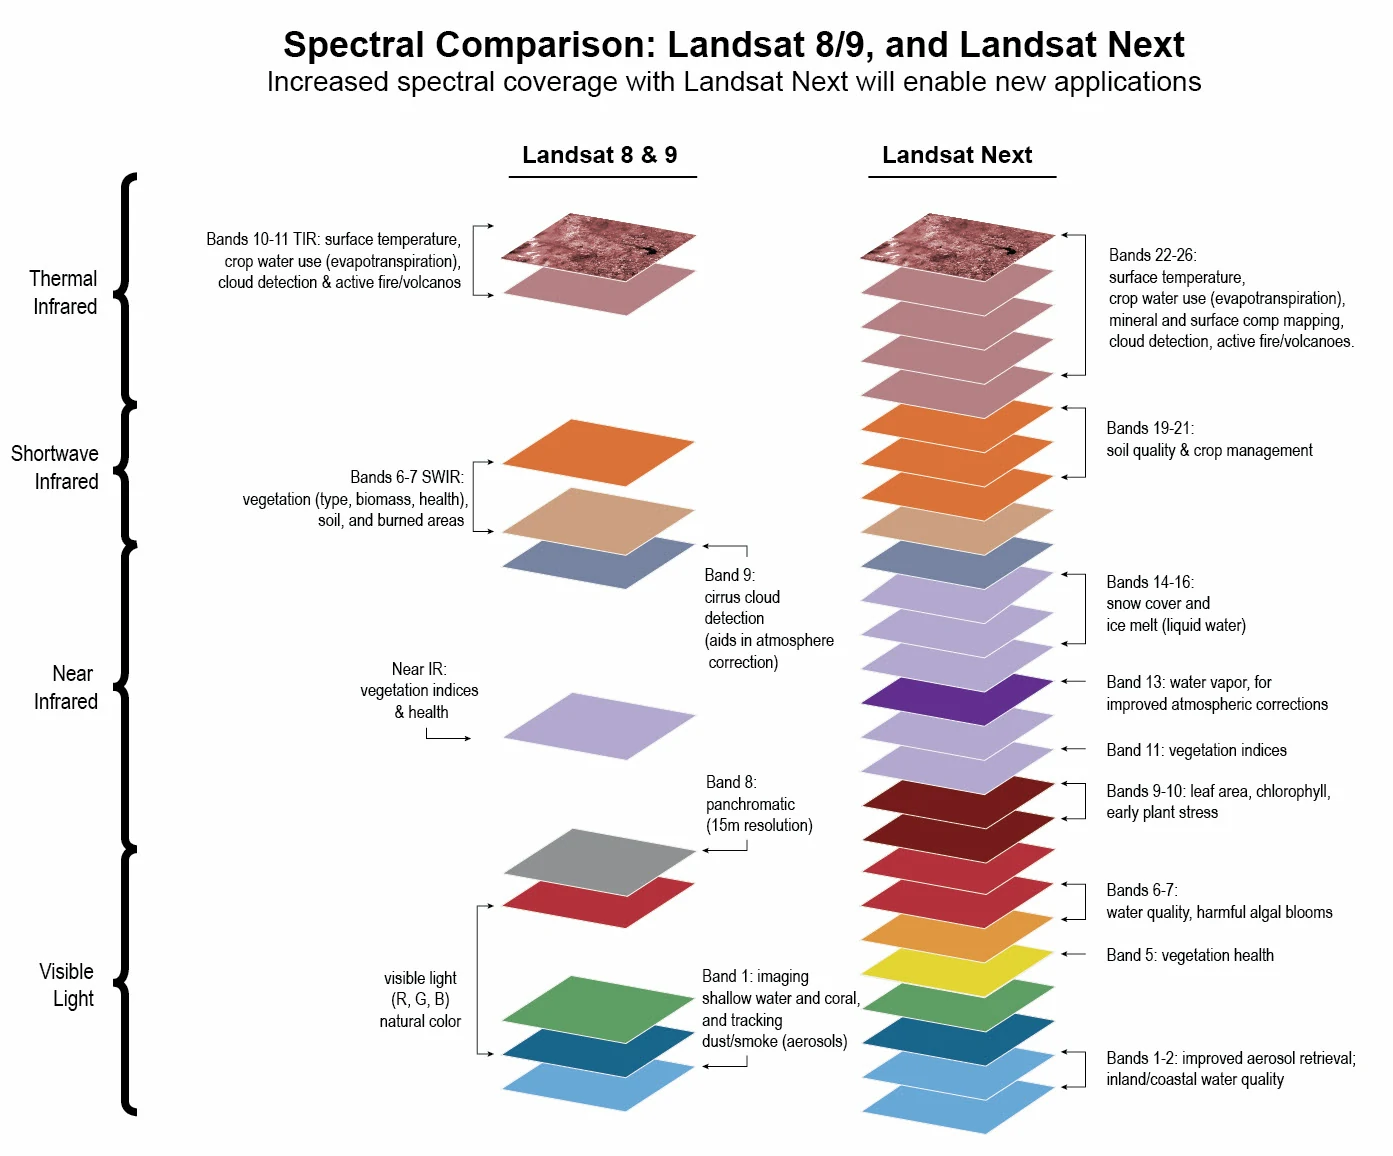
Channels or Bands
Distinctive regions of the electromagnetic spectrum define Landsat’s spectral bands, sometimes referred to as channels, but not all sensors cover the same regions. Landsat 8, for example, uses band definitions that differ from previous Landsat sensors. Landsat 9 sensors are the same as Landsat 8. Detail for this band, we can see at this link.
Detail for each band
- What are the best Landsat spectral bands for use in my research?
- Common Landsat Band Combinations
- What are the band designations for the Landsat satellites?
- How to Interpret Common False Color Images
- Color-Infrared (CIR) Imagery
- Landsat 8 Bands and Band Combinations
- Band Combinations for Landsat 9 Imagery
Sentinel
Sentinel is also an Earth-imaging satellite program. The Sentinel program is designed, launched, and managed by the European Space Agency. Each Sentinel mission involves two satellites. For example, Sentinels 1-A (launched in 2014) and 1-B (launched in 2016) are radar imaging weather satellites. Sentinels 2-A (launched in 2015) and 2-B (launched in 2017) are multi-spectral high-resolution land-observation satellites comparable to the US Landsat system. The first of the Sentinel-6 satellites launched in 2020, with the second scheduled for 2025. Sentinel satellites monitor global sea level changes. To get more information we can see at this link.
Download
As with Landsat, some Sentinel images are available to the public without cost from the European Union via the Copernicus website.
- Sources
- Examples
- How to download
Sentinel-1 GRD SARdata using ArcGIS Pro, can be read at this link.
- How to download
- Preprocessing
- How to applying Orbit Correction and Geometric Terrain Correction for
Sentinel-1 GRD SARdata, can be read at this link.
- How to applying Orbit Correction and Geometric Terrain Correction for
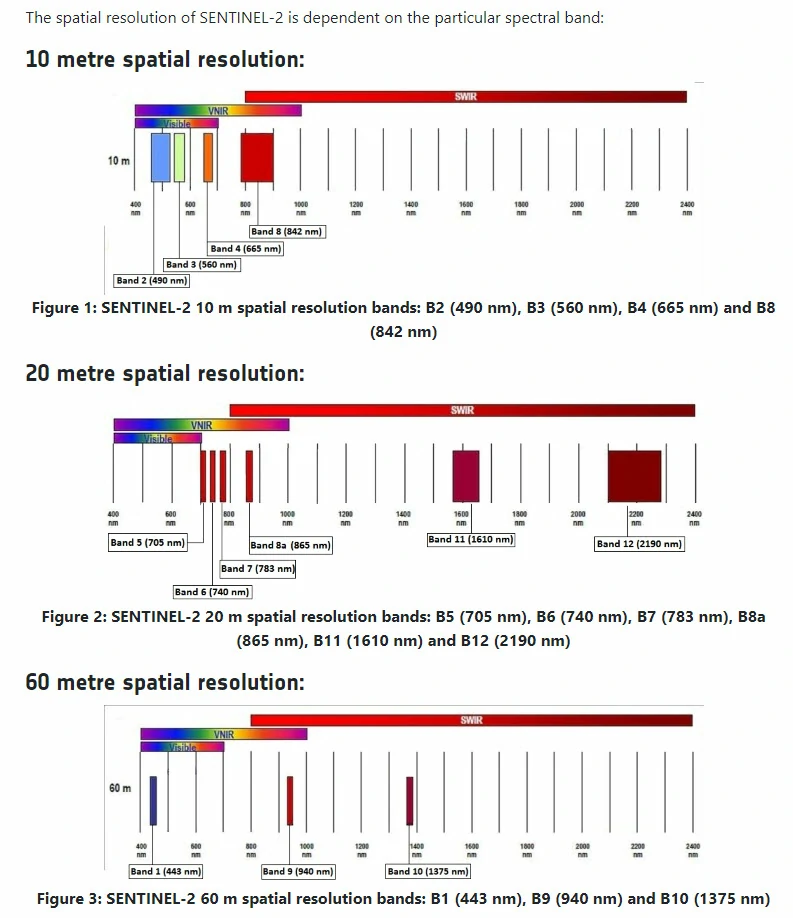
Channels or Bands
Sentinel 2 acquires images in 13 spectral bands and various spatial resolutions.
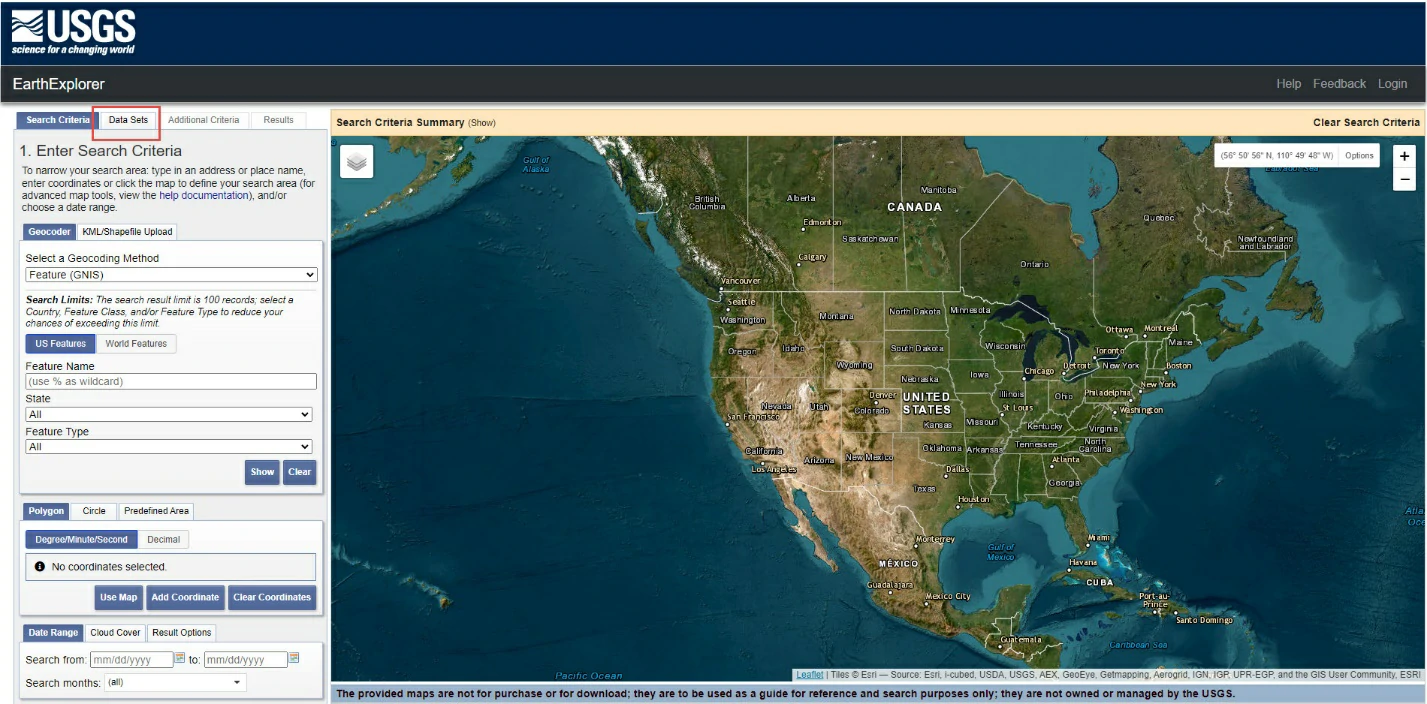
EarthExplorer
Many other remotely sensed image products and data are available from the USGS data library via Earth Explorer.
Download
-
Sign in to your account
-
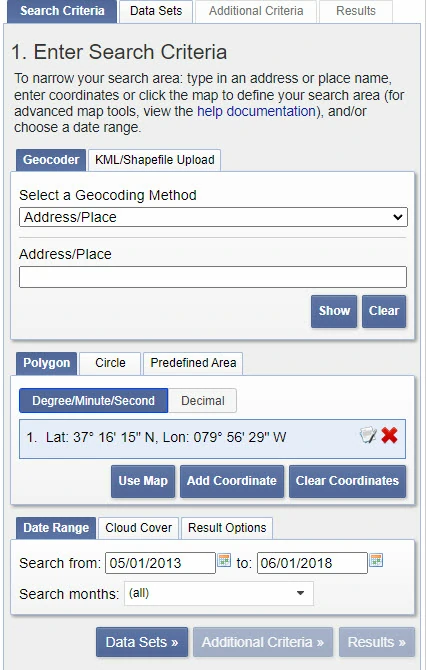
Searching for a Scene - by using
search Criteriatab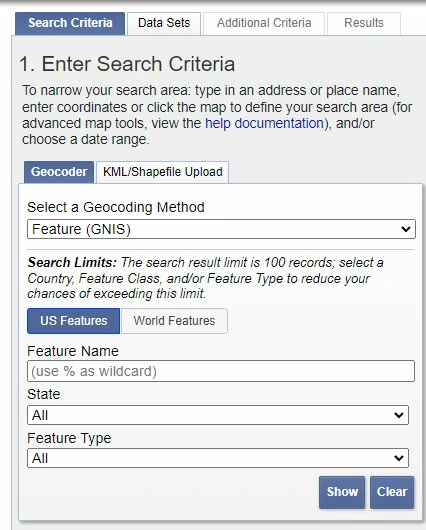
- Geocoder - using manual selection
- Feature (GNIS)
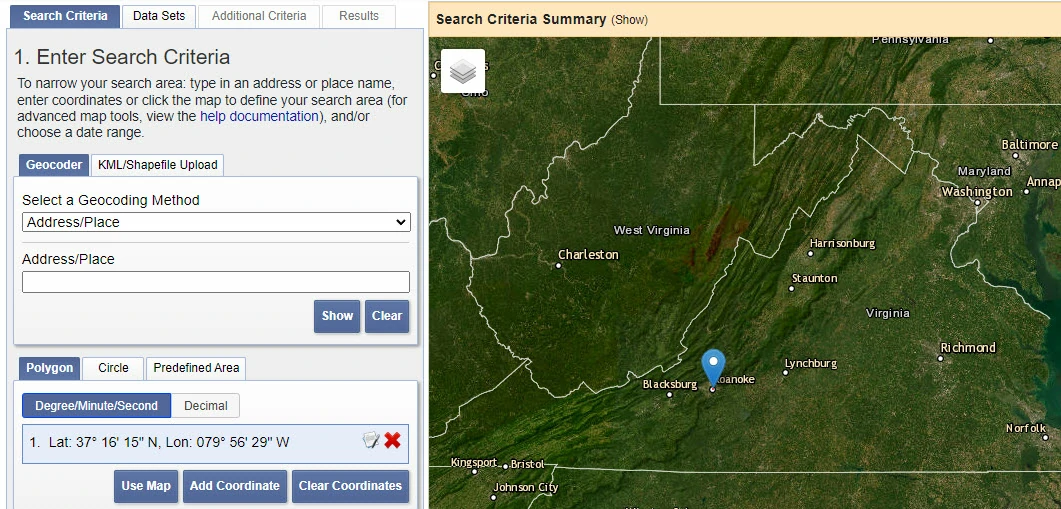
- Address/Place - selecting by name
- Path/Row - selecting by tile unique ID
- KML/Shapefile Upload - using file uploaded
- An additional search method - to add coordinate to more precise boundary.
- Date Range tab - to filter time windows
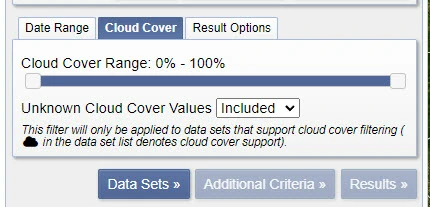
- Cloud Cover - to filter only select image with Cloud Cover Range between selected value (e.i. 0% - 10%). Choosing an image with limited to no cloud cover is extremely important for many land analyses. Cloud cover patterns vary over space. In some scenes, part of the image may include a large body of water, so cloud cover over the open water may not matter if you are mapping terrestrial components. Clouds over the ocean may not matter if the application is focused on terrestrial characteristics.
- Geocoder - using manual selection
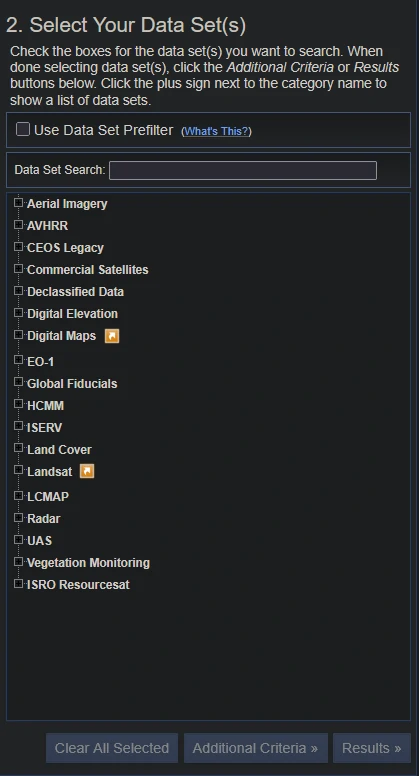
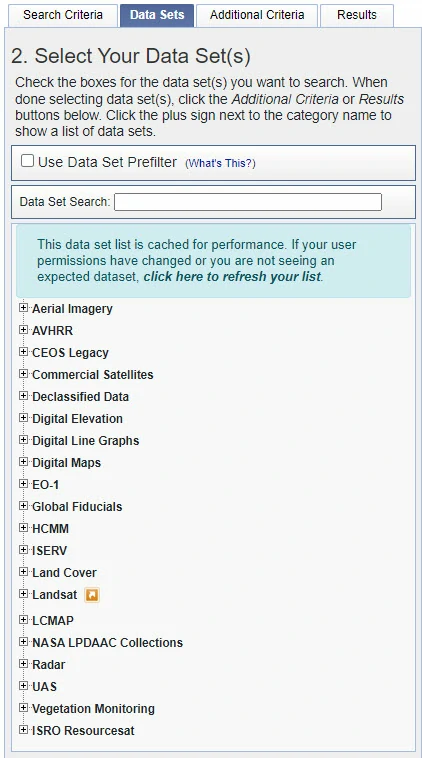
- Searching for specific dataset - by using
Data Setstab- For complete details on the other options, go to this link.
- Some imageries are downloadable and has undergone some processing by the USGS.
- In example:
- Landsat Collection 2 Level-1
- Landsat Legacy - Landsat Legacy consists of a collection of Landsat data that meet specific data quality levels, allowing users to find data suitable for a particular analysis quickly. The sensor, acquisition dates, and processing caliber define the data. The Legacy framework ensures that Landsat products form a consistent archive of known data quality that can support time-series analyses while supporting continuous improvement of the archive and permitting users to access all data as they are acquired.
- Images for normalized difference vegetation index (NDVI) - Bulk ordering for Landsat, MODIS, and others. They are available through on-demand ordering at https://espa.cr.usgs.gov/.
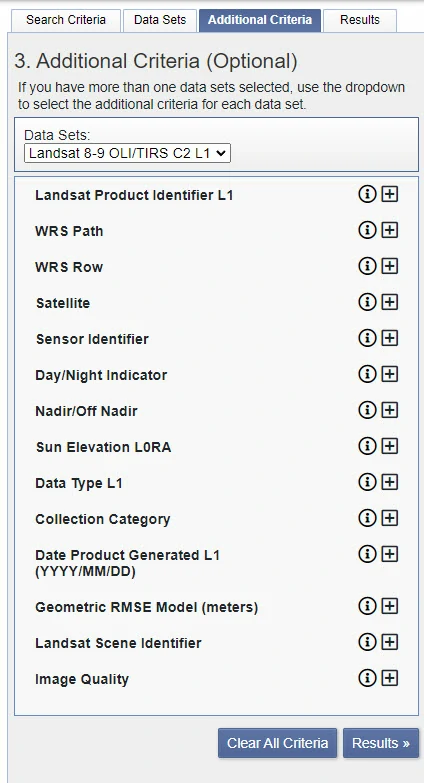
- Add Additional Criteria - by using
additional Criteriatab, which provides additional options for filtering the requests of the image data archive—these choices will help focus the number of images that are returned.- In example:
- Day/Night Indicator - To select only specific condition.
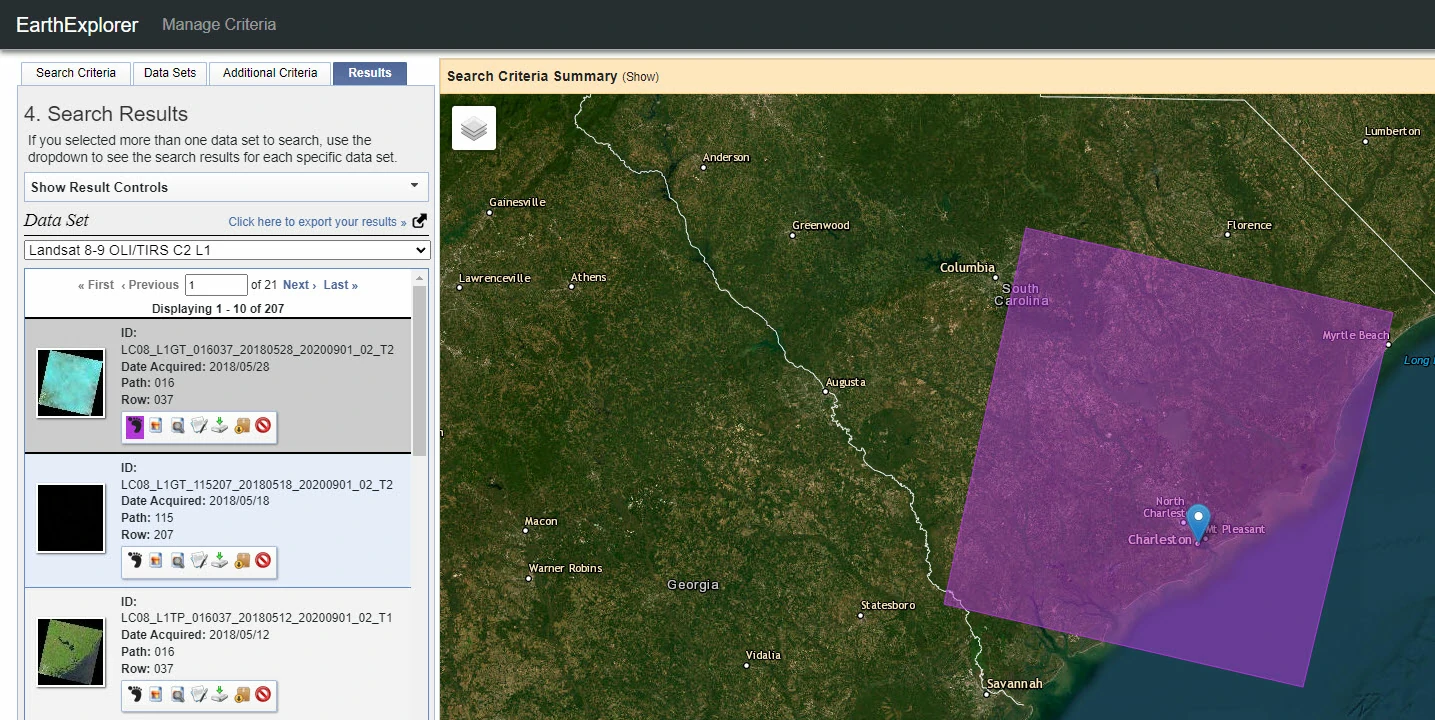
- Interpreting the Search Results
- Examining The name - The USGS uses a naming convention for Landsat products. Reference the naming convention outlined below to better understand images in the Landsat collection data archive.
LXSS_LLLL_PPPRRR_YYYYMMDD_yyyymmdd_CC_TX L = Landsat X = Sensor (“C”=OLI/TIRS combined, “O”=OLI-only, “T”=TIRS-only, “E”=ETM+, “T”=“TM, “M”=MSS) SS = Satellite (”07”=Landsat 7, “08”=Landsat 8, “09”=Landsat 9) LLL = Processing correction level (L1TP/L1GT/L1GS) PPP = WRS path RRR = WRS row YYYYMMDD = Acquisition year, month, day yyyymmdd – Processing year, month, day CC = Collection number (01, 02, …) TX = Collection category (“RT”=Real-Time, “T1”=Tier 1, “T2”=Tier 2)- Examining the tile - Some interest area by be overlaping with 2 or more tiles, so by default the image will be overlap to get single image.
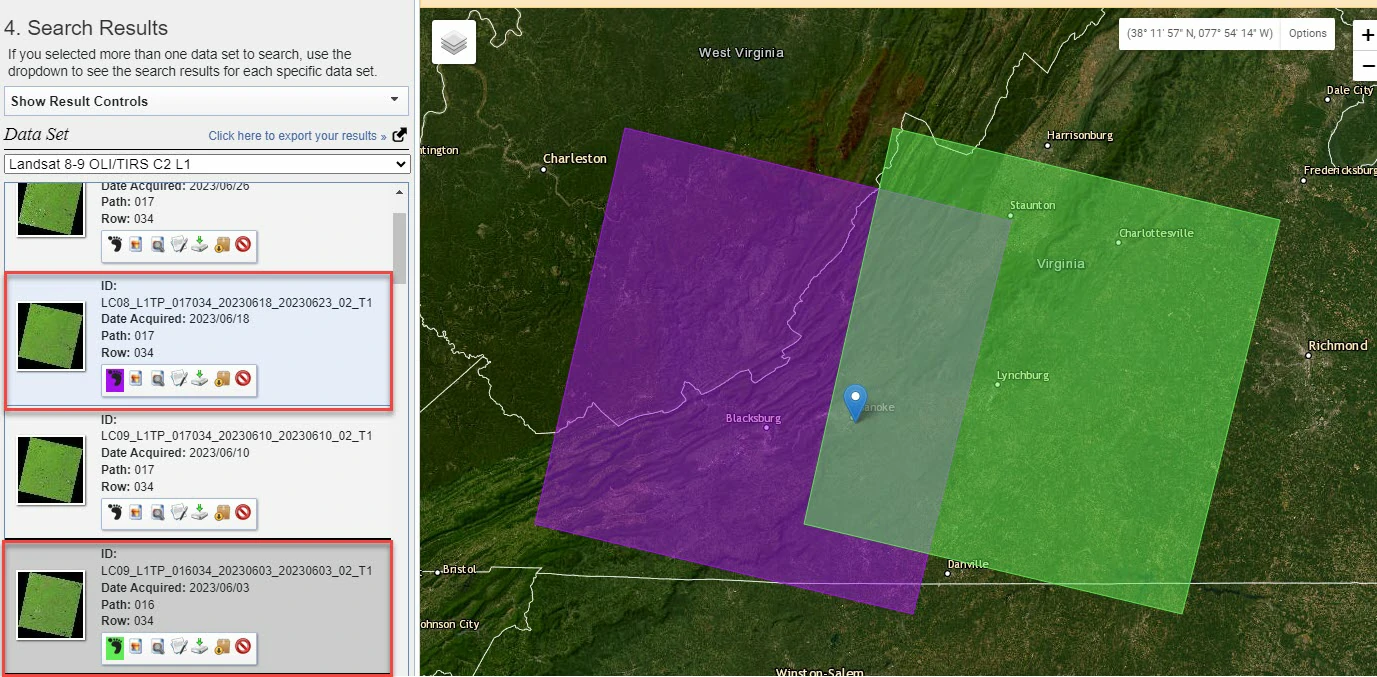
- Examining the preview image - to check our image (i.e. is it cloud -free? is it cover all interest area?)
- Downloading the Image
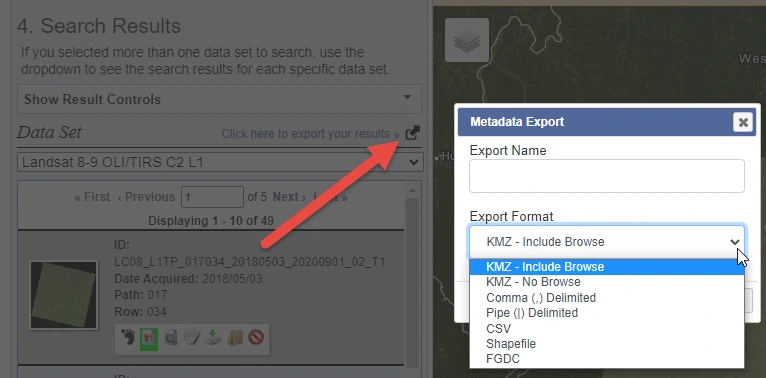
- Make sure to copy all metadata
- Make sure the download and data type is available
- Using Bulk download - if the download icon is not enabled, the scene is unavailable for direct download; the image is ordered using the Add to Bulk Download icon.
The National Map
Some remotely sensed data is available from The National Map download website. This website includes imagery and data types such as elevation, Lidar, IfSAR, and US Topographic Maps. Information on using The National Map downloader can be found at the USGS YouTube Channel here or here.
Download
https://apps.nationalmap.gov/downloader/
Conclusion
Whether remotely sensed imagery is used for analysis or as a stand-alone image for reference purposes, choosing the most appropriate one is essential. If the image is needed for a specific purpose, coverage area, spatial extent, spectral and radiometric properties, the user, and the customer must all be considered during the selection process.