Create Deep Analysis for Missing value From Dataset
descriptive analytics
Introduction
This project aims to easy-to-use missing data visualizations and utilities that allows you to get a quick visual summary of the completeness (or lack thereof) of our dataset.
Dataset
Load dataset
we use simple and common titanic dataset from seaborn library.
df = sns.load_dataset("titanic")
| survived | pclass | sex | age | sibsp | parch | fare | embarked | class | who | adult_male | deck | embark_town | alive | alone | |
|---|---|---|---|---|---|---|---|---|---|---|---|---|---|---|---|
| 0 | 0 | 3 | male | 22 | 1 | 0 | 7.25 | S | Third | man | True | nan | Southampton | no | False |
| 1 | 1 | 1 | female | 38 | 1 | 0 | 71.2833 | C | First | woman | False | C | Cherbourg | yes | False |
| 2 | 1 | 3 | female | 26 | 0 | 0 | 7.925 | S | Third | woman | False | nan | Southampton | yes | True |
| 3 | 1 | 1 | female | 35 | 1 | 0 | 53.1 | S | First | woman | False | C | Southampton | yes | False |
| 4 | 0 | 3 | male | 35 | 0 | 0 | 8.05 | S | Third | man | True | nan | Southampton | no | True |
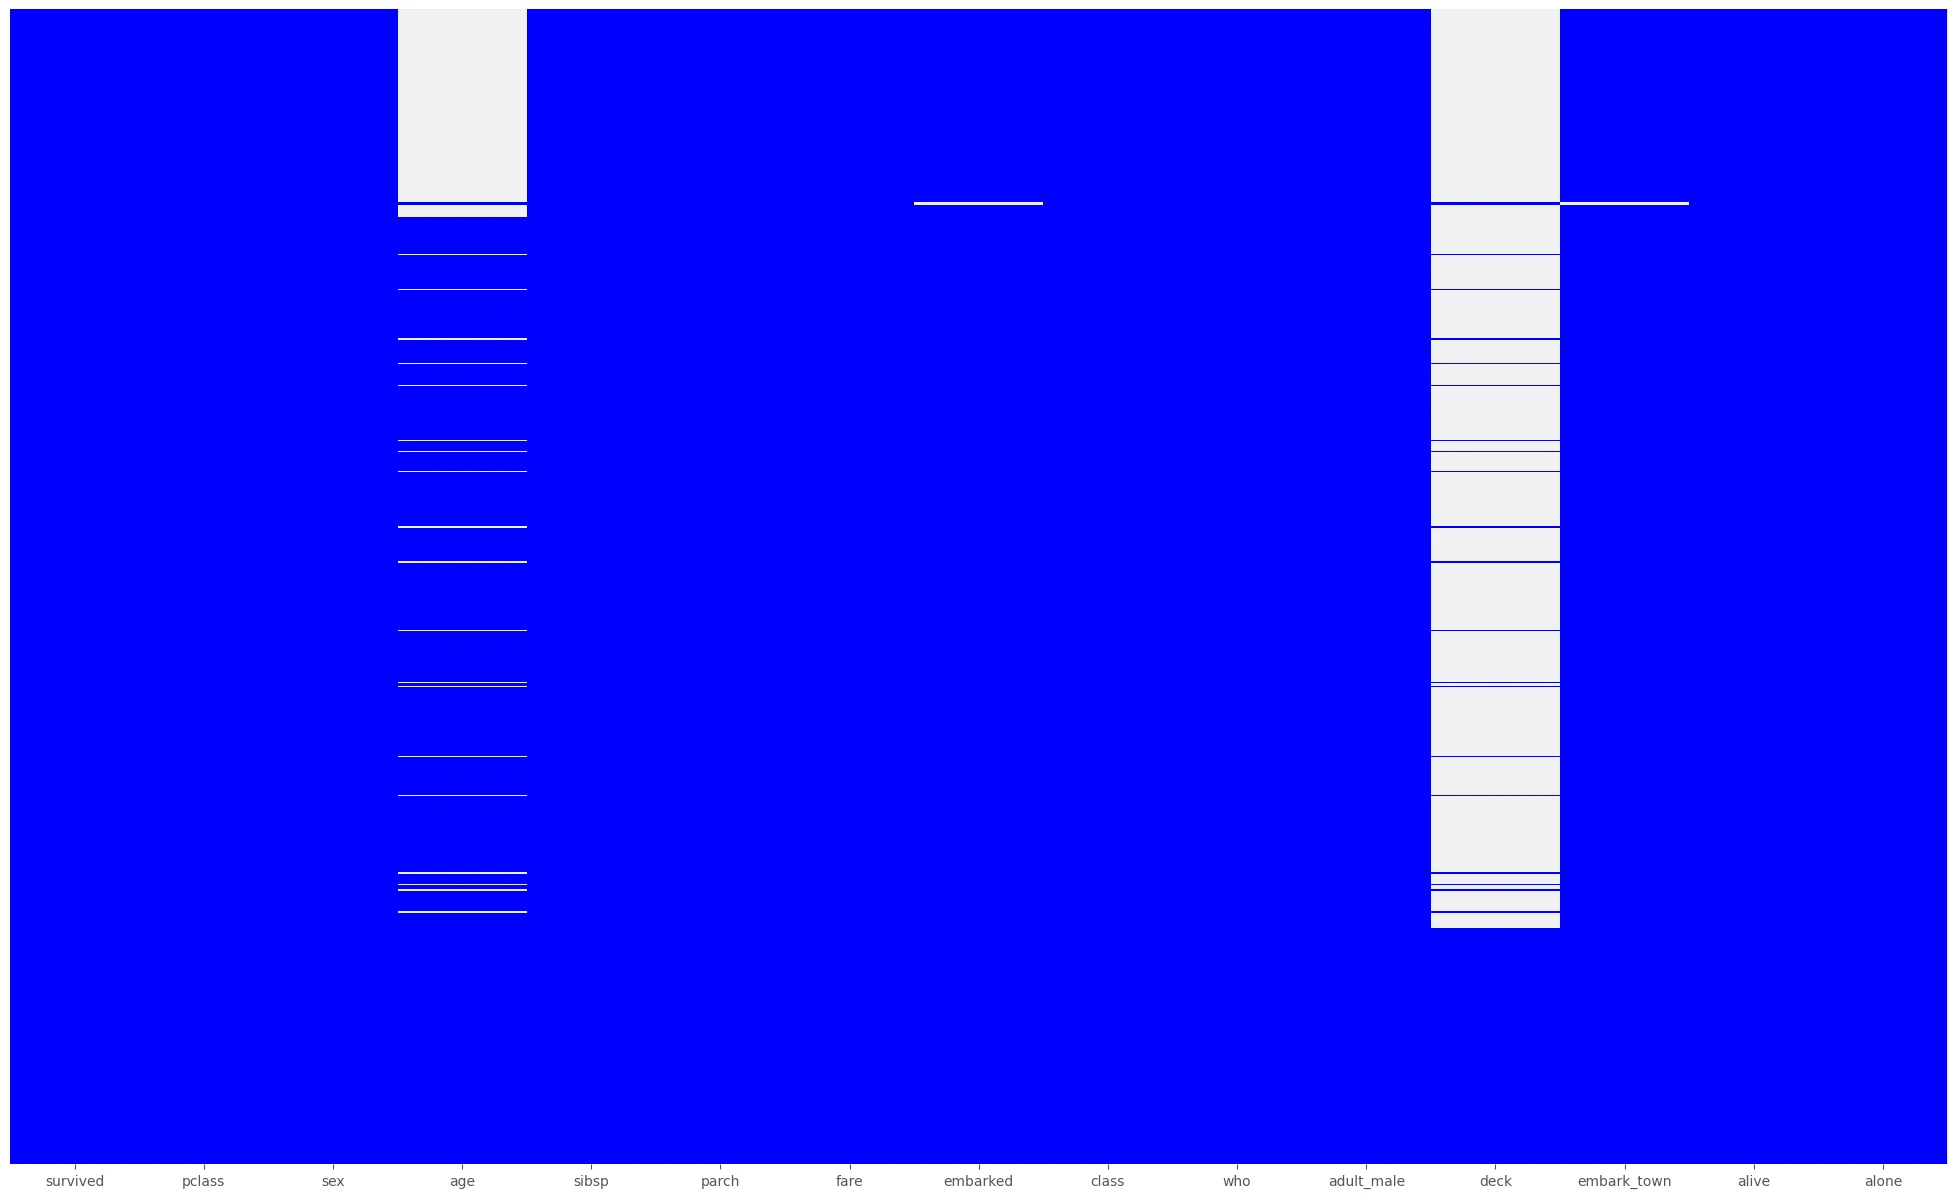
First Example
Show an heatmap for missing value
by calling describe.heatmap_mv we can generate heatmap image that will visualize missing value in our dataset.
describe.heatmap_mv(main_data)
This function requires the following parameters:
- main_data (
dataframe): Data input
The result
Second Example
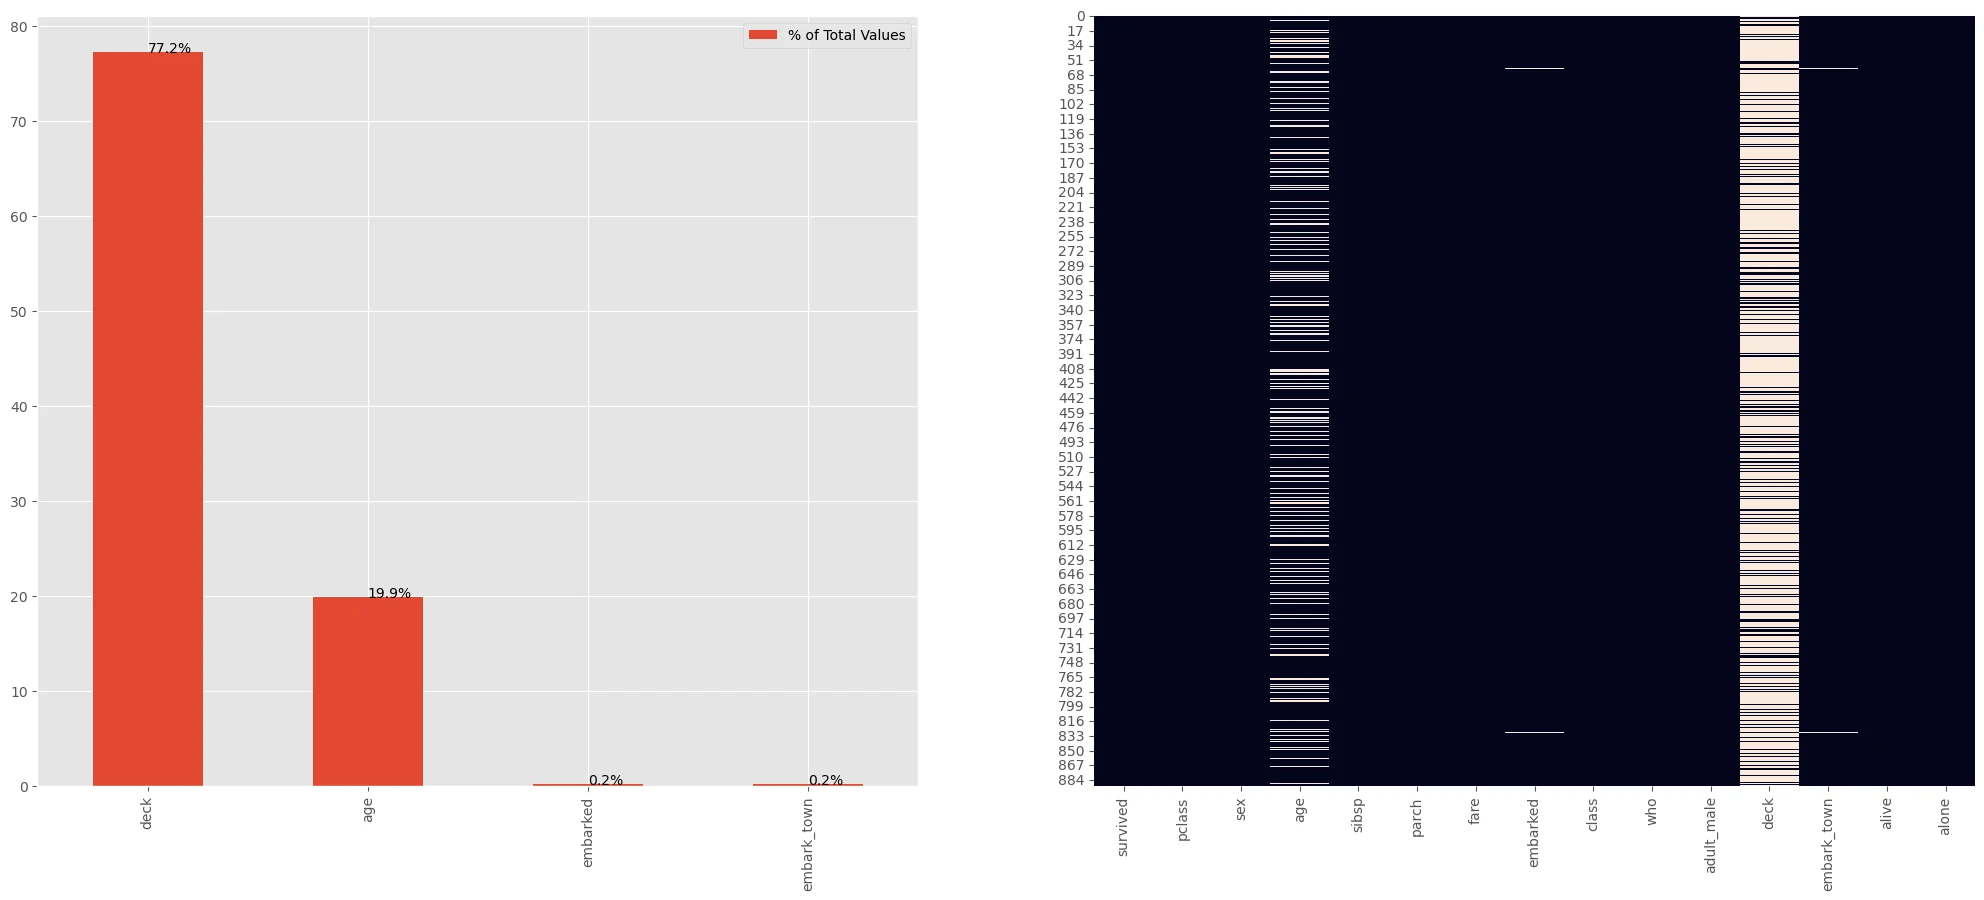
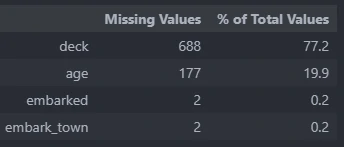
Show an heatmap and bar plot for missing value
by calling describe.missing_values_table we can more extensively analyze missing value in our dataset.
describe.missing_values_table(main_data)
This function requires the following parameters:
- main_data (
dataframe): Data input
The result
Your selected dataframe has 15 columns.
There are 4 columns that have missing values.
 _________
Third Example
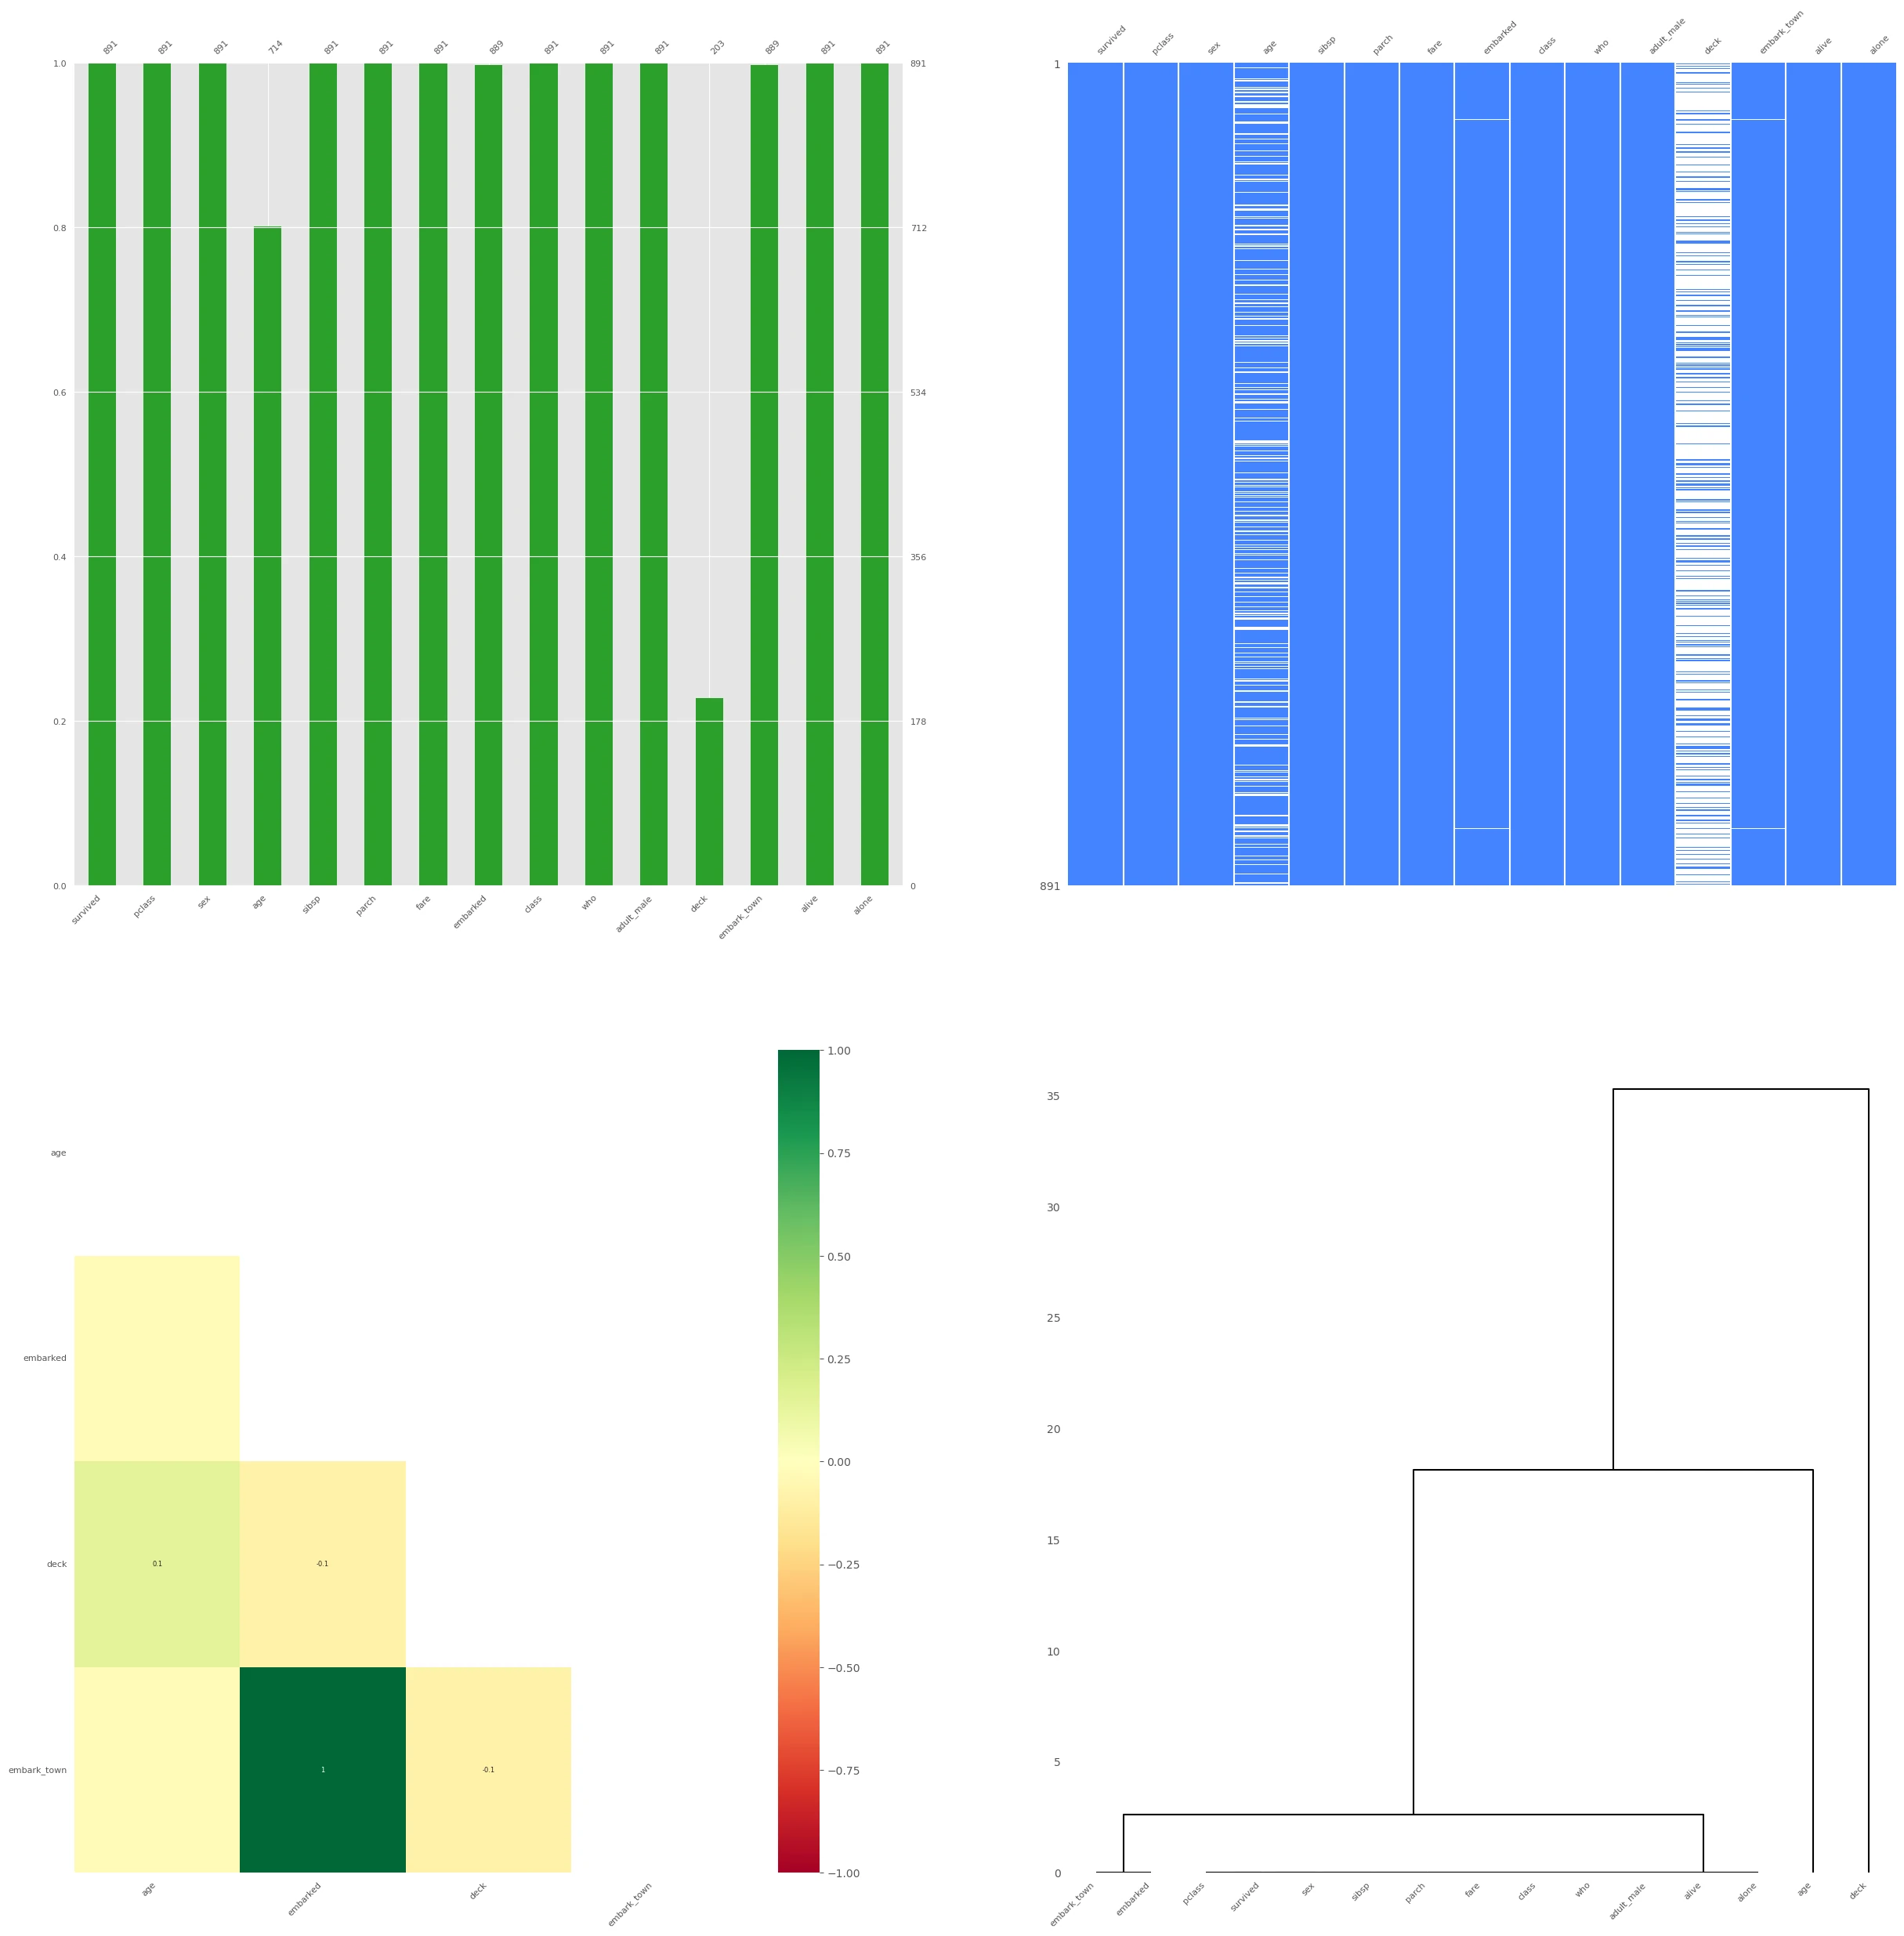
Show an heatmap and bar plot for missing value. it also provides correlation plot and hierarchy plot for each missing value.
by calling describe.missing_no we can calculate more deep analysis for missing value.
describe.missing_no(main_data)
This function requires the following parameters:
- main_data (
dataframe): Data input
The result
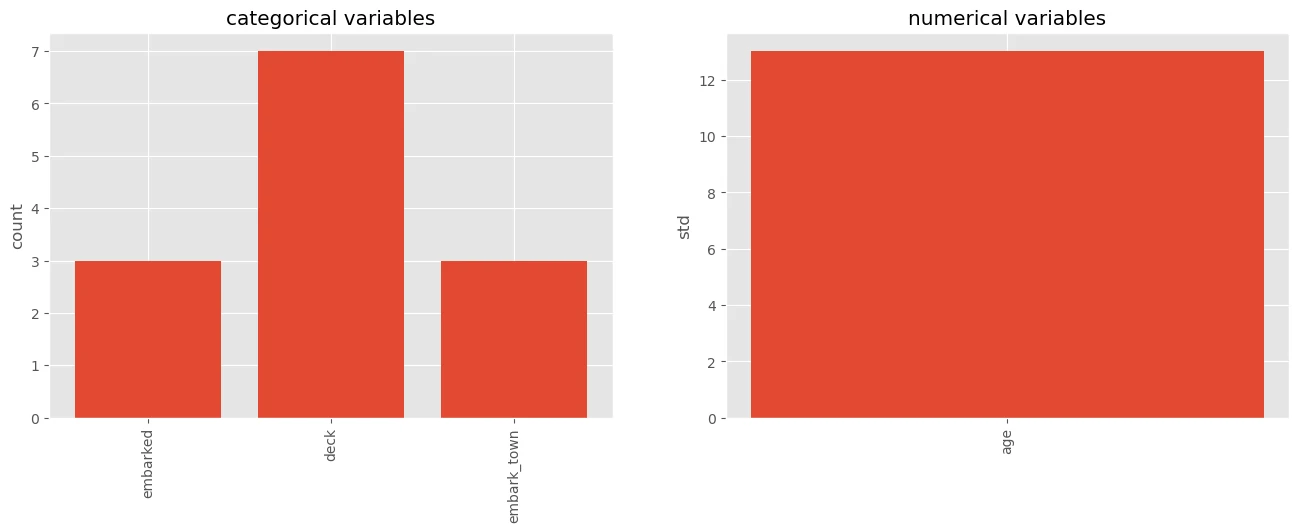
Forth Example
Show descriptive statistic of datasets. Count value for categorical and std for numerical, next seperate cat and num columns and return data with filling nan.
by calling describe.fillna_separate_obj we can calculate more deep analysis for missing value.
describe.fillna_separate_obj(main_data,fill_cat,fill_num)
This function requires the following parameters:
- main_data (
dataframe): Data input - fill_cat (
string): Value for filling the null value at categorical type data - fill_num (
string): Value for filling the null value at numerical type data
The result