Big Data and Data Science
data science
data government
data management
- Big Data and Data Science
- Business Drivers
- Context Diagram
- Principles
- Essential Concepts
- Define Big Data Strategy and Business Needs
- Choose Data Sources
- Acquire and Ingest Data Sources
- Develop Data Hypotheses and Methods
- Integrate / Align Data for Analysis
- Explore Data Using Models
- Deploy and Monitor
- Tools
- Analytic Modeling
- Big Data Modeling
- Implementation Guidelines
- Strategy Alignment
- Readiness Assessment / Risk Assessment
- Organization and Cultural Change
- Big Data and Data Science Governance
- Visualization Channels Management
- Data Science and Visualization Standards
- Data Security
- Metadata
- Data Quality
- Metrics
Business Drivers
Big Data can stimulate innovation by making more and larger data sets available for exploration.
Context Diagram

Principles
- Organizations should carefully manage Metadata related to Big Data sources in order to have an accurate inventory of data files, their origins, and their value.
Essential Concepts
Data Science merges data mining, statistical analysis, and machine learning with data integration and data modeling capabilities, to build predictive models that explore data content patterns.
Developing Data Science solutions involves the iterative inclusion of data sources into models that develop insights.
Data Science depends on:
- Rich data sources
- Information alignment and analysis
- Information delivery
- Presentation of findings and data insights
The Data Science Process
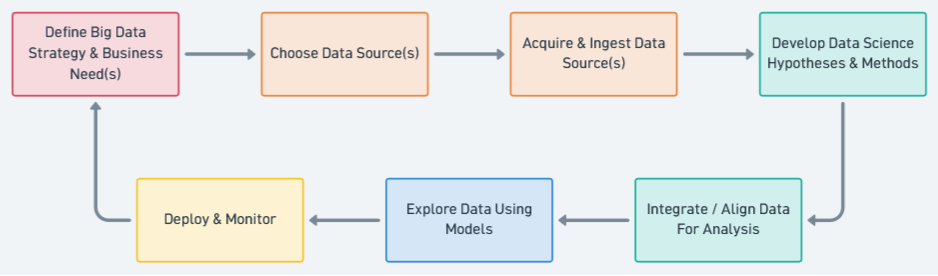
- Define Big Data strategy and business needs: Define the requirements that identify desired outcomes with measurable tangible benefits.
- Choose data sources: Identify gaps in the current data asset base and find data sources to fill those gaps.
- Acquire and ingest data sources: Obtain data sets and onboard them.
- Develop Data Science hypotheses and methods: Explore data sources via profiling, visualization, mining, etc.; refine requirements. Define model algorithm inputs, types, or model hypotheses and methods of analysis.
- Integrate and align data for analysis: Model feasibility depends in part on the quality of the source data. Leverage trusted and credible sources. Apply appropriate data integration and cleansing techniques to increase quality and usefulness of provisioned data sets.
- Explore data using models: Apply statistical analysis and machine learning algorithms against the integrated data. Validate, train, and over time, evolve the model. Training entails repeated runs of the model against actual data to verify assumptions and make adjustments, such as identifying outliers. Through this process, requirements will be refined. Initial feasibility metrics guide evolution of the model. New hypotheses may be introduced that require additional data sets and results of this exploration will shape the future modeling and outputs (even changing the requirements).
- Deploy and monitor: Those models that produce useful information can be deployed to production for ongoing monitoring of value and effectiveness. Often Data Science projects turn into data warehousing projects where more vigorous development processes are put in place.
Big Data
The list of V’s has expanded:
- Volume: Refers to the amount of data. Big Data often has thousands of entities or elements in billions of records.
- Velocity: Refers to the speed at which data is captured, generated, or shared. Big Data is often generated and can also be distributed and even analyzed in realtime.
- Variety / Variability: Refers to the forms in which data is captured or delivered. Big Data requires storage of multiple formats; data structure is often inconsistent within or across data sets.
- Viscosity: Refers to how difficult the data is to use or integrate.
- Volatility: Refers to how often data changes occur and therefore how long the data is useful.
- Veracity: Refers to how trustworthy the data is.
Big Data Architecture Components
The biggest difference between DW/BI and Big Data processing is that in a traditional data warehouse, data is integrated as it is brought into the warehouse (extract, TRANSFORM, load); while in a Big Data environment, data is ingested and loaded before it is integrated (extract, LOAD, transform). Thus it has significant implications for how data is managed.
Data Lake
A data lake is an environment where a vast amount of data of various types and structures can be ingested, stored, assessed, and analyzed. It providing:
- An environment for Data Scientists to mine and analyze data.
- A central storage area for raw data, with minimal, if any, transformation
- Alternate storage for detailed historical data warehouse data
- An online archive for records
- An environment to ingest streaming data with automated pattern identification
The risk of a data lake is that it can quickly become a data swamp – messy, unclean, and inconsistent. It is critical to manage Metadata as the data is ingested.
In order to understand how the data in a data lake is associated or connected, use unique keys or other techniques (semantic models, data models, etc.).
Services-Based Architecture
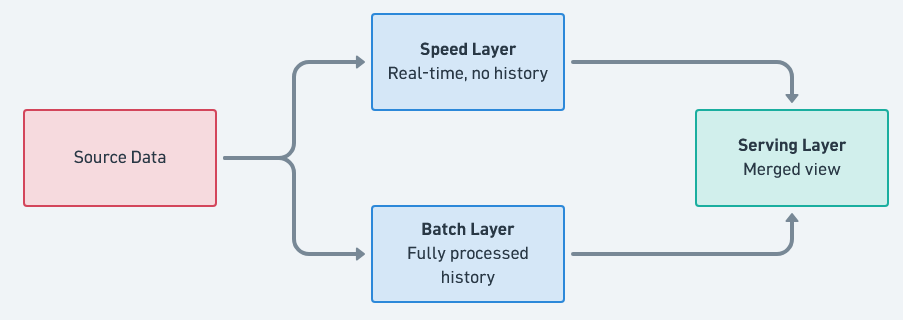
Services-based architecture (SBA) is emerging as a way to provide immediate (if not completely accurate or complete) data, as well as update a complete, accurate historical data set, using the same source. SBA architectures have three main components:
- Batch layer: A data lake serves as the batch layer, containing both recent and historical data.
- Speed layer: Contains only realtime data
- Serving layer: Provides an interface to join data from the batch and speed layers.
Data is loaded into both the batch and speed layers. All analytic computations are performed on data in both the batch and speed layers, which most likely requires implementation in two separate systems.
The batch layer is often referred to as the structure-over-time component (here every transaction is an insert), whereas in the speed layer (often referred to as an Operational Data Store or ODS), all transactions are updates (or inserts only if required). In this manner, the architecture prevents synchronization issues while simultaneously creating a current state and a history layer.
Machine Learning
Machine Learning explores the construction and study of learning algorithms.
- It can be viewed as a union of unsupervised learning methods, more commonly referred to as data mining
- Supervised learning methods deeply rooted in mathematical theory, specifically statistics, combinatorics, and optimization.
- Reinforcement learning, where goal performance is earned but not specifically teacher recognized.
While it taps into data in new ways, machine learning has ethical implications, especially with respect to the principle of transparency. They learn things. However, it is not always clear how they learn. As the algorithms that drive these processes become more complex, they also become more opaque, functioning as black boxes.
The need for transparency – the ability to see how decisions are made – will likely increase as this functionality evolves and is put to use in a wider array of situations.
Sentiment Analysis
Media monitoring and text analysis are automated methods for retrieving insights from large unstructured or semi-structured data, such as transaction data, social media, blogs, and web news sites.
Data and Text Mining
Data mining is a particular kind of analysis that reveals patterns in data using various algorithms.
Data and text mining use a range of techniques, including:
- Profiling: Profiling attempts to characterize the typical behavior of an individual, group, or population. Profiling is used to establish behavioral norms for anomaly detection applications, such as fraud detection and monitoring for intrusions to computer systems. Profile results are inputs for many unsupervised learning components.
- Data reduction: Data reduction replaces a large data set with a smaller set of data that contains much of the important information in the larger set. The smaller data set may be easier to analyze or process.
- Association: Association is an unsupervised learning process to find relationships between studied elements based on transactions involving them. Examples of association include: Frequent item set mining, rule discovery, and market-based analysis. Recommendation systems on the internet use this process as well.
- Clustering: Clustering group elements in a study together by their shared characteristics. Customer segmentation is an example of clustering.
- Self-organizing maps: Self-organizing maps are a neural network method of cluster analysis. Sometimes referred to as Kohonen Maps, or topologically ordered maps, they aim to reduce the dimensionality in the evaluation space while preserving distance and proximity relationships as much as possible, akin to multi-dimension scaling. Reducing the dimensionality is like removing one variable from the equation without violating the outcome. This makes it easier to solve and visualize.
Predictive Analytics
Predictive Analytics is the subfield of supervised learning where users attempt to model data elements and predict future outcomes through evaluation of probability estimates.
The amount of time that a predictive model provides between the prediction and event predicted is frequently very small (seconds or less than a second). Investment in very low latency technology solutions, such as in-memory databases, high-speed networks, and even physically proximity to the source of the data, optimizes an organization’s ability to react to the prediction.
Prescriptive Analytics
Prescriptive analytics take predictive analytics a step farther to define actions that will affect outcomes, rather than just predicting the outcomes from actions that have occurred.
Unstructured Data Analytics
Unstructured data analytics combines text mining, association, clustering, and other unsupervised learning techniques to codify large data sets.
Scanning and tagging is one way to add ‘hooks’ to unstructured data that allow filtering and linking to related structured data. However, knowing what tags to generate based on what conditions is difficult. It is an iterative process, from when proposed tag conditions are identified, tags are assigned as data is ingested, then analytics uses those tags to validate the tag condition, and analyze the tagged data, which then leads to potentially changed tag conditions, or more tags.
Operational Analytics
The concept of operational analytics (also known as operational BI or streaming analytics) has emerged from the integration of realtime analytics into operations.
Operational analytics involves tracking and integrating realtime streams of information, deriving conclusions based on predictive models of behavior, and triggering automatic responses and alerts.
Data Visualization
Visualization is the process of interpreting concepts, ideas, and facts by using pictures or graphical representations. Data visualization facilitates understanding of the underlying data by presenting it in a visual summary, such as a chart or graph. Data visualizations condense and encapsulate characteristics data, making them easier to see. They can surface opportunities, identify risks, or highlight messages.
Data Mashups
Mashups combine data and services to create visualization for insight or analysis.
Define Big Data Strategy and Business Needs
An organization’s Big Data strategy needs to be aligned with and support its overall business strategy and business requirements and be part of its data strategy. A Big Data strategy must include criteria to evaluate:
- What problems the organization is trying to solve. What it needs analytics for.
- Determine that the data is to be used to understand the business or the business environment
- To prove ideas about the value of new products
- To explore something that is unknown
- To invent a new way to do business
- To establish a gating process to evaluate these initiatives at several phases during the implementation.
- The value and feasibility of initiatives need to be evaluated at several points in time.
- What data sources to use or acquire
- Internal sources may be easy to use, but may also be limited in scope.
- External sources may be useful, but are outside operational control (managed by others, or not controlled by anyone).
- The timeliness and scope of the data to provision
- The impact on and relation to other data structures
- Influences to existing modeled data
Choose Data Sources
The choice of data sources for Data Science work must be driven by the problems the organization is trying to solve.
It is not limited by format and can include data both external to and internal to an organization. The ability to incorporate this data into a solution also comes with risks. The quality and reliability of the data needs to be evaluated and a plan for use over time needs to be put into place.
To use that data and manage it over time, it is still necessary to know basic facts:
- Its origin
- Its format
- What the data elements represent
- How it connects to other data
- How frequently it will be updated
Review the available data sources, and the processes that create those sources and manage the plan for new sources.
- Foundational data: Consider foundational data components such as POS (Point of Sale) in a sales analysis.
- Granularity: Ideally, obtain data in its most granular form (not aggregated). That way it can be aggregated for a range of purposes.
- Consistency: If possible, select data that will appear appropriately and consistently across visualizations, or recognize limitations.
- Reliability: Choose data sources that are meaningful and credible over time. Use trusted, authoritative sources.
- Inspect/profile new sources: Test changes before adding new data sets. Unexpected material or significant changes in visualization outcomes can occur with the inclusion of new data sources.
Risks associated with data sources include privacy concerns.
- Criteria used to select or filter data also pose a risk. These criteria should be objectively managed to avoid biases or skews.
- Filtering can have a material impact on visualization.
- Discretion is necessary when removing outliers, restricting data sets to a limited domain, or dropping sparse elements.
Acquire and Ingest Data Sources
Once the sources are identified, they need to be found, sometimes purchased, and ingested (loaded) into the Big Data environment. During this process, capture critical Metadata about the source, such as its origin, size, currency, and additional knowledge about content.
Because building Data Science models is an iterative process, so is data ingestion. Iteratively identify gaps in the current data asset base and onboard those sources.
Before integrating the data, assess its quality. Assessment can be as simple querying to find out how many fields contain null values, or as complex as running a data quality toolset or data analytic utility against the data to profile, classify, and identify relationships between data elements.
The assessment process provides valuable insight into how the data can be integrated with other data sets, such as Master Data or historical warehouse data. It also provides information that can be used in model training sets and validation activities.
Develop Data Hypotheses and Methods
Data Science is about building answer sets that can find meaning or insights within the data.
The development of Data Science solutions entails building statistical models that find correlations and trends within and between data elements and data sets.
Models often have more than one variable so the best practice is to find deterministic outcomes – or in other words, use best guesses as to the values to be expected. However, best guesses themselves should be educated.
Models depend on both the quality of input data and the soundness of the model itself.
Integrate / Align Data for Analysis
Preparing the data for analysis involves understanding what is in the data, finding links between data from the various sources, and aligning common data for use.
One method is to use a common model that integrates the data using a common key.
Consider using techniques during the initial phases that will aide in understanding how the model will show results once published.
Explore Data Using Models
Populate Predictive Model
Configuring predictive models includes pre-populating the model with historical information concerning the customer, market, products, or other factors that are included in the model other than the triggering factor.
Train the Model
Execute the model against the data in order to train the model. Training includes repeated runs of the model against the data to verify assumptions. Training will result in changes to the model. Training requires balance.
Avoid over-fitting by training against a limited data fold.
Model validation must be complete before transitioning to production. Address any population imbalances or data biases with model offsets that are trained and validated; this can be tweaked in production as the initial offset is gradually adjusted through actual population interactions.
Evaluate Model
Refinements to the business requirements are expected at this point and early feasibility metrics can guide the management efforts towards further processing or discarding.
There is an ethical component to practicing Data Science and it needs to be applied when evaluating models. Models can have unexpected results or unintentionally reflect the assumptions and biases of the people who create them.
Create Data Visualizations
Data visualization based on the model must meet the specific needs related to the purpose of the model. Each visualization should answer a question or provide an insight.
Select the appropriate visual to fulfill that purpose. Ensure that the visualization addresses an audience; adjust the layout and complexity to highlight and simplify accordingly.
Deploy and Monitor
A model that meets business needs in a feasible manner can be deployed to production for ongoing monitoring. Such models will require refinement and maintenance.
Expose Insights and Findings
Insights should be connected to action items so that the organization benefits from the Data Science work.
Iterate with Additional Data Sources
The presentation of findings and data insights usually generates questions that start a new process of research. Data Science is iterative, so Big Data development is iterative to support it. This process of learning from a specific set of data sources often leads to the need for different or additional data sources to both support the conclusions found and to add insights to the existing model(s).
Tools
To understand the industry, one must understand its drivers.
Existing data warehouses, data marts, and operational data stores (ODS) are being augmented to carry Big Data workload. NoSQL technologies allow storage and query of unstructured and semi-structured data.
Scalable distributed databases automatically provide sharding capabilities (the ability to scale across servers natively) for parallel query execution. Of course, as with any other database, structural definition and mapping to unstructured data sets remain largely manual processes.
Decision criteria tool sets, process implementation tools, and professional services offerings can both facilitate and expedite the process of choosing an initial set of tools. As when acquiring BI tools, it is critical to evaluate all options: build, buy, or rent (provisioned as software-as-a-service).
MPP Shared-nothing Technologies and Architecture
MPP databases, data is partitioned (logically distributed) across multiple processing servers (computational nodes), with each server having its own dedicated memory to process data locally.
Communication between processing servers is usually controlled by a master host and occurs over a network interconnect. There is no disk sharing or memory contention, hence the name, ‘shared-nothing’. MPP has evolved because traditional computing paradigms (indexes, distributed data sets, etc.) did not provide acceptable response times on massive tables.
This technology also enabled in-database analytical functions – the ability to execute analytical functions (like K-means Clustering, Regression, etc.) at the processor level. Distribution of workload to the processor level greatly speeds up analytical queries
A system that automatically distributes data and parallelizes query workloads across all available (localized) hardware is the optimum solution for Big Data analytics.
Distributed File-based Databases
Distributed file-based solutions technologies, such as the open source Hadoop, are an inexpensive way to store large amounts of data in different formats. Hadoop stores files of any type – structured, semi-structured, and unstructured. Using a configuration similar to MPP Shared-nothing (an MPP foundation for file storage), it shares files across processing servers.
From Hadoop, data can be moved to MPP Shared-nothing databases to have algorithms run against it.
The language used in file-based solutions is called MapReduce. This language has three main steps:
- Map: Identify and obtain the data to be analyzed
- Shuffle: Combine the data according to the analytical patterns desired
- Reduce: Remove duplication or perform aggregation in order to reduce the size of the resulting data set to only what is required
In-database Algorithms
Big Data Cloud Solutions
Statistical Computing and Graphical Languages
Data Visualization Tools
Analytic Modeling
Analytic models are associated with different depths of analysis:
- Descriptive modeling summarizes or represents the data structures in a compact manner. This approach does not always validate a causal hypothesis or predict outcomes. However, it does use algorithms to define or refine relationships across variables in a way that could provide input to such analysis.
- Explanatory modeling is the application of statistical models to data for testing causal hypothesis about theoretical constructs. While it uses techniques similar to data mining and predictive analytics, its purpose is different. It does not predict outcomes; it seeks to match model results only with existing data.
Key to predictive analytics is to learn by example through training the model. Performance of a learning method relates its predictive abilities on independent test data. Assessment guides the choice of learning and measures the quality of the chosen model. Model selection estimates performance where assessment evaluates the generalization error on new data.
Avoid over-fitting – a situation that occurs when the model is trained against non-representative datasets, is overly complex in relation to its data, or has described noise instead of the underlying relationship(s).
The training set is used to fit the model, the validation set is used to predict error for selection, and the test set is used for assessment of the generalization error of the final model.
Reusing the same test-set repeatedly can underestimate the true test error.
Big Data Modeling
The main driver to physically model a data warehouse is to enable population of data for query performance.
The value of modeling the data is that it enables people to understand data content.
Implementation Guidelines
Many of the general principles of managing warehouse data apply to managing Big Data:
- Ensuring that the data sources are reliable
- Having sufficient Metadata to enable data use
- Managing the quality of data
- Figuring out how to integrate data from different sources
- Ensuring that data is secure and protected.
The differences in implementing a Big Data environment are connected to a set of unknowns: how the data will be used, which data will be valuable, how long it needs to be retained.
Strategy Alignment
Any Big Data / Data Science program should be strategically aligned with organizational objectives. Establishing a Big Data strategy drives activities related to user community, data security, Metadata management, including lineage, and Data Quality Management.
The strategy should document goals, approach, and governance principles. Strategy deliverables should account for managing:
- Information lifecycle
- Metadata
- Data quality
- Data acquisition
- Data access and security
- Data governance
- Data privacy
- Learning and adoption
- Operations
Readiness Assessment / Risk Assessment
Assess organizational readiness in relation to critical success factors:
- Business relevance: How well do the Big Data / Data Science initiatives and their corresponding use cases align with the company’s business? To succeed, they must strongly enforce a business function or process.
- Business readiness: Is the business partner prepared for a longterm incremental delivery? Have they committed themselves to establishing centers of excellence to sustain the product in future releases? How broad is the average knowledge or skill gap within the target community and can that be crossed within a single increment?
- Economic viability: Has the proposed solution considered conservatively the tangible and intangible benefits? Has assessment of ownership costs accounted for the option of buying or leasing items versus building from scratch?
- Prototype: Can the proposed solution be prototyped for a subset of the end user community for a finite timeframe to demonstrate proposed value? Big bang implementations can cause big dollar impacts and a proving ground can mitigate these delivery risks.
Likely the most challenging decisions will be around data procurement, platform development, and resourcing.
- Many sources exist for digital data stores and not all need to be in-house owned and operated. Some can be procured while others can be leased.
- Multiple tools and techniques are on the market; matching to general needs will be a challenge.
- Securing staff with specific skills in a timely manner and retaining top talent during an implementation may require consideration of alternatives including professional services, cloud sourcing or collaborating.
- The time to build in-house talent may well exceed the delivery window.
Organization and Cultural Change
Business people must be fully engaged in order to realize benefits from the advanced analytics. A communications and education program is required to affect this.
A Center of Excellence can provide training, start-up sets, design best practices, data source tips and tricks, and other point solutions or artifacts to help empower business users towards a self-service model.
This center can provide timely communications across the developer, designer, analyst, and data consumer communities.
Big Data and Data Science Governance
Big Data, like other data, requires governance. Sourcing, source analysis, ingestion, enrichment, and publishing processes require business as well as technical controls, addressing such questions as:
- Sourcing: What to source, when to source, what is the best source of data for particular study
- Sharing: What data sharing agreements and contracts to enter into, terms and conditions both inside and outside the organization
- Metadata: What the data means on the source side, how to interpret the results on the output side
- Enrichment: Whether to enrich the data, how to enrich the data, and the benefits of enriching the data
- Access: What to publish, to whom, how, and when
Visualization Channels Management
A critical success factor in implementing a Data Science approach is the alignment of the appropriate visualization tools to the user community.
Be aware that changing data providers or selection criteria will likely have downstream impacts to the elements available for visualization, which can impact the effectiveness of tools.
Data Science and Visualization Standards
It is a best practice to establish a community that defines and publishes visualization standards and guidelines and reviews artifacts within a specified delivery method; this is particularly vital for customer-and regulatory-facing content.
Standards may include:
- Tools standards by analytic paradigm, user community, subject area
- Requests for new data
- Data set process standard
- Processes for neutral and expert presentation to avoid biased results, and to ensure that all elements included have been done so in a fair and consistent manner including:
- Data inclusion and exclusion
- Assumptions in the models
- Statistical validity of results
- Validity of interpretation of results
- Appropriate methods applied
Data Security
Policies for handling and securing Big Data should be established and monitored.
Securely provision appropriate levels of data for authorized personnel and make subscription data accessible according to agreed-upon levels. Align services to user communities so that special services can be created to provision private data for those communities allowed to ingest it, and mask the data for others. Often organizations create policies for access to information that are not to be violated (such as no access by name, address, or phone number).
In order to secure information that is highly sensitive data will be stored using encryption techniques that obfuscate the information.
Recombination measures the ability to reconstitute sensitive or private data. This capability must be managed as part of the Big Data security practice.
This requires knowledge of the intended consumption or analysis to be performed and by what role.
Metadata
Metadata related to these data sets is critical to their successful use. Metadata needs to be carefully managed as part of data ingestion, or the data lake will quickly become a data swamp.
Metadata that characterizes the structure, content, and quality of the data, including the source and lineage of the data and the definition and intended uses of entities and data elements.
Data Quality
Data Quality is a measure of deviation from an expected result: the smaller the difference, the better the data meets expectation, and the higher the quality.
An effort needs to be made to assess quality in order to have confidence in the analysis. This can be done through an initial assessment, which is necessary to understand the data, and through that, the identification of measurements for subsequent instances of the data set. Data quality assessment will produce valuable Metadata that will be necessary input to any effort to integrate data.
Data quality toolsets offer functionality that enables an organization to test assumptions and build knowledge about its data. For example:
- Discovery: Where information resides within the data set
- Classification: What types of information are present based upon standardized patterns
- Profiling: How the data is populated and structured
- Mapping: What other data sets can be matched to these values
Metrics
Metrics are vital to any management process; they not only quantify activity, but can define the variation between what is observed and what is desired.
Technical Usage Metrics
Technical usage analysis looks for data hot spots (most frequently accessed data) in order to manage data distribution and preserve performance. Growth rates also feed into capacity planning.
Loading and Scanning Metrics
Loading and scanning metrics define the ingestion rate and interaction with the user community.
Scanning metrics should be combined with any query processing that may occur outside of the analytical processing itself. Administrative tools should be able to provide this level of reporting, as well as overall service health.
Learnings and Stories
In order to show value, the Big Data / Data Science program must measure tangible outcomes that justify the cost of developing solutions and managing process changes. Metrics can include quantification of benefits, cost prevention or avoidance, as well as length of time between initiation and realized benefits.
The outcomes of the analytics tell stories that can lead to organization re-direction, re-vitalization, and new opportunity.