Propensity Model
machine learning
supervised learning
propensity
- Propensity Model
CRIPS-DM methodology
Define principles and best practices for solving our data problems
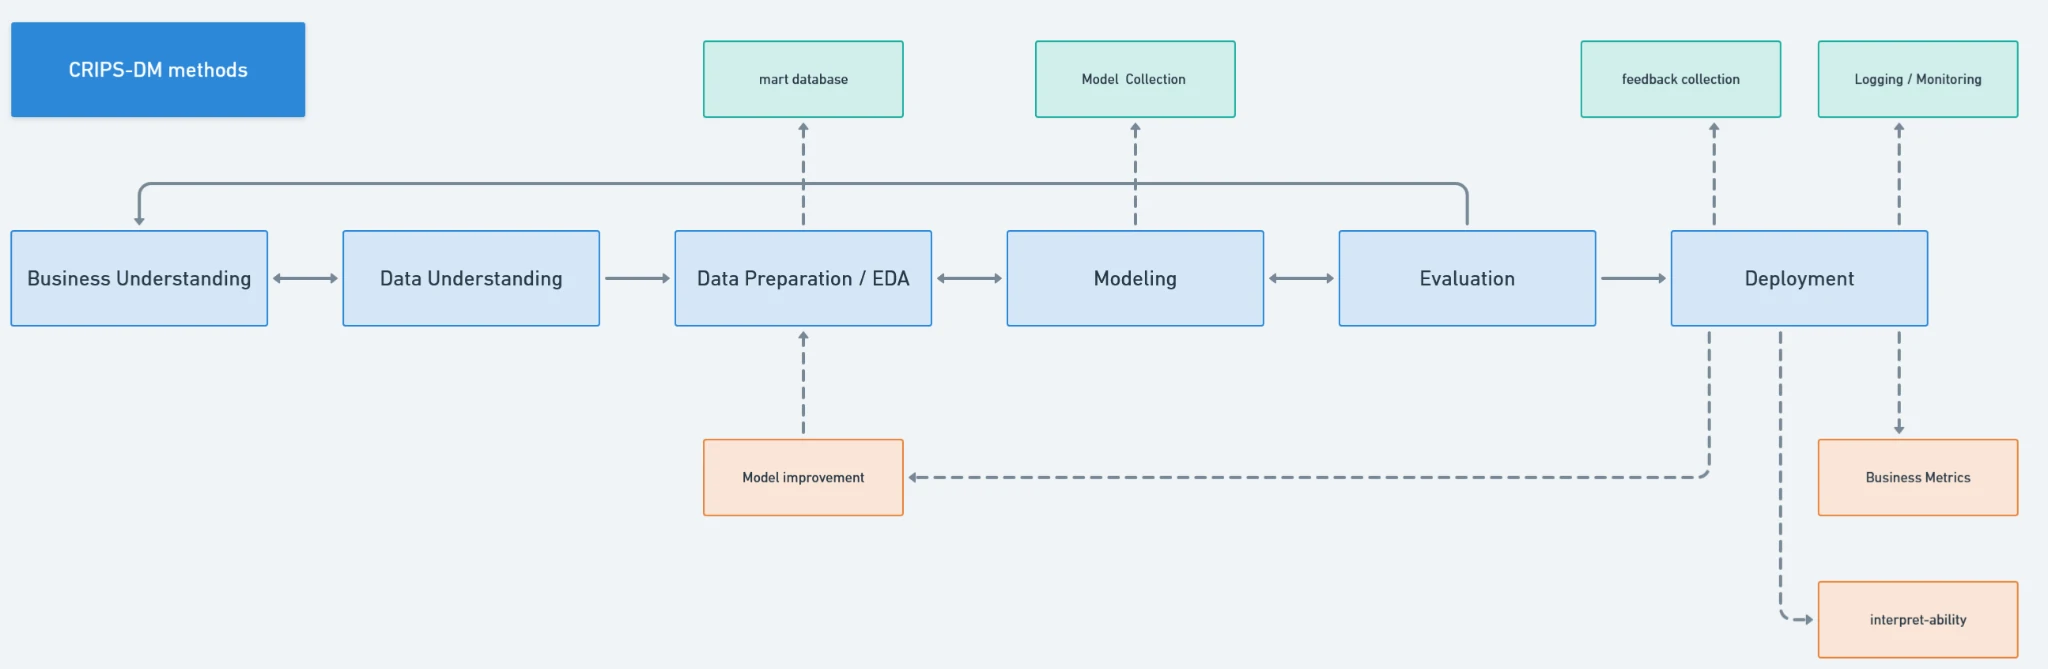
Business Understanding
Problem: Predict the likelihood that a user will make a purchase within the next xx days.
This problem could be called as propensity problem (a tendency to a particular kind of behavior), which an attempts to predict the likelihood that visitors, leads, and customers will perform certain actions in this case is an transaction within xx days.
A probabilistic estimation of whether your customers will perform any of such actions or not is called a propensity score. Equipped with these scores, you can also make an educated guess of the value each customer brings in real-time.
Characteristic
For companies to be good with predictions, propensity models have to be dynamic, scalable, and adaptive. Let’s go through these characteristics in more detail.
- Dynamic means models should be built in a way to advance with trends, adapt, and learn on new data as it becomes available.
- Scalable means they shouldn’t be created for a single-use scenario but in a way to produce a wide array of predictions.
- Adaptive means models should have a proper data pipeline for regular data ingestion, validation, and deployment to timely adjust to changes.
Tim Royston-Webb, CEO of SentryBay, offers a few reasons:
The thing is that we can’t always rely on these statistical methods in the real world. There might be several scenarios where real experiments are not possible:
- sometimes management may be unwilling to risk short-term revenue losses by assigning sales to random customers.
- a sales team earning commission-based bonuses may rebel against the randomization of leads.
- real-world experiments may be impractical and costly in certain cases when the same data or participants can be modeled through quasi-experimental procedures or when historical data is enough to produce actionable insights.
- real-world experiments may involve ethical or health issues, for example, studying the effect of certain chemicals.
Tim Royston-Webb
Data Understanding
For this objective, it’s dependent on user information data. At a minimum, this includes transaction history, behavioral and activity data, and demographic or profile attributes.
These data could come from internal and external sources. That should be considered some trade-off between them and cost-benefit.
-
Internal data - Transactional data - Logging and tracker data - User data
-
External data - 3rd party data - Governance data - Public data
Selecting features is easier when we’re interested only in a prediction. We can just add all the features we’re aware of. The less relevant the feature, the closer the coefficient / impact score will be to 0. If we’re interested in understanding the factors of that prediction, it becomes more difficult.
Whether we’re interested in interpreting the coefficients or not, one thing is certain: We’ll need to gather insight from internal experts. Despite popular belief, propensity modeling does not diminish the need for business and marketing know-how.
So, gather a room full of domain experts: email marketers, conversion optimizers, data scientists, finance experts, CRM specialists—anyone with relevant business acumen. There are numerous mathematical ways to decide which features to select, but they can’t replace human knowledge and experience.
User Information
- Transactional (actual economic behavior)
- past purchases
- Average order value (AOV)
- monetary (with or w/o limit days)
- recency
- frequency
- age-recency
- Discounts used
- Payment method
- Activity / behavior (Captures real engagement data)
- Page, Category or Product views, searches
- Login frequency
- Session duration
- Click-throughs
- Time since last activity
- Time on product page
- Checkout started
- Device type
- Demographic / profile (Users profile and their segment)
- Age and Account age
- Sex
- Location
- Target market / user categories
- Purchasing power
- Preference input (Explicit data from users)
- Keywords search
- Preference input
- Review
- Wishlist / save actions
- Add-to-cart events
- Marketing & Exposure (Controls for influence bias)
- Mail Opened / clicked
- Ad impressions
- Coupon received / redeemed
- Psychographic Information
- Personality characteristics
- Opinions
- Likes and dislikes
Item and Context Information
- Metadata item (Enables semantic matching)
- Description and image
- Quality
- Brand
- Product category
-
Category hierarchy
- Popularity (A social proof and baseline relevance data)
- Total sold and Latest sold item
- Product category affinity
- Target market
-
Promotion
- Accessibility (Users profile and their segment)
- Location
- Channel
-
Delivery constraints
- Monetary
- Price and Price sensitivity
- Margin
-
Revenue objectives
- Inventory (supports operational alignment)
- Stock availability
-
Delivery constraints
- Context (to get specific conditions)
- Time (Captures temporal patterns)
- Time-of-day / week / month effects
- Payday
- Holiday
- Season (for cyclical demand)
- Campaign / promotion
- Popular items or events
Data Preparation / EDA
Do feature engineering to give more efficient features. To give more useful information, help the models learn real behavior, and avoid amplify noise, data Preparation is crucial and mandatory foundations for both objectives.
For common feature engineering:
- Weight score
- RFM
- Categorization
- Standardization
- Grouping / Clustering
- Feature selection
- Feature importance
- PPScore
- Temporal Aggregations
- Rolling windows (7, 14, 30, 90 days)
- Decay-weighted counts
- Dimensionality reduction
- PCA, t-SNE
- Label data selection
- Multi-class vs binary-class
- Text processing
- Text vectorization
- Similarity techniques
- Euclidean distance
- Cosine, Jaccard similarity
- Pearson correlation coefficient
For specific features for recommendation system:
- Item Popularity
- Global popularity
- Trending score
- Recent sales velocity
- Conversion Ratios
- Add-to-cart ÷ views
- Purchases ÷ sessions
- Discounted purchases ÷ total purchases
- User Embeddings
- Session embeddings
- Product embeddings
- User–item interaction vectors
- Behavioral Intensity
- Product views (7 / 14 / 30 days)
- Add-to-cart count
- Checkout initiation count
- User Affinity
- Top categories viewed
- Average viewed price vs purchase price
- Brand affinity score
- Category affinity vector
- Brand preference score
- Price sensitivity
- Temporal Features
- Days since last cart action
- Time since last promo exposure
- Day-of-week / hour-of-day
Modeling
Not all propensity models are created equal. There’s no shortage of options to choose from, and none are inherently superior:
The first step is to actually pick a model because you have a few options. For example, instead of measuring propensity to churn, you could choose a survival analysis.
Regression is a good option because it’s very interpretable for non-technical audiences, which means it can be communicated easily.
It’s also less of a black box, making the risk more manageable. If something goes wrong and accuracy is low or you get an unexpected result, it’s easy to drill down to the formula and figure out how to fix it.
Mojan Hamed
First, select which variables to use as features. (e.g., what foods people eat, when they sleep, where they live, etc.).
Next, build a probabilistic model (say, a logistic regression) based on these variables to predict whether a user will start drinking Soylent or not. For example, our training set might consist of a set of people, some of whom ordered Soylent in the first week of March 2014, and we would train the classifier to model which users become the Soylent users.
The model’s probabilistic estimate that a user will start drinking Soylent is called a propensity score.
Form some number of buckets, say 10 buckets in total (one bucket covers users with a 0.0 – 0.1 propensity to take the drink, a second bucket covers users with a 0.1 – 0.2 propensity, and so on), and place people into each one.
Finally, compare the drinkers and non-drinkers within each bucket (say, by measuring their subsequent physical activity, weight, or whatever measure of health) to estimate Soylent’s causal effect.
Edwin Chen
Model types of Predict the likelihood
- Buy Till You Die (BTYD) Models
- Behavioral & Sequence-Based Models
- RFM + ML classifier
- RFM scoring
- Survival Analysis
- Time-to-Event Models
- Hazard Models
- Machine Learning
- Deep Learning
- Hybrid & Business-Oriented Models
- Rule-Based + ML Hybrid
- Customer Scoring Systems
- Markov Chain Models
- Causal & Uplift Models
The simple phases to exercise the model
- (First phase) For a single product category such as skincare, and under constrained data conditions —starting primarily with transaction data— we should start on Buy-Till-You-Die (BTYD) models. These models interpret user behavior strictly through a transactional lens, learn population-level purchase distributions, and estimate the likelihood of future purchases. RFM scoring can be layered on top to strengthen segmentation and prioritization with minimal additional data cost.
- (second phase) As data maturity increases —through the systematic capture of user profiles, behavioral data, and user–item interactions— we then advance to full propensity modeling. At this stage, implementation should shift toward hybrid, business-oriented models that combine machine learning outputs with explicit commercial rules and constraints.
Read more about Buy Till You Die (BTYD) Models in this page
Evaluation
It’s important that the propensity model works with our real-world data. This is a perfect example of how propensity modeling and experimentation go hand-in-hand. Experimentation can validate the accuracy of propensity scores.
No matter how confident we are about the accuracy, run an experiment. There could be factors we haven’t considered. Or, for example, the model may unexpectedly optimize for quantity (e.g. session-to-lead conversion rate) without considering the impact on quality (e.g. lead-to-customer conversion rate, retention, etc.)
To evaluate this project we can separate it into two phases
Before deployment / offline
- Comparing a model with benchmark
- Calculate cost and benefit
- What is the financial impact (lost) of false positives and negatives?
- What incremental revenue is generated from a true positive prediction?
- Business-Level Evaluation
- Revenue uplift @ K; how to allocate a constrained budget with the highest return.
- ROI vs random targeting
- Metrics evaluation
- Precision @ K; it focus on False Positives, to see how many actually buy?
- Recall @ K; it measures coverage of user intent.
- NDCG@K (Normalized Discounted Cumulative Gain) ; it focus on Correct items with correct order.
- Calibration Metrics (specific for Predict the likelihood)
- Brier Score; It measures accuracy of probability estimates.
- Calibration Curve (Reliability Diagram); visual diagnosis of brier score.
After deployment / online
- A/B testing
- Can be used for any step in the recommendation system lifecycle, including candidate generation, scoring or ranking.
- Can be used to test different recommendation strategies, such as popularity-based, personalized, and diversity-based, and to identify the most effective strategy for different user segments and business contexts.
- User Engagement/Business Metrics
- Click-through-rates (CTR)
- ROI measurement
- HR (hit ratio)
- Bounce Rate
Propensity modeling, like other tools, will not tell us how to optimize. We might know that a customer is highly likely to churn thanks to our propensity model. But is the value of what we spend preventing that churn higher than the lifetime value of that customer? Our model can’t answer that question—it’s not a replacement for critical thinking.
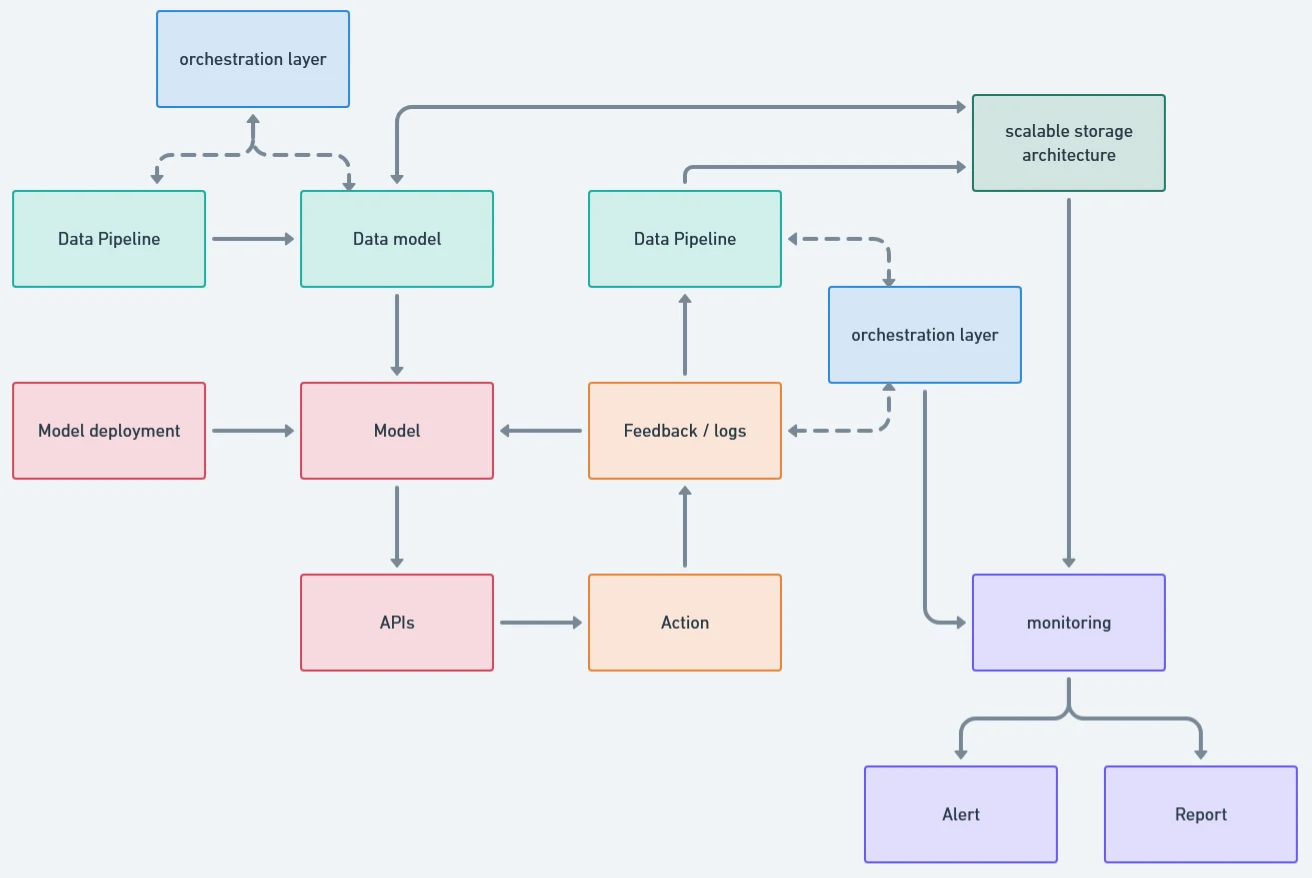
Deployment
- Design a formal data model that defines relationships, enforces standards, and creates a shared language across the system.
- The data model must be backed by a scalable storage architecture aligned with serving needs. Different workloads require different stores. (i.e. postgres - offline analytics and feature generation, redis - online inference and real-time access).
- On top of this, we need an orchestration layer to automate configuration, execution, and coordination across the system. The choice of orchestrator depends on architectural decisions, such as workflow orchestration for batch processes (e.g., Airflow) and event-driven systems for real-time data flows (e.g., Kafka).
- Model deployment should follow the same architectural discipline. Models should be containerized and deployed via cloud or hybrid infrastructure to enable repeatable CI/CD processes, versioning, and controlled rollbacks.
- To operationalize model outputs, we expose them through well-defined APIs and integrate them directly into digital touchpoints such as websites and mobile applications.
- Using Feedback Loop system, we could systematically capture user interactions, model inference outputs, and online evaluation data, then align them back into the data model, storage layer, and orchestration workflows.
- We establish monitoring and governance as first-class components. This includes technical monitoring (feature drift, model performance, latency, SLA compliance) and business monitoring (ROI, conversion uplift, and downstream impact). The objective is fast detection and decisive response, not retrospective reporting.
- All of these components should be integrated into a unified CI/CD pipeline. This is what enables scalable deployment, controlled experimentation, and sustainable maintenance as the system evolves.
Strategics takeaway
- Propensity ≠ Uplift; To maximize ROI, we should differentiate intervention strategies by propensity tier. Medium-propensity users are the primary targets for influence-based actions (e.g., discounts, coupons), while high-propensity users should be prioritized for loyalty and retention programs rather than cost-heavy incentives.
- The expected timing of the next transaction must be explicitly modeled. This requires estimating consumption or usage cycles based on how users actually use the product, not arbitrary time windows.
- This timing consideration forces a clear modeling decision: whether we are predicting the likelihood of a user purchasing any item or a specific item. This distinction is especially critical for single-category products such as skincare, where repurchase behavior is driven by usage and compatibility, not exploration.
- Model outputs must be aligned with active business. This requires close collaboration with commercial stakeholders to ensure predictions map directly to available actions such as discounts, vouchers, targeting rules, and campaign timing.
- ROI measurement should be designed upfront. We must define how to select high-impact users, measure incremental lift, calculate financial impact, and systematically feed campaign outcomes back into the modeling pipeline for continuous improvement.
The 3 most valuable propensity models for optimizers
let’s look at three valuable propensity models optimizers can leverage:
- Propensity to buy or convert. How likely are visitors, leads, and customers to make a purchase or convert to the next step of the funnel? Those who have a lower propensity score need more incentives than others (e.g. we might offer a higher discount if we’re an ecommerce store).
- Propensity to unsubscribe. How likely are recipients, leads, and customers to unsubscribe from our email lists? To those with a higher propensity score, we might try reducing the frequency of emails or sending a special offer to reinforce the value of remaining a subscriber.
- Propensity to churn. Who are our at-risk leads and customers? If they have a high propensity score, we might experiment with in-product win-back campaigns or assign account concierges to reconnect them with our core value proposition.
- Model to calculate customer lifetime value (CLV). Allows us to estimate the monetary value of purchases/transactions each customer makes during their lifetime with your business. Models can provide us with information about which acquisition campaigns produce customers with the highest CLV so we know which deserve investment.
- Propensity to engage model allows us to evaluate the propensity of your leads and customers to show proactive behavior. It may be a propensity score showing which website visitors are expected to click on an ad or which citizens will possibly vote for a given party in elections.
Propensity modeling is not prescriptive. Knowing that a group of leads has a higher propensity to convert alone is not particularly valuable. What’s valuable is combining that knowledge with optimization know-how to run smarter, more targeted experiments and extract transferable insights.