Data Quality Checklist: The Real MVP of Data Science
data government
data cleansing
A small guidance for data team to find the right data cleaning strategy 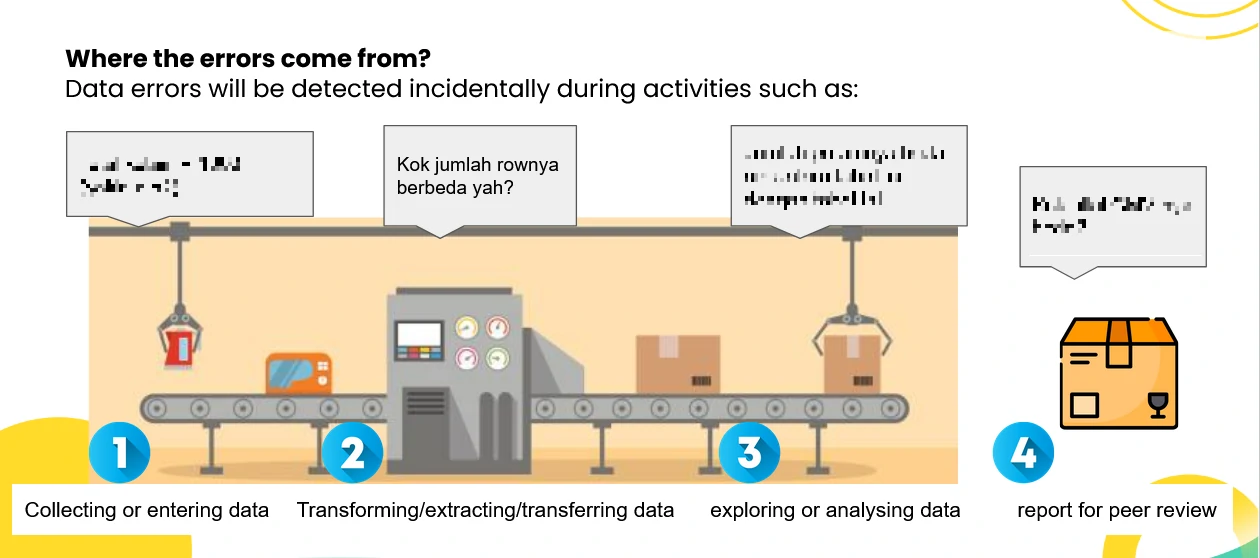
Introduction
No matter how fancy your model is or how clever your feature engineering gets, your insights are only as good as the data you start with. That’s why data quality isn’t just a checkbox, it’s the foundation of everything we do in data science.
This page breaks down a practical, go-to checklist for maintaining high data quality throughout your pipeline. Think of it as a hygiene routine for your data—skipping steps can get messy.
Data Quality: The Cornerstone
Before we even think about modeling, we need to answer: Is the data reliable? Data quality isn’t a one-time check—it’s a mindset. It’s about making sure the data is accurate, complete, consistent, timely, and relevant.
-
Validity
The degree to which the data conform to defined business rules or constraints.
- Data-Type Constraints Values in a particular column must be of a particular datatype, e.g., boolean, numeric, date, etc.
- Range Constraints Typically, numbers or dates should fall within a certain range.
- Mandatory Constraints Certain columns cannot be empty.
- Unique Constraints A field, or a combination of fields, must be unique across a dataset.
- Set-Membership Constraints Values of a column come from a set of discrete values, e.g. enum values. For example, a person’s gender may be male or female.
- Foreign-key Constraints As in relational databases, a foreign key column can’t have a value that does not exist in the referenced primary key.
- Regular expression patterns Text fields that have to be in a certain pattern. For example, phone numbers may be required to have the pattern (999) 999–9999.
- Cross-field validation Certain conditions that span across multiple fields must hold. For example, a patient’s date of discharge from the hospital cannot be earlier than the date of admission.
-
Accuracy
The degree to which the data is close to the true values or the real-world truth.
-
Completeness
The degree to which all required data is known. Missing data is going to happen for various reasons. One can mitigate this problem by questioning the original source if possible, say re-interviewing the subject.
-
Consistency
The degree to which the data is consistent, within the same data set or across multiple data sets. Inconsistency occurs when two values in the data set contradict each other.
-
Uniformity
The degree to which the data is specified using the same unit of measure.
The Workflow: Know the Flow
A good data quality workflow gives you a structured way to catch and correct issues before they snowball downstream. The workflow is a sequence of three steps aiming at producing high-quality data and taking into account all the criteria we’ve talked about.
-
Ingestion
Where is the data coming from? APIs, databases, flat files?
-
Inspection
Detect unexpected, incorrect, and inconsistent data.
-
Cleaning
Fix or remove the anomalies discovered.
-
Verifying
After cleaning, the results are inspected to verify correctness.
-
Reporting
A report about the changes made and the quality of the currently stored data is recorded. Document what’s been done and flag areas that need more eyes.
This keeps things traceable and replicable—which is critical for both collaboration and debugging.
Inspection: First Impressions Matter
Think of this as your first date with the dataset. You’re not committing yet—you’re just trying to get a feel for what you’re dealing with. Inspecting the data is time-consuming and requires using many methods for exploring the underlying data for error detection. Here are some of them:
-
Data profiling
A summary statistics about the data, called data profiling, is really helpful to give a general idea about the quality of the data.
-
Visualizations
By analyzing and visualizing the data using statistical methods such as mean, standard deviation, range, or quantiles, one can find values that are unexpected and thus erroneous.
The idea is to let the data speak to you before you start fixing it.
Cleaning: The Deep Scrub
Once you’ve done a surface inspection, it’s time to roll up your sleeves. Here’s where you fix:
-
Irrelevant data
Irrelevant data are those that are not actually needed, and don’t fit under the context of the problem we’re trying to solve. Only if you are sure that a piece of data is unimportant, you may drop it. Otherwise, explore the correlation matrix between feature variables. And even though you noticed no correlation, you should ask someone who is domain expert. You never know, a feature that seems irrelevant, could be very relevant from a domain perspective such as a clinical perspective.
-
Duplicates
Duplicates are data points that are repeated in your dataset.
-
Type conversion
Make sure numbers are stored as numerical data types. A date should be stored as a date object, or a Unix timestamp (number of seconds), and so on. Categorical values can be converted into and from numbers if needed.
-
Syntax errors
- Remove white spaces: Extra white spaces at the beginning or the end of a string should be removed.
- Pad strings: Strings can be padded with spaces or other characters to a certain width.
- Fix typos: Strings can be entered in many different ways, and no wonder, can have mistakes.
- The first solution is to manually map each value to either “male” or “female”.
- The second solution is to use pattern match.
- The third solution is to use fuzzy matching: An algorithm that identifies the distance between the expected string(s) and each of the given one.
-
Standardize
Our duty is to not only recognize the typos but also put each value in the same standardized format.
- For strings, make sure all values are either in lower or upper case.
- For numerical values, make sure all values have a certain measurement unit.
-
Scaling / Transformation
Scaling means to transform your data so that it fits within a specific scale.
-
Normalization
While normalization also re-scales the values into a range of 0–1, the intention here is to transform the data so that it is normally distributed.
In most cases, we normalize the data if we’re going to be using statistical methods that rely on normally distributed data.
-
Missing values
Given the fact the missing values are unavoidable leaves us with the question of what to do when we encounter them. Missing values are not “unknown”.
- Drop
- If the missing values in a column rarely happen and occur at random, then the easiest and most forward solution is to drop observations (rows) that have missing values.
- If most of the column’s values are missing, and occur at random, then a typical decision is to drop the whole column.
- Impute It means to calculate the missing value based on other observations.
- Using statistical values like mean, median.
- Using a linear regression. It is worth mentioning that linear regression models are sensitive to outliers.
- Using Hot-deck: Copying values from other similar records.
- Take the random approach where we fill in the missing value with a random value.
- In sequential hot-deck imputation, the column containing missing values is sorted according to auxiliary variable(s) so that records that have similar auxiliaries occur sequentially. Next, each missing value is filled in with the value of the first following available record.
- using 𝑘 nearest neighbour imputation. which classifies similar records and put them together, can also be utilized. A missing value is then filled out by finding first the 𝑘 records closest to the record with missing values. Next, a value is chosen from (or computed out of) the 𝑘 nearest neighbours.
- Flag Some argue that filling in the missing values leads to a loss in information, no matter what imputation method we used. That’s because saying that the data is missing is informative in itself, and the algorithm should know about it.
This is particularly important when the missing data doesn’t happen at random. Take for example a conducted survey where most people from a specific race refuse to answer a certain question.
- Drop
-
Outliers
They are values that are significantly different from all other observations.
Outliers are innocent until proven guilty. With that being said, they should not be removed unless there is a good reason for that.
It is also worth mentioning that some models, like linear regression, are very sensitive to outliers. In other words, outliers might throw the model off from where most of the data lie.
-
In-record & cross-datasets errors
These errors result from having two or more values in the same row or across datasets that contradict with each other.
A tip: Always log your cleaning steps. One small change today could create big confusion tomorrow.
Verifying: Trust, But Verify
You cleaned the data—great. But how do you know you didn’t break anything or introduce bias?
When done, one should verify correctness by re-inspecting the data and making sure it rules and constraints do hold. For example, after filling out the missing data, they might violate any of the rules and constraints.
Verification is about re-checking:
- Row counts (pre vs. post cleaning)
- Nulls (expected vs. unexpected)
- Distribution shifts (especially after imputation)
- Relationships between variables (did cleaning break correlation logic?)
We want to make sure our cleaning helped the model, not sabotaged it.
Reporting: Keep the Trail
Don’t let your data prep process become a black box. Reporting what you did (and why) is crucial for:
- Reproducibility
- Team transparency
- Audits and compliance
- Model debugging later
Even a simple markdown log or an automatically generated cleaning summary can go a long way. If you’re using tools like Jupyter Notebooks or Streamlit, bake it right into your notebook/app.
Good data quality isn’t glamorous, but it’s essential. Think of this checklist as your “seatbelt” before you hit the modeling highway. Data scientists spend a lot of time in this space—and for good reason. Skipping these steps is like building a house on a cracked foundation.
So next time you’re eager to train a model, pause and ask:
Is this data even ready to be trusted?
Chances are, your future self (and your team) will thank you for asking.