Covering radius
geospatial
map
polygon
How to cover geometry map by using circle polygon. 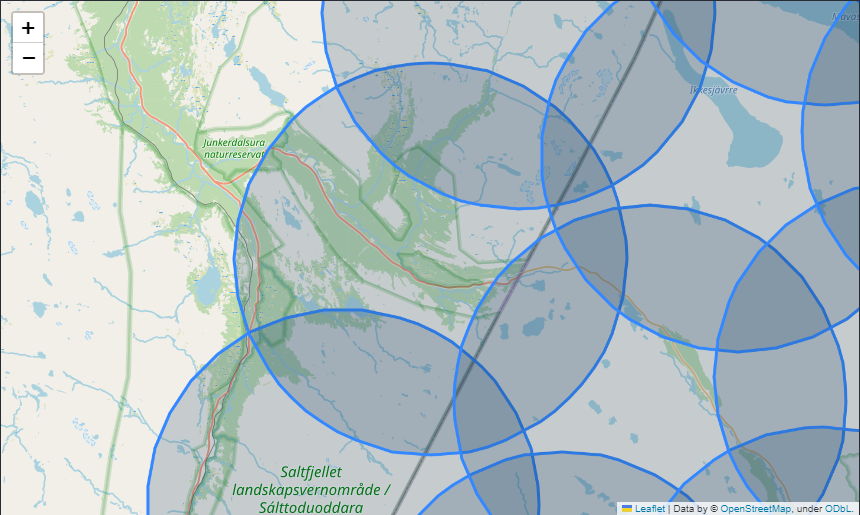
Introduction
In geospatial analysis, efficiently covering a given area with minimal circular regions is a powerful method for obtaining localized information, especially when querying services like the Google Maps API, which often limits searches to a specific radius. This approach, known as the Covering Radius Method, involves dividing a geometry (such as a polygon representing a city or region) into overlapping circles of a defined radius.
The primary objective of this method is to ensure complete coverage of the target geometry while minimizing redundant overlaps. This technique is particularly useful for applications like retrieving nearby places, analyzing service coverage, or assessing accessibility within a fixed radius. By transforming complex geometries into a series of circles, this method simplifies data collection and improves the efficiency of API requests.
Dataset
Load dataset
First, we load a built-in dataset named naturalearth_lowres (meaning Natural Earth - Low Resolution
).
The world dataframe has six columns:
- pop_est: Estimated population of the country
- continent: Name of the continent the country belongs to
- name: Human-readable name of the country
- iso_a3: Standardized ISO 3166-1 alpha-3 code used as an abbreviated way to represent the country (e.g,. “United States of America” is “USA”, “Tanzania” is “TZA”, etc.)
- gdp_md_est: Gross Domestic Product (GDP) in millions of dollars
- geometry: A polygon of points/coordinates used to represent the country on a map
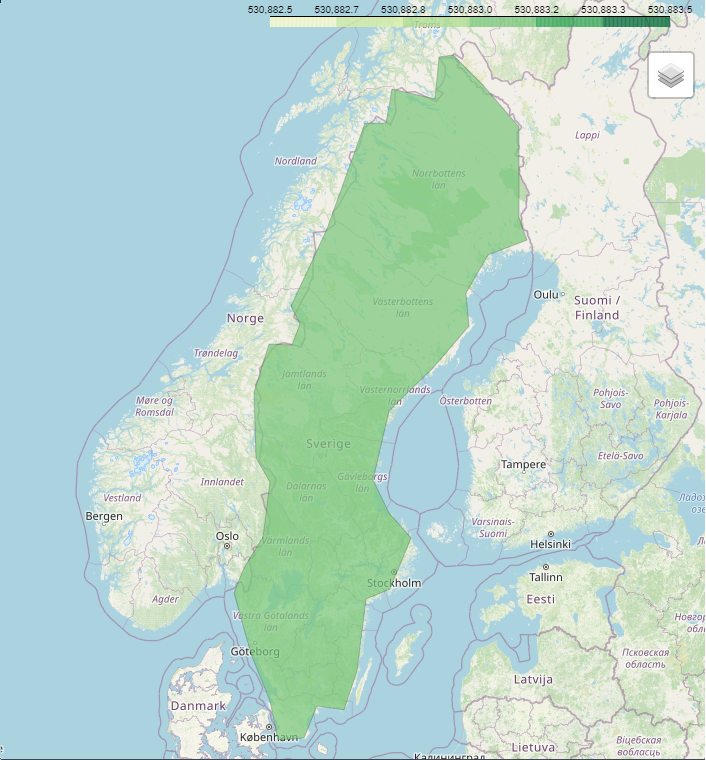
The geometry column is the data we are specifically interested in here, as it will allow us to plot each of the countries with Python. for this project, we only select sweden as our dataset.
Load Polygon data
world = gpd.read_file(gpd.datasets.get_path('naturalearth_lowres'))
sweden = world[world.name == "Sweden"]
| pop_est | continent | … | name | iso_a3 | gdp_md_est | geometry | |
|---|---|---|---|---|---|---|---|
| 110 | 1.02855e+07 | Europe | … | Sweden | SWE | 530883 | POLYGON ((11.027368605196868 58.85614940045936, 11.468271925511146 59.43239329694604, |
The Code
By calling maps.radius_covering, we can convert geometry from specific dataset into a hexagonal grid.
result = maps.radius_covering(main_data, radius_meter: float, meter_crs= 'EPSG:3857', deg_crs='EPSG:4326')
This function requires the following parameters:
- main_data (
geodataframe): Data location and value - radius_meter (
float): radius cycle in Kilometer - meter_crs (
string): crs with meter unit for specific area - deg_crs (
string): crs with degree unit for specific area
The result
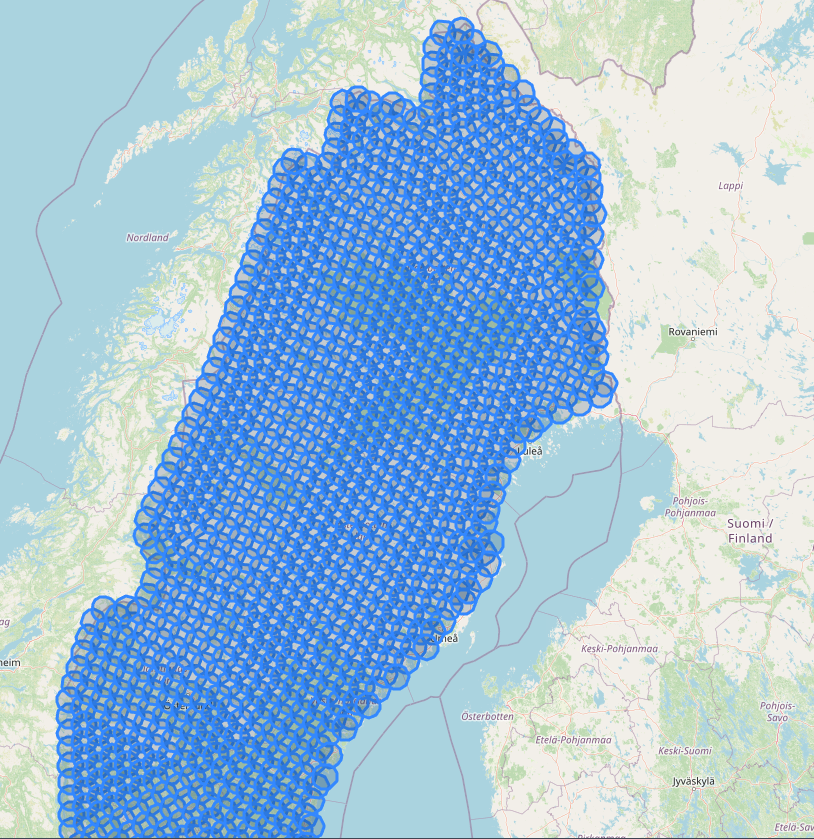
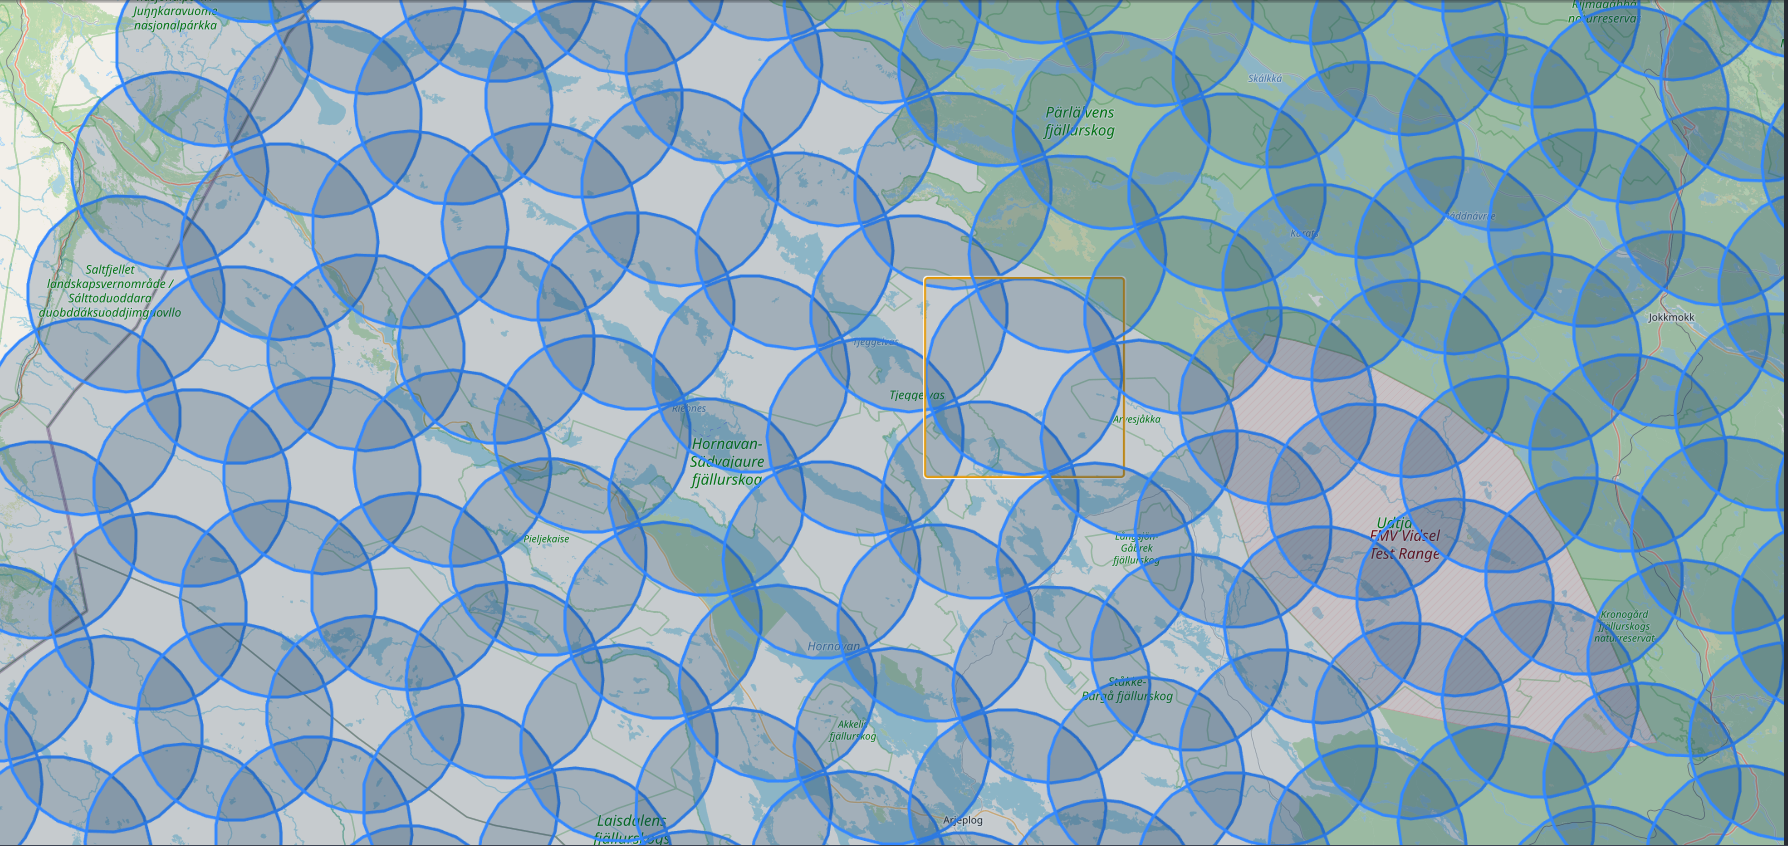
Using the Covering Radius Method, we successfully divided the target geometry into overlapping circles of radius radius_meter. The results demonstrate that:
- Complete Coverage: The entire geometry was covered without any gaps, ensuring no area of interest was missed.
- Efficiency: The optimal radius and circle placement minimized the number of required API queries, reducing computational costs and response times.
- Practicality: This method enables seamless integration with Google Maps API, making it easy to retrieve information within defined circular regions.
For example, when applied to a sample city boundary, the method used a grid-based approach to generate circle centers. These centers effectively covered the polygon, with minimal overlap and consistent radial distance. The results provide a reliable framework for localized data retrieval, highlighting the practicality of this technique in real-world scenarios like mapping service availability, identifying nearby points of interest, and traffic monitoring.
in table
| center | center_long_lat | squares | circles | lon | lat | |
|---|---|---|---|---|---|---|
| 0 | POINT (1238101.681472456 8148845.876001142) | POINT (11.122056637607866 58.85376072431134) | POLYGON ((11.391551222843722 58.99286952381171, 11.391551222843722 58.71409080780764, | POLYGON ((11.391551222843722 58.85376072431134, 11.39025353275545 58.84009550581631, | 11.1221 | 58.8538 |
| 1 | POINT (1249015.6236865036 8110381.1441477565) | POINT (11.220098248616628 58.67458016662106) | POLYGON ((11.489592833852484 58.81440866562472, 11.489592833852484 58.534188718474994, | POLYGON ((11.489592833852484 58.67458016662106, 11.488295143764212 58.660844306488954, | 11.2201 | 58.6746 |
| 2 | POINT (1252706.8417692117 8186065.093529956) | POINT (11.253257024823778 59.026261146405936) | POLYGON ((11.522751610059634 59.16467580026071, 11.522751610059634 58.88728716012128, | POLYGON ((11.522751610059634 59.026261146405936, 11.52145391997136 59.01266406226261, | 11.3181 | 58.4945 |
| 3 | POINT (1267312.0020659673 8223284.311058771) | POINT (11.384457412039689 59.19790065064811) | POLYGON ((11.653951997275545 59.33562338545606, 11.653951997275545 59.05962037920574, | POLYGON ((11.653951997275545 59.19790065064811, 11.652654307187273 59.1843714832111, | 11.3845 | 59.1979 |
in image