Water Extraction and Change Detection
arcgispro
geospatial
map
esri
In this project, we will solve combine cases that will help us to identify flooded areas. Flooding is one of the most frequent and costly types of natural disasters. Flood mapping is traditionally performed using local aerial observations or ground surveys. However, when flooding is widespread, these methods become prohibitively expensive and time-consuming.
Moreover, aerial observation can be challenging or impossible due to obstructive weather conditions. During flooding events, thick clouds can also prevent the use of optical satellite imagery for visualization and analysis. In such cases, synthetic aperture radar (SAR) satellite imagery is valuable, since it can penetrate through clouds and hazy atmospheric conditions, allowing continuous observation and mapping of floods.
Study case scenario
In the Spring of 2019, severe flooding, referred to as the Great Flood of 2019, impacted 14 million people across multiple states in the Midwest of the United States. The St. Louis, Missouri, region experienced significant flooding. In this tutorial, as an image analyst for the disaster management regional agency, we are as a GIS engineer tasked with mapping the flood and calculate impacted area.
Workflows
This case can be solved by using ArcGIS PRO combine with Sentinel-1 SAR satellite imagery. By using pretrained deep learning model to extracting water area and comparing pre and post flood satellite imagery, we can make a change detection data and calculate impacted area in KM meter square by the flood. SAR satellite imagery comes from Satellites with SAR sensors produce images based on radar technology. One of SAR’s strengths is that it can create clear images in both daytime and nighttime and regardless of the presence of clouds, smoke, or rain. This makes SAR imagery a very good choice to map a flood.
The Dataset
For that purpose, we need some data as follow:
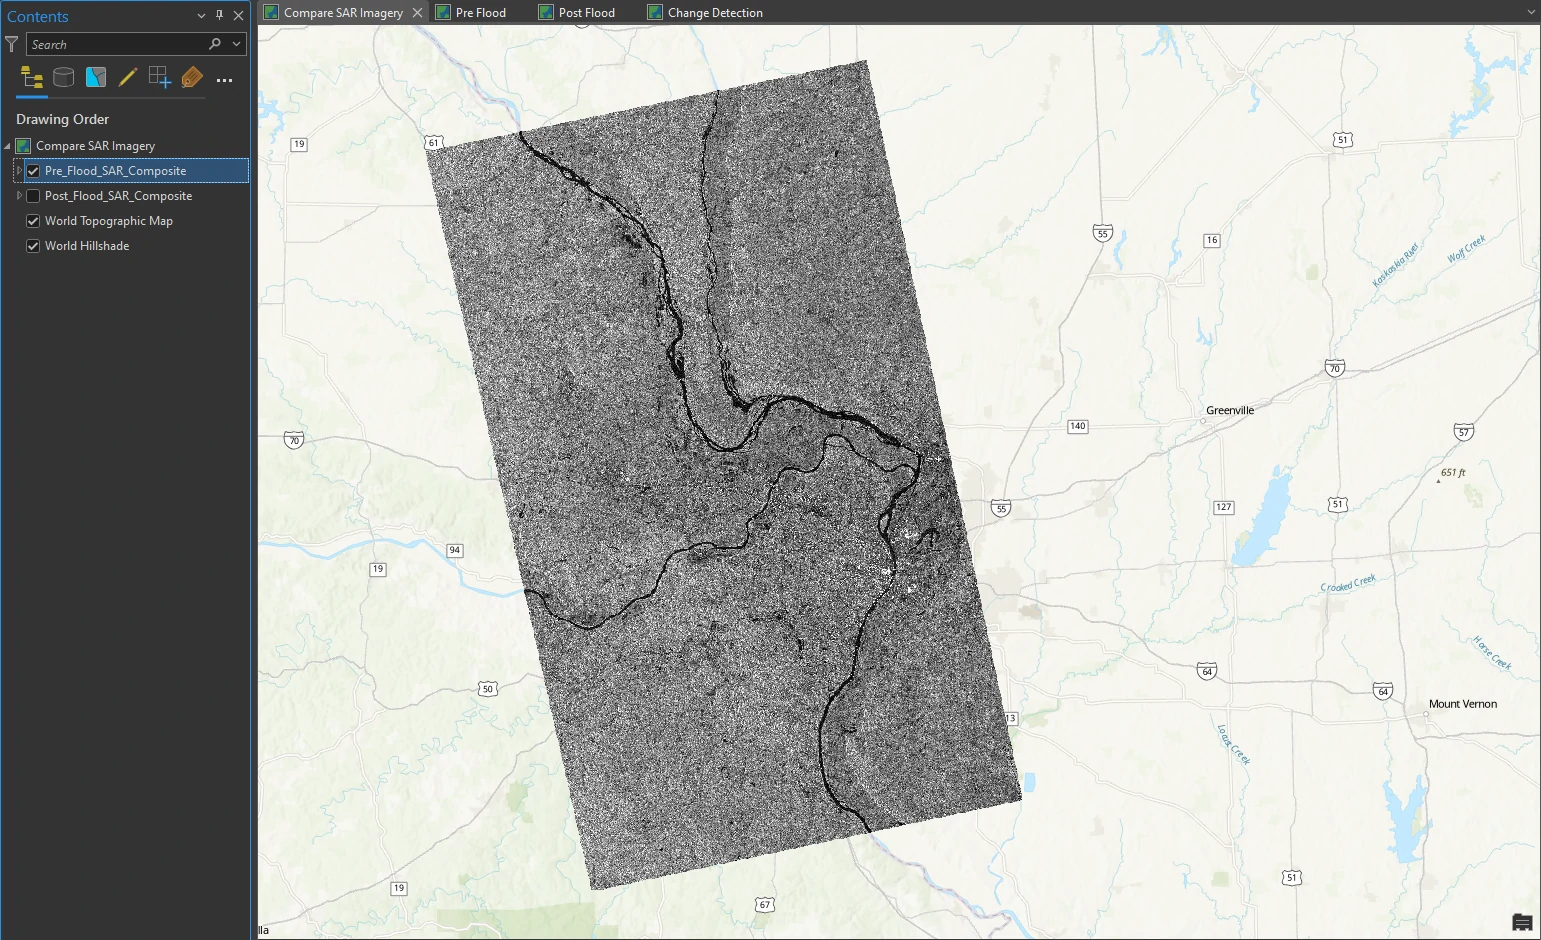
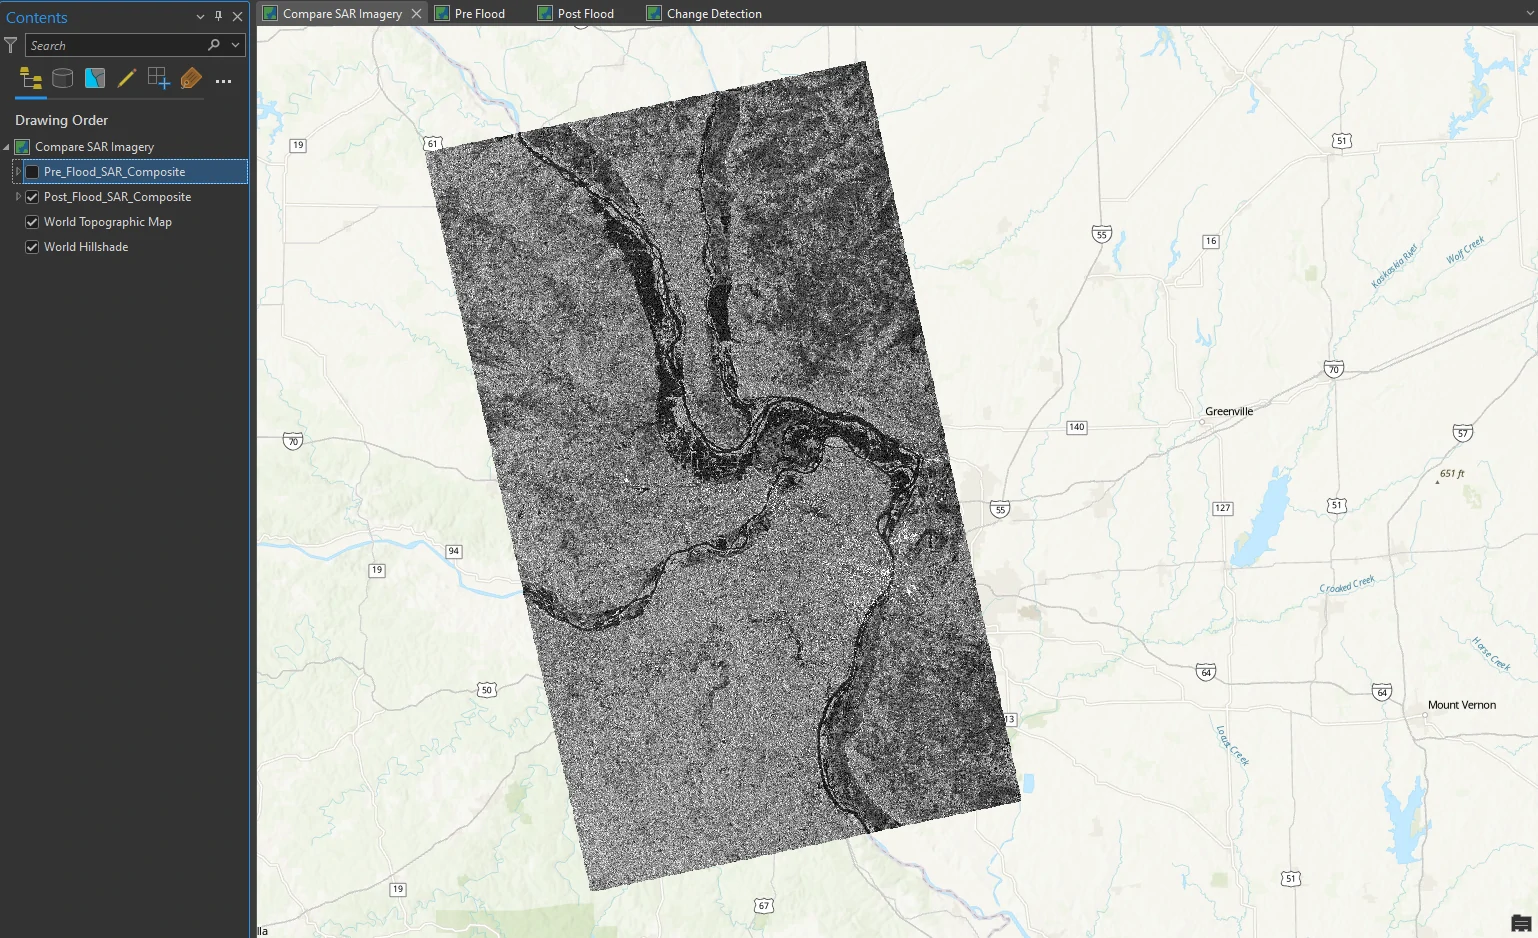
Sentinel-1 GRD SARsatellite imagery for pre and post flood in St. Louis, Missouri region. These two maps were derived from Sentinel-1 GRD SAR imagery captured on February 23 and June 11, 2019. Satellites with SAR sensors produce images based on radar technology. One of SAR’s strengths is that it can create clear images in both daytime and nighttime and regardless of the presence of clouds, smoke, or rain. This makes SAR imagery a very good choice to map a flood. sourceWater Body Extraction (SAR) - USAThis is aTrasfer Learning Modelthat trained on manually classified training dataset. Labels were created by using Sentinel-1 C band SAR GRD VH polarization imagery using histogram based thresholding method. The training data use SAR remote sensing data, which is a powerful imagery for information extraction, as it is unaffected by cloud cover, acquires images overnight, enables all-weather imaging, and it is cost effective compared to other imageries. This deep learning model can be used to automate the task of extracting water bodies from SAR imagery. source
To get Sentinel-1 GRD SAR satellite imagery, we can use one of the websites where we can download Sentinel-1 GRD data for any location on earth for free is the ASF Data Search Vertex website. This process need some parameters such as:
- Search Type = Geographic Search
- Dataset = Sentinel-1
- Manually select area of interest
- Filter window time by using Start Date and End Date
- Additional Filters
- File Type = L1 Detected High-Res Dual-Pol (GRD-HD)
- Beam Mode = IW
- Polarization = VV+VH
- Direction = Ascending
After we download the data, we need to preprocessing this data first before we continue to next process. Some preprocessing methods that we can apply such as:
- Apply orbit and geometric terrain correction No matter how fine-tuned a satellite’s orbit may be, the location of the satellite will drift due to gravitational influences and other factors. Up-to-date orbital files give the precise location of the satellite at the time the image was captured. This issue can be solved by
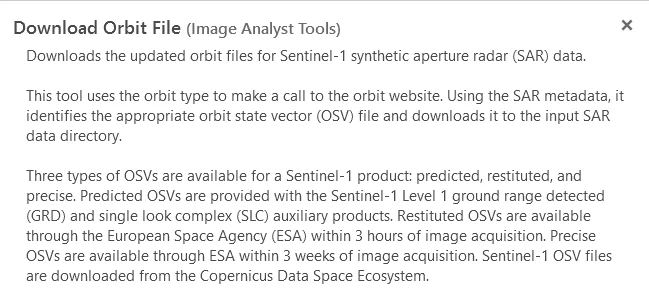
Download Orbit File,Apply Orbit Correction, andApply Geometric Terrain Correctiontools, and needs some params such as:- For
Download Orbit File- Input Radar Data
- Orbit Type = Sentinel Precise
- Authentication and Data Store = Username and Password are left empty
- For
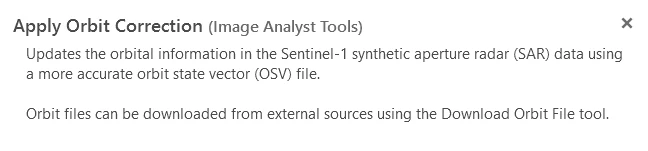
Apply Orbit Correction- Input Radar Data
- Input Orbit File parameter populates automatically with the orbit file we downloaded.
- For
Apply Orbit Correction- Input Radar Data
- Confirm that Output Radar Data is automatically populated.
- Polarization Bands = the VV and VH boxes
- DEM Raster = DEM.tif
Apply Geometric Terrain Correctionor Orthorectification is the process of correcting apparent changes in the position of ground objects caused by the perspective of the sensor view angle and variations in elevation on the ground. This process uses a digital elevation model (DEM) layer.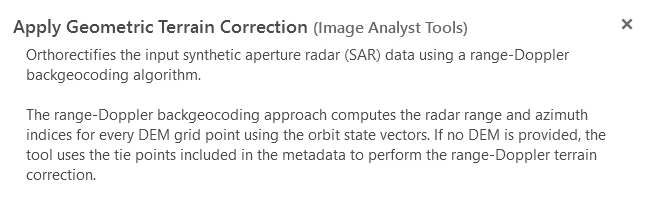
- For
- Create a 3-band composite and clip it Next, we’ll continue to prepare the data by deriving a 3-band composite raster and clipping it to match our exact area of interest. When using a
deep learning pretrained model, we need to provide it with input that is similar to the data it was trained on. As we can read in theWater Body Extraction (SAR) - USA pretrained modeldocumentation, the input expected is an 8-bit, 3-band Sentinel-1 C band SAR GRD VH polarization band raster. This means:- The input raster needs to have an 8-bit (unsigned - with range 0 to 255) pixel depth.
- The input raster should be composed of three bands, each one containing a copy of the VH (horizontally polarized waves) polarization band which is typically a good choice to detect water.
By default, our original Sentinel-1 dataset has a 16-bit unsigned pixel depth and it contains two polarization bands, VH and VV (check at
Properties->Source). To get match parameter for our dataset and the model, we’ll derive an 8-bit 3-band composite using theExtract Bands rasterfunction.- Raster Functions
- Extract Bands on the Parameters tab, set the following parameters:
- Raster input
- Method = Band Names
- Band = VH three times
- The Combination parameter will automatically populate with the expression VH VH VH. on General tab, set the following parameters:
- Name = Raster input dataset
- Output Pixel Type = 8 Bit Unsigned
- Extract Bands on the Parameters tab, set the following parameters:
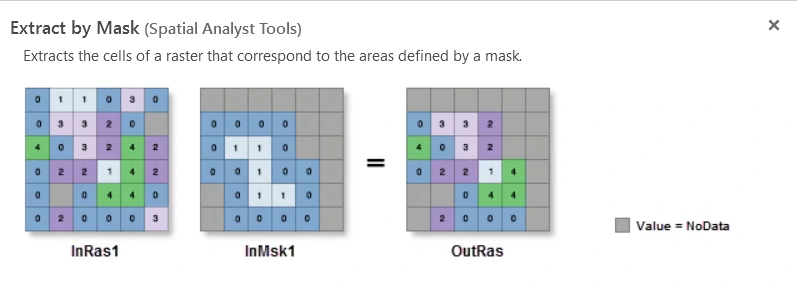
Finally we will clip our dataset to match exact area of interest using the
Extract by Masktool. For theExtract by Masktool, set the following parameters:- Input raster = from previous step
- Analysis Extent = Draw extent, we will manually draw our specific extent of interest and this process will automatically populate Input raster or feature mask data with Extract by Mask Analysis Extent
- Output Coordinate System = WGS 1984 UTM Zone 15N (specificaly for this area)
Pre-flood
Post-flood
Water Extraction Process
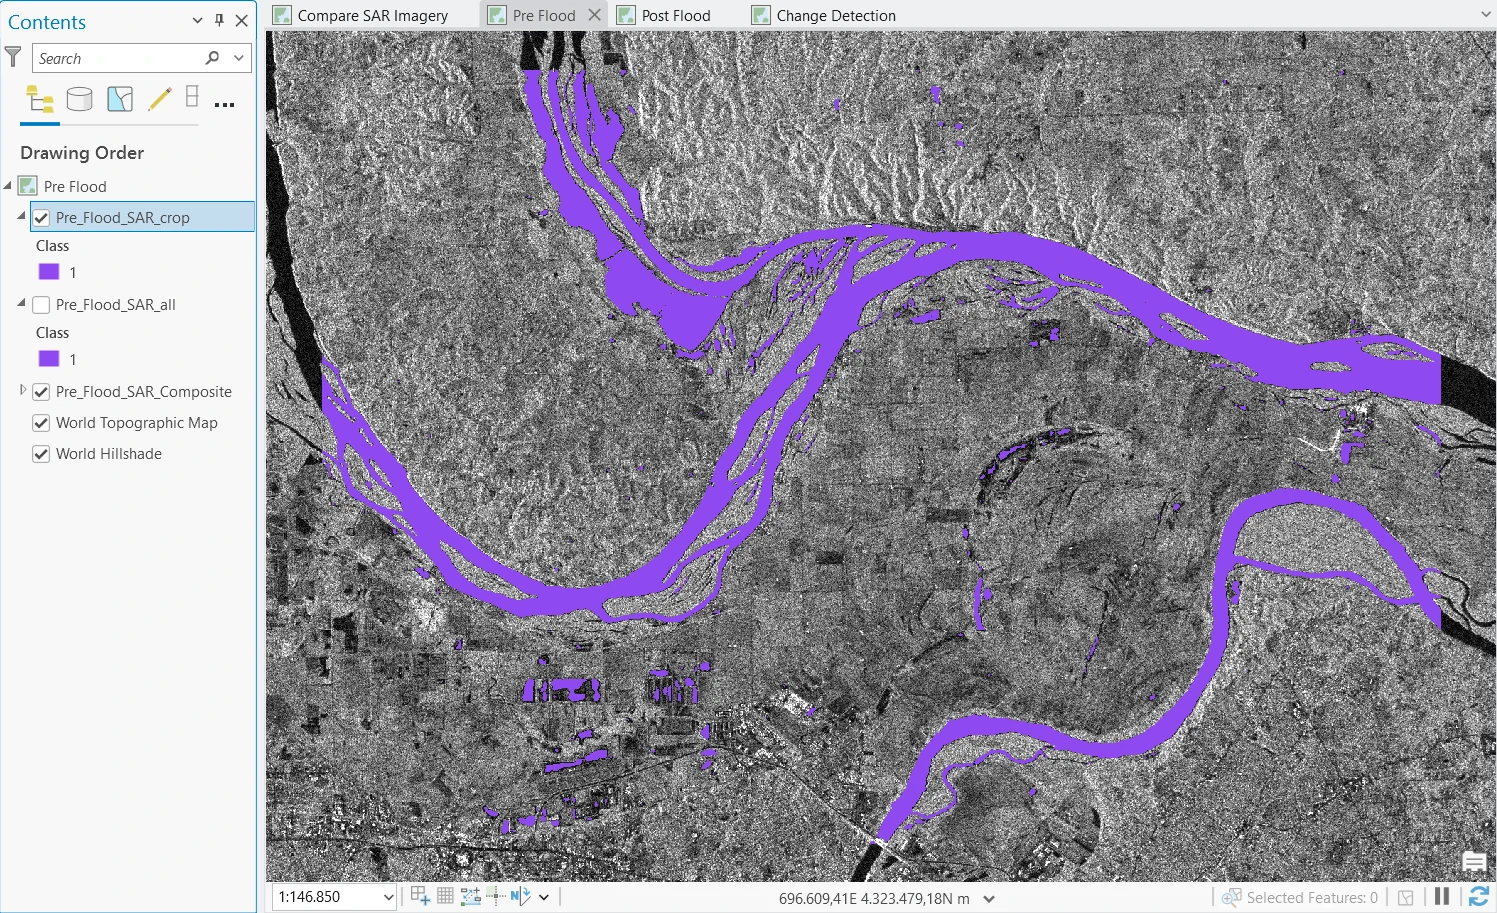
First, we will extract water pixels from both pre- and post-flood maps. In some cases the accuracy of the extraction process varies depending on the extracted area. We can utilize Classify Pixels Using Deep Learning tool from Geoprocessing pane. By this tool, we will set parameters as follow:
- Input Raster = Pre_Flood_SAR_Composite.
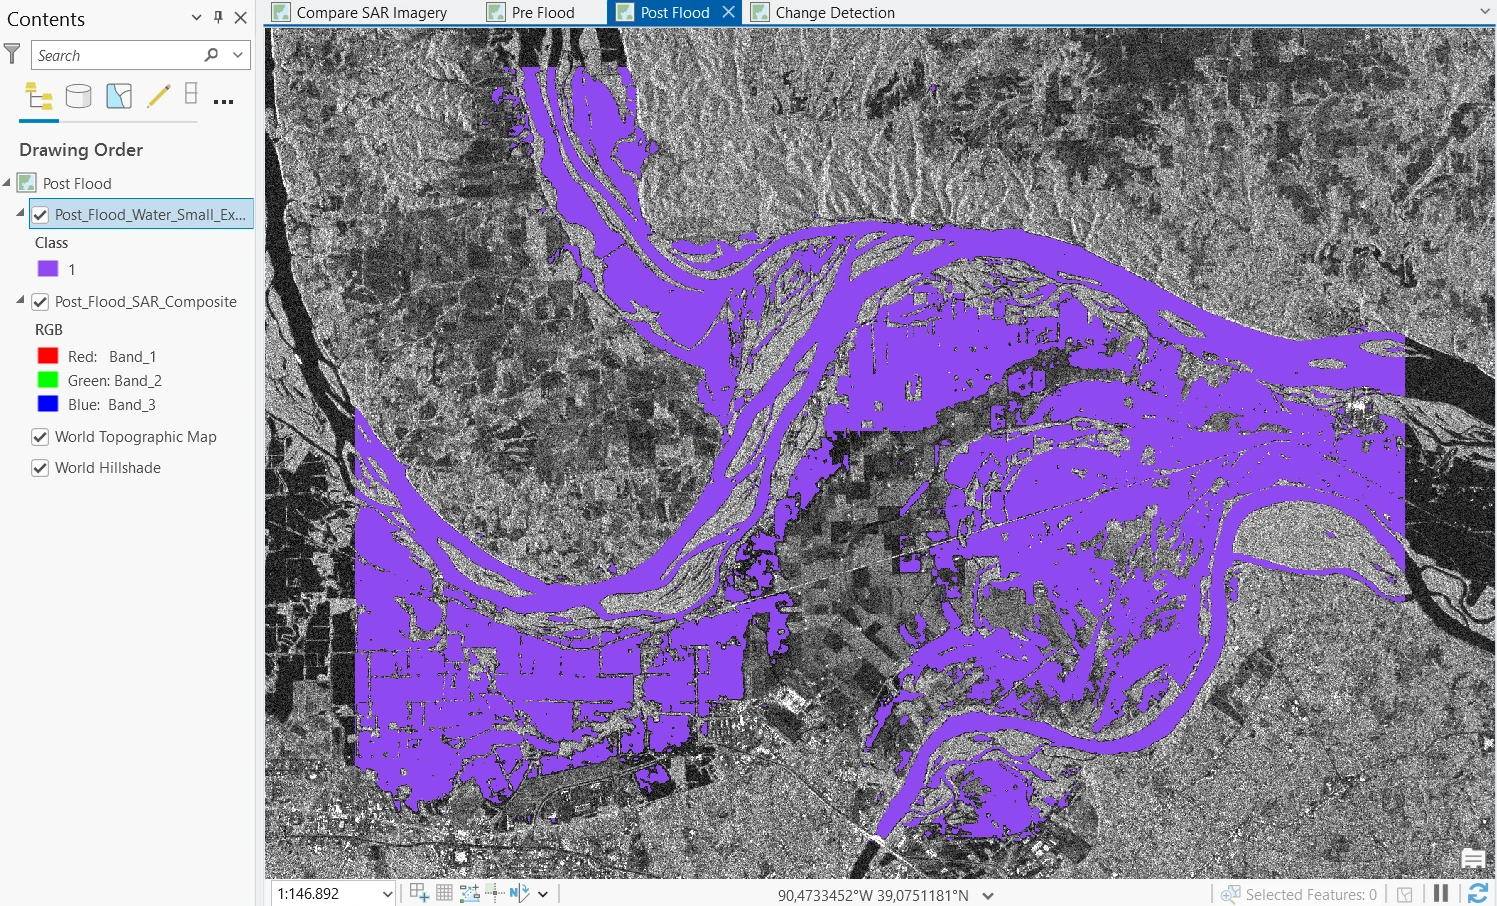
- Output Raster Dataset = Pre_Flood_Water_Small_Extent
- Model Definition = Water Body Extraction (SAR) - USA model
- batch_size = 4 or lower
- test_time_augmentation = True
- Extent = Current Display Extent or Intersection of Inputs (for all layer).
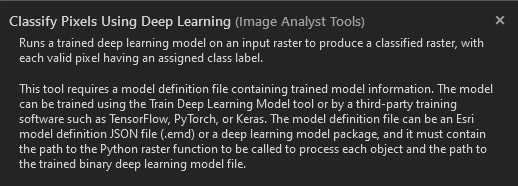
Deep learning pixel classification cannot be performed on the entire image at one time. Instead, the tool will cut the image into small pieces known as chips. A batch size of 4 means that the tool will process four image chips at a time. By decreasing the batch_size value, we will decreasing time processing and chips image that will calculate by model. Changing the batch_size value will not affect the quality of the results, only the efficiency of the model’s classification process.
Data augmentation is a technique to generate multiple versions of image chips by flipping and rotating them and the resulting predictions will be merged into the final output.
The Result will be shown at the below image.
The Change Detection Process
The output of Water Extraction process only give data with label 1 as detected water. To get Change Detection between these rasters, we need assign non-water area with a value (e.g. 0 - zero). Thus, to do that we will apply Equal to tool before we calculate Change Detection.
Equal to tool needs some params such as:
- Input raster or constant value 1 = Pre_Flood_Water
- Input raster or constant value 2 = 1
- Output raster = Pre_Flood_Binary
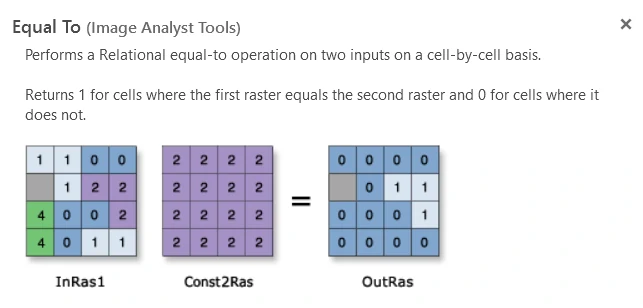
For each pixel, the tool will return 1 if Input raster or constant value 1 is equal to Input raster or constant value 2, and 0 otherwise.
Next, we will use Change Detection Wizard tool to compute change detection between these rasters. The detail of change detection can read in this page. However, in this case we have 2 rasters with binary (0 and 1) or categories values. So we have difference setting to handle this condition.
For this tool, we will set parameters as follow:
- Detection Method = Categorical Change
- From Raster = Pre_Flood_Binary
- To Raster = Post_Flood_Binary
- Filter Method = Changed Only
- From Classes = 0
- To Classes = 1
- Save Result as = Raster Dataset or Feature Classes.
Categorical Change method will compute change betwen two thematic rasters. Quantify and explore the pixels that changed or remained unchanged. the parameter at From Classes and To Classes will select only raster region that change from 0 (non-water) to 1 (water).
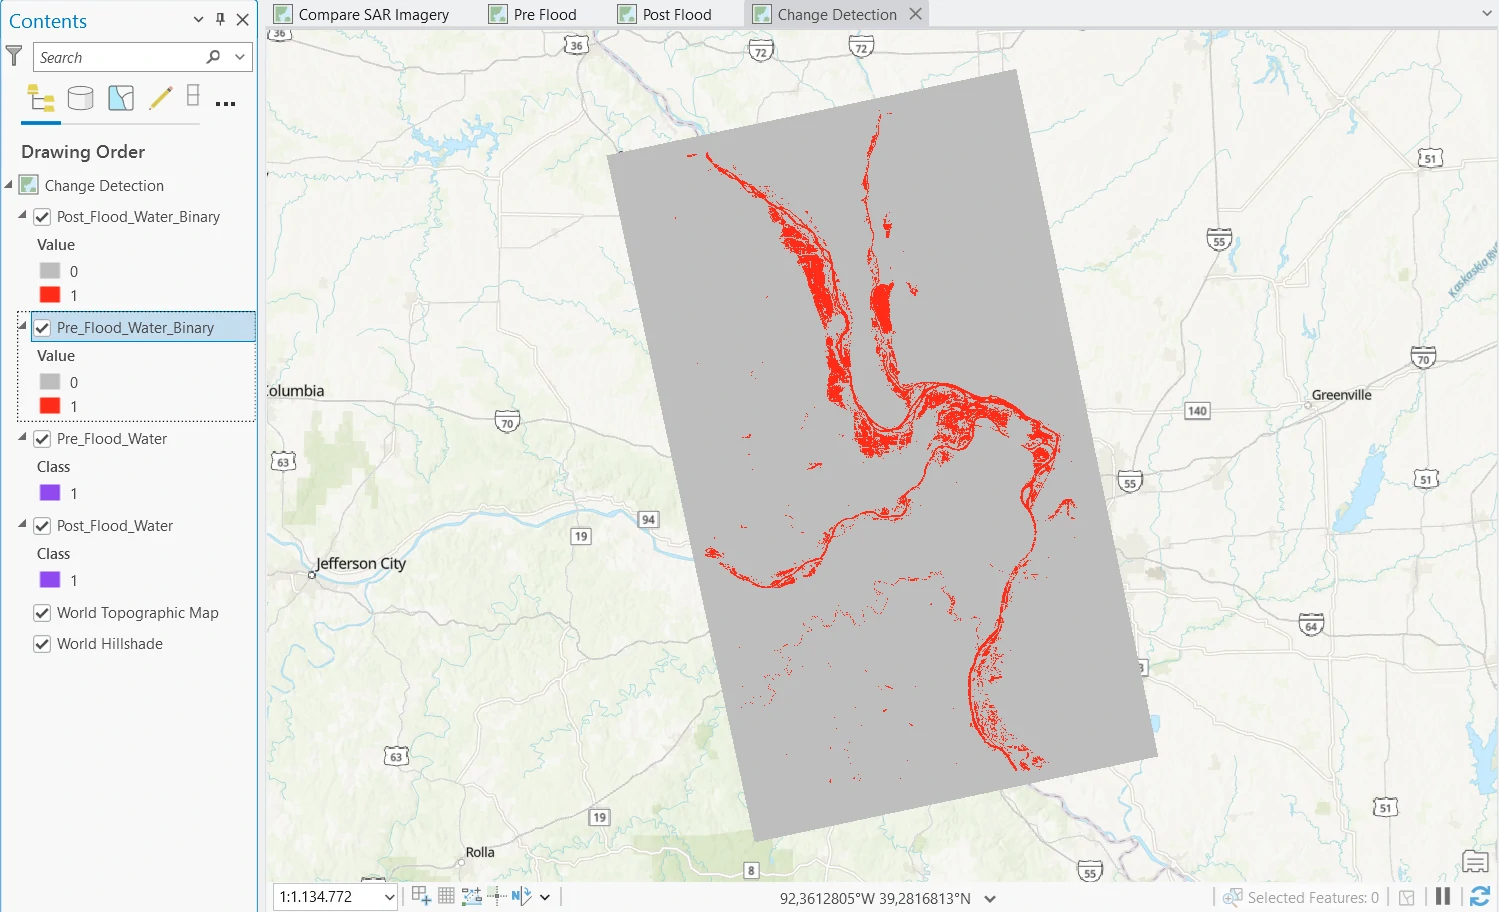
The result of this process can be shown at below images.
In Feature Classes format
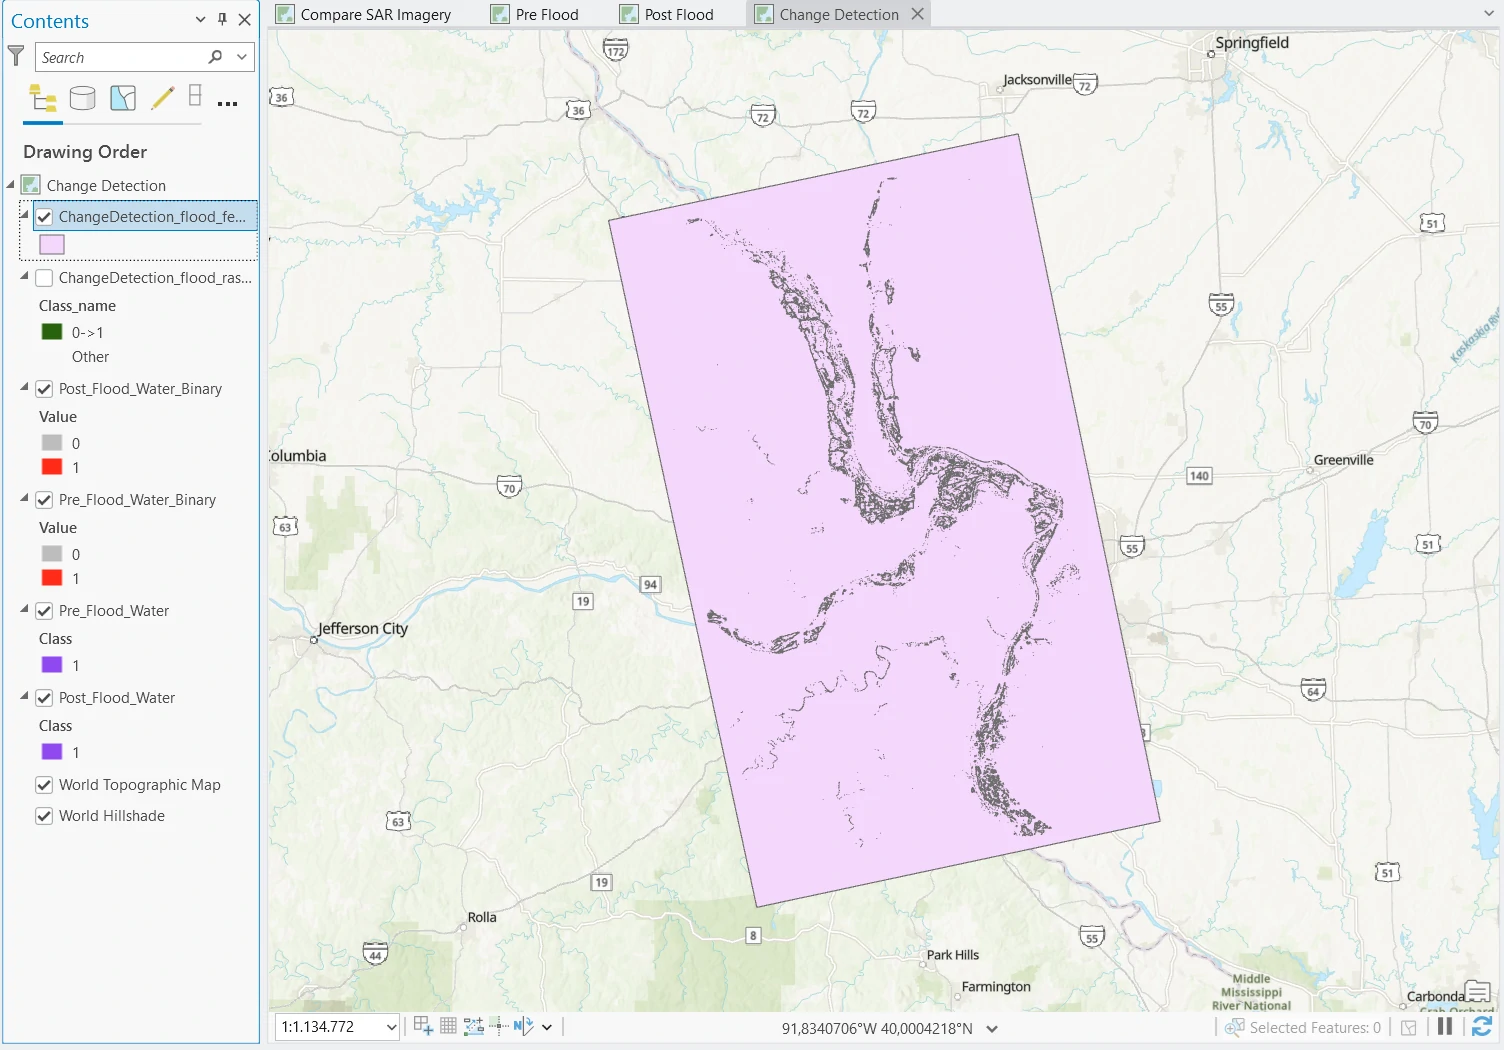
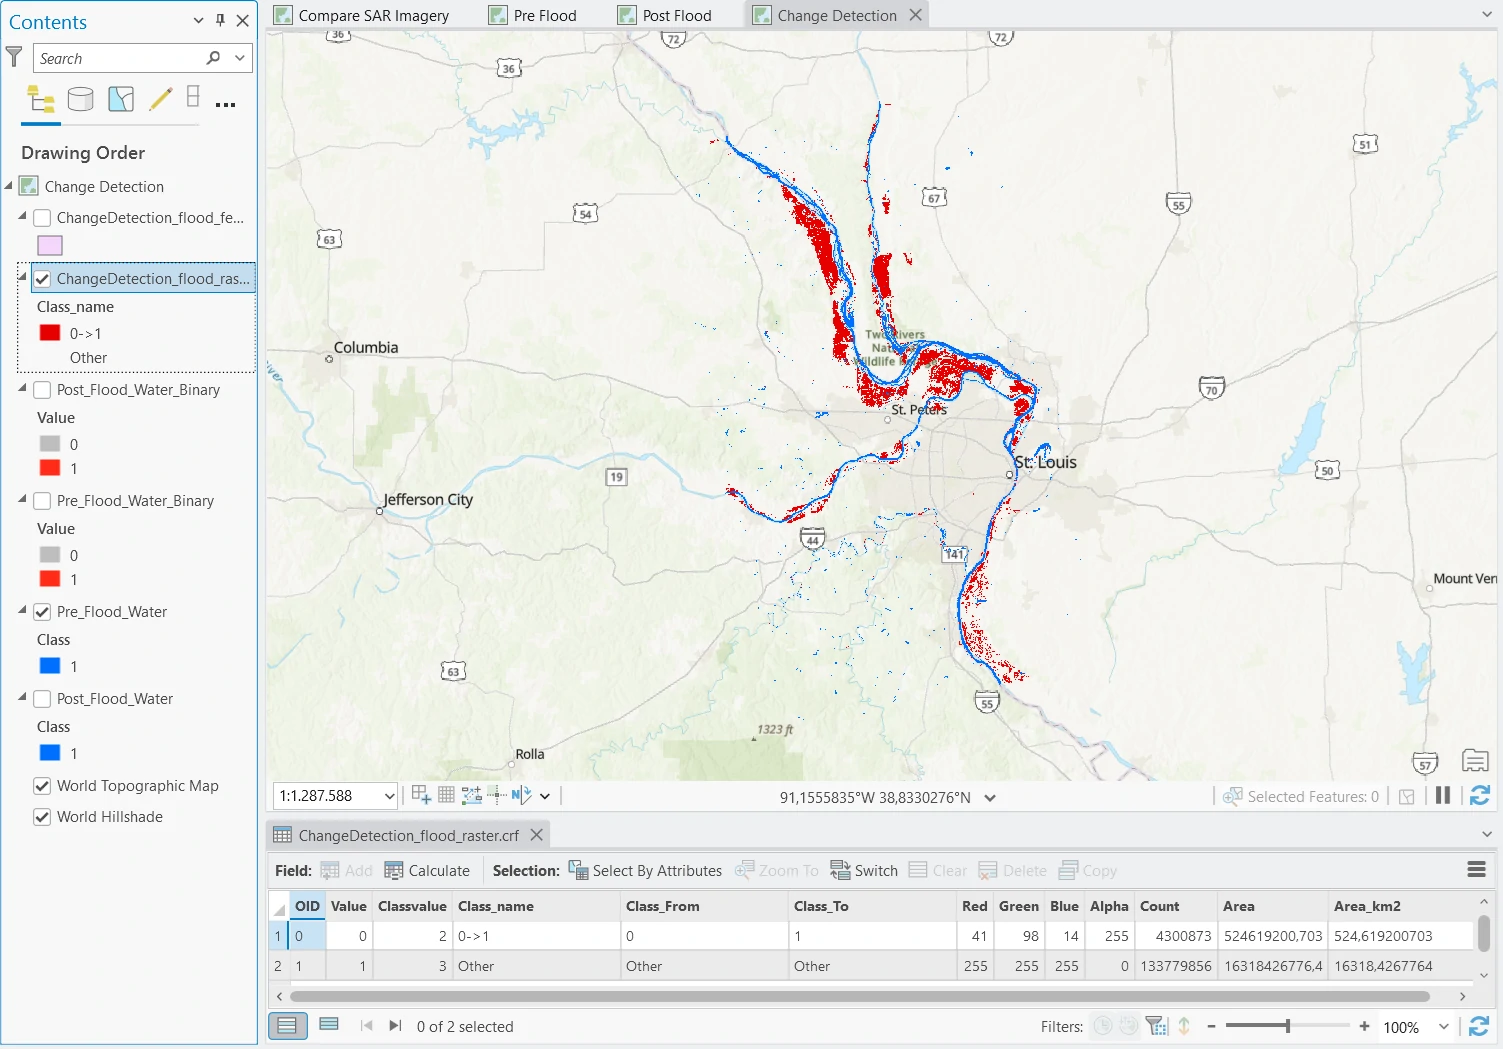
In Raster Dataset format
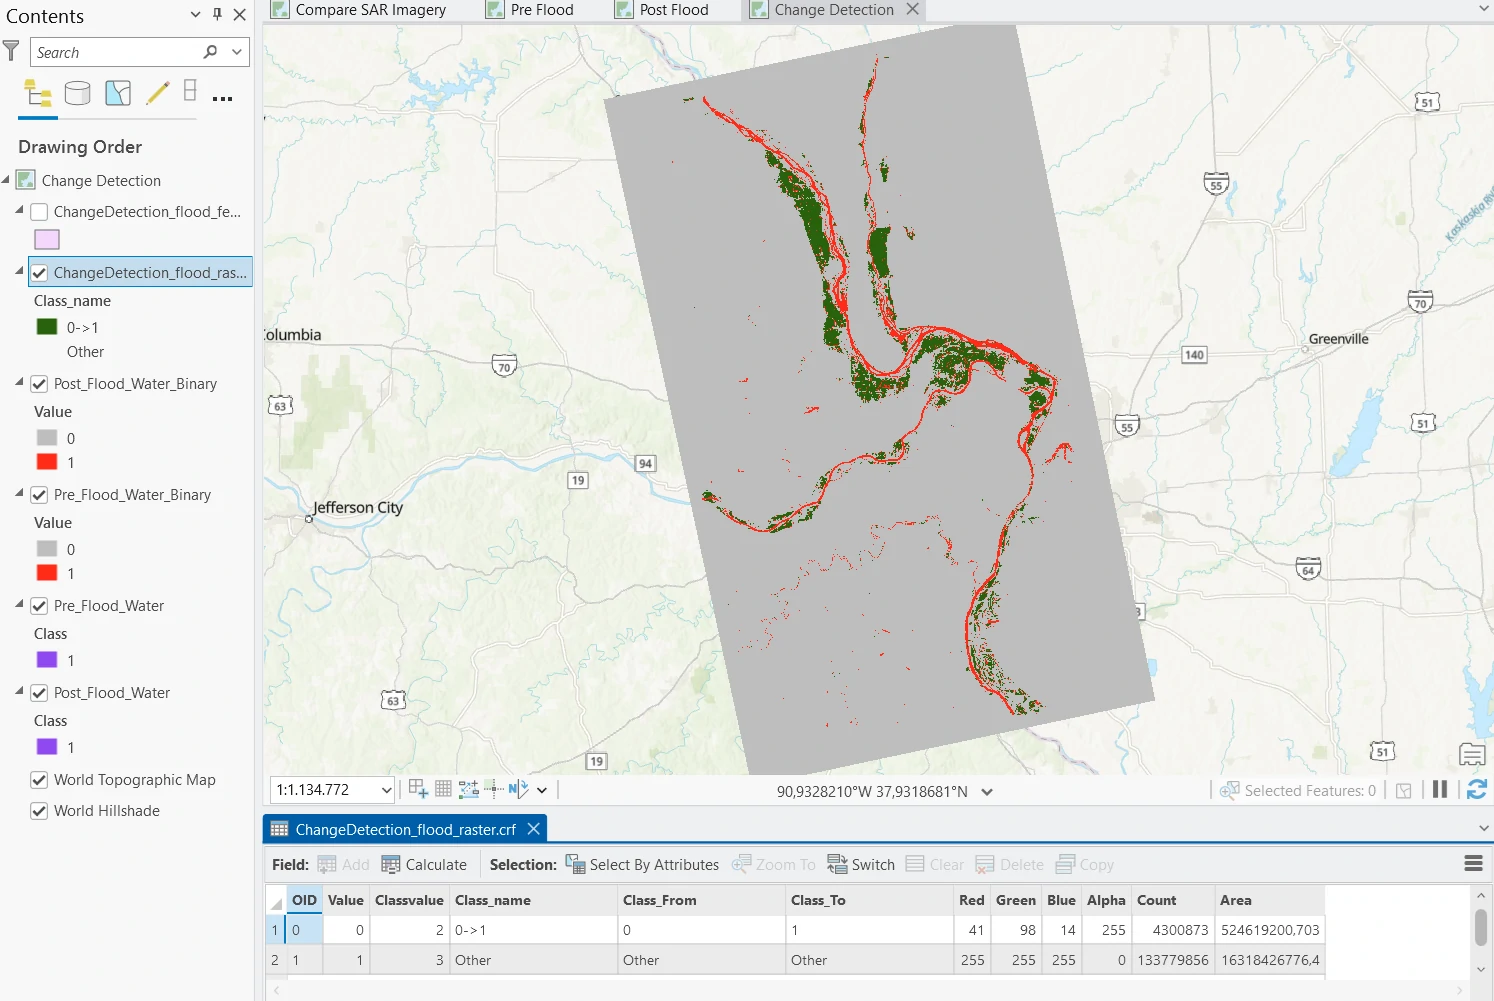
In Raster Dataset we will have these result:
- 0->1, which represents the pixels that went non-water to water and corresponds to the flooded areas.
- Other, which represents any other pixels. It is symbolized as No Color (transparent).
To get more insight, we can change visualization and observe attribute table at Raster Dataset. As we seen at image below, we can see more clearly changing area due to flood that labeled by red area compare with exisiting water body before flood (labeled by blue area). We can calculate impacted area by using area column which in square meters and change it into square kilometer. Click calculate button and create new columns (or replace exisiting one) and insert this expression !Area! / 1000000 to change from square meter to square kilometer.