End-to-End Data Science Workflow
machine learning
supervised learning
Introduction
This page outlines a structured data science approach to managing truck entry logistics within a manufacturing facility. From data collection and database design to dashboard development and predictive modeling, this project follows a clear data science workflow—from problem definition and data processing to model development and deployment. By applying data engineering, analytics, and machine learning techniques, we aim to optimize truck entry processes, improve compliance tracking, and enhance operational decision-making.
Managing logistics and ensuring smooth operations at a manufacturing site requires precise data tracking, especially for incoming truck deliveries. This project focuses on collecting and managing data on truck containers—specifically, the words and numbers written on them—as they enter the facility. Given the complexity of the truck entry process, which involves multiple inspection and unloading checkpoints, the challenge is to develop a robust data management system that allows for efficient tracking and analysis.
Trucks entering the manufacturing premises must pass through designated main gates, where they undergo several checks:
- Security Inspection – Ensuring compliance with entry protocols through a checklist.
- Quality Check – Verifying that the goods meet quality standards.
- Unloading Process – Delivering materials at the designated space.
One of the main challenges is that these checkpoints are far apart and often lack a stable internet connection, making real-time data synchronization difficult. This project aims to overcome these challenges by designing a structured process and system to capture, store, and analyze truck entry data effectively.
Why This Project Matters
- Operational Efficiency – Streamline truck entry, inspections, and unloading.
- Data-Driven Compliance Monitoring – Assess SOP adherence with a structured data approach.
- Actionable Insights for Management – Provide operational supervisors with real-time performance tracking.
- Improved Scheduling & Forecasting – Use predictive analytics to optimize truck arrivals and reduce bottlenecks.
By integrating database management, dashboard visualization, and machine learning techniques, this project will create a seamless logistics tracking system, ensuring better compliance, efficiency, and decision-making in truck entry operations.
Project Goals
This project consists of multiple key objectives, each contributing to better logistics management and operational efficiency:
- Project Management & Process Documentation
- Clearly define and document the entire process from project initiation to deployment.
- Map out the truck journey from arrival to unloading, highlighting all checkpoints and interactions.
- Data Management & Database Design
- Develop an easily sliceable database structure that stores all truck journey information.
- Enable analysts to assess compliance with internal SOPs and external vendor agreements.
- Dashboard Development for Operational Monitoring
- Build a dashboard for operational supervisors to monitor truck movement and field performance.
- Track whether purchases have been fully fulfilled, providing actionable insights for management reporting.
- Truck Arrival Time Prediction Model
- Develop a predictive model to estimate truck arrival times based on historical data.
- Identify patterns and potential delays to enhance logistics planning and scheduling.
- Model Explanation & Accuracy Assurance
- Provide a clear explanation of the prediction model, including input features, methodology, and output interpretation.
- Ensure model reliability by validating results through statistical evaluation, error metrics, and real-world testing.
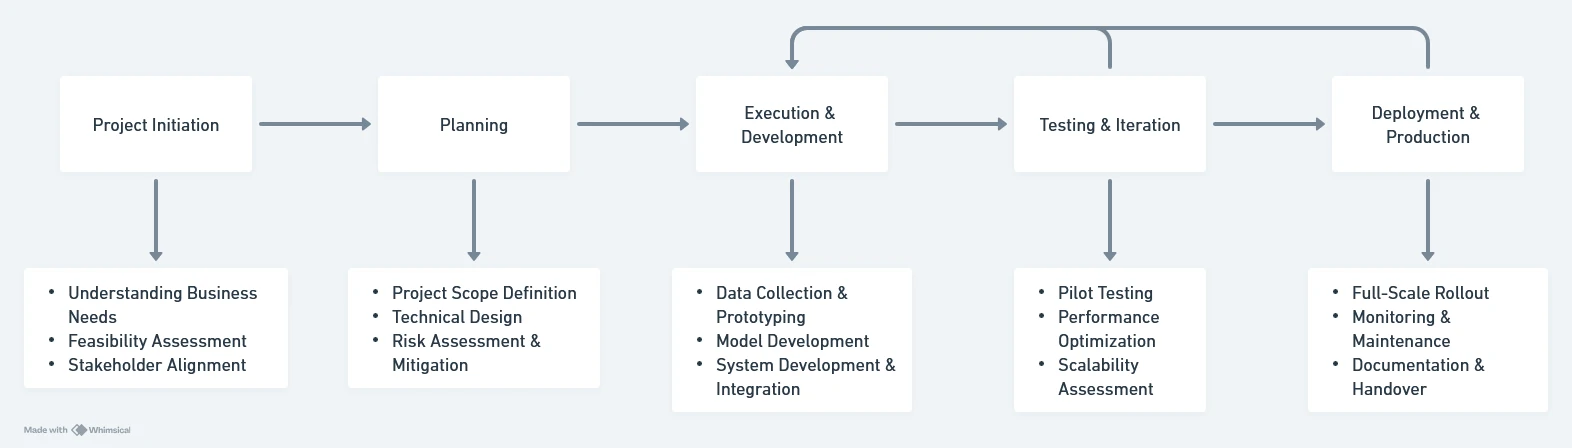
Basic Managing The Project From Initiation to Production
This part is a cross-functional effort involving logistics, IT, and operations. By following this structured approach, we ensure that the solution is practical, scalable, and valuable to the business. The key success factors are aligning stakeholders, iterative testing, and designing for real-world challenges from the start.
Project Initiation
At this stage, the goal is to define the problem, align stakeholders, and set realistic expectations.
- Understanding Business Needs
- Conduct a discovery session with stakeholders (e.g., operations, security, logistics).
- Clarify the objective: Why is capturing truck container data important? (e.g., security, tracking, inventory management).
- Define success criteria: What will be considered a successful implementation? (e.g., accuracy, speed, integration with existing systems).
- Start with the business problem, scope and risks:
- What’s the business risk?
- What’s the business goal?
- What’s the forecasting horizon?
- What’s the current business process?
- What’s the potential business impact?
- Feasibility Assessment
- Assess existing infrastructure: Are there cameras at entry gates? Is there an existing data pipeline?
- Identify technical constraints: Lighting conditions, camera angles, motion blur, and data storage requirements.
- Research best approaches: Optical Character Recognition (OCR), Computer Vision, or a combination with manual validation.
- assess the feasibility by conducting an exploration of the raw data.
- Stakeholder Alignment
- Present a high-level project plan.
- Get buy-in from key teams (IT, operations, procurement).
- Secure budget approval for hardware, software, and personnel.
Planning
This phase defines the roadmap and milestones.
- Project Scope Definition
- What will be captured? (Container numbers, company names, hazard symbols, etc.)
- What is the expected format of data storage? (Structured database, real-time monitoring system, etc.)
- Integration points: Will this link to an ERP or warehouse management system?
- Technical Design
- Choose the technology stack (e.g., OpenCV + Tesseract for OCR, cloud storage, API integration).
- Define the data pipeline (real-time or batch processing).
- Decide on backup and failover strategies.
- Risk Assessment & Mitigation
- External factors (weather affecting cameras, low-light conditions).
- False positives and false negatives in OCR.
- Network connectivity issues for real-time data transmission.
Execution & Development
Building the solution while ensuring minimal disruption to operations.
- Data Collection & Prototyping
- Deploy temporary cameras at the gates to collect sample images.
- Conduct an exploratory data analysis (EDA) on captured images.
- Identify common issues (blurry text, occlusions, reflections).
- Model Development
- Train OCR models using collected data.
- Fine-tune for specific challenges (e.g., different fonts, colors, dirt on containers).
- Develop error-handling mechanisms (e.g., flagging unclear text for manual review).
- System Development & Integration
- Build a web dashboard or API to expose the captured data.
- Ensure integration with existing business systems.
- Implement access control and data security measures.
Testing & Iteration
Ensuring reliability before full deployment.
- Pilot Testing
- Deploy in a limited environment (e.g., one entry gate).
- Compare system accuracy against manual logging.
- Gather feedback from security and logistics teams.
- Performance Optimization
- Adjust OCR thresholds, improve lighting conditions.
- Optimize processing time and database performance.
- Scalability Assessment
- Can the system handle multiple gates simultaneously?
- Will it need additional hardware or cloud scaling?
Deployment & Production
Making the system fully operational.
- Full-Scale Rollout
- Deploy across all entry points.
- Train operational teams on using the system.
- Implement a support framework for troubleshooting.
- Monitoring & Maintenance
- Set up logging and monitoring (error rates, accuracy, system uptime).
- Establish a feedback loop for continuous improvement.
- Plan for periodic model retraining to adapt to new conditions.
- Documentation & Handover
- Document system architecture, processes, and troubleshooting steps.
- Ensure knowledge transfer to the operations team.
This project is not just a technical implementation—it’s a cross-functional effort involving logistics, IT, and operations. By following this structured approach, we ensure that the solution is practical, scalable, and valuable to the business. The key success factors are aligning stakeholders, iterative testing, and designing for real-world challenges from the start.
Designing a Database for Truck Journey Monitoring
Since the goal is to capture the journey of a truck through multiple checkpoints and ensure compliance with SOPs, we need a well-structured, scalable, and efficient database design. Below is a structured approach, keeping in mind the constraints like disconnected internet at checkpoints and the need for an easy-to-analyze table for compliance assessment.
Understanding the Requirements
- Key Business Needs
- Capture truck journey data from entry to exit.
- Track compliance at each checkpoint (security, quality check, unloading).
- Ensure offline data collection due to connectivity issues.
- Provide a structured dataset for analysis.
- Design Considerations
- Data integrity: Ensure all required fields are logged properly.
- Data synchronization: Since some locations lack internet, local storage with periodic sync is required.
- Time-series capability: Capture timestamps to analyze journey delays and bottlenecks.
- Scalability: The design should handle high truck volumes.
Database Schema Design
To keep the database structured and easy to query, we will use a relational model with the following key tables:
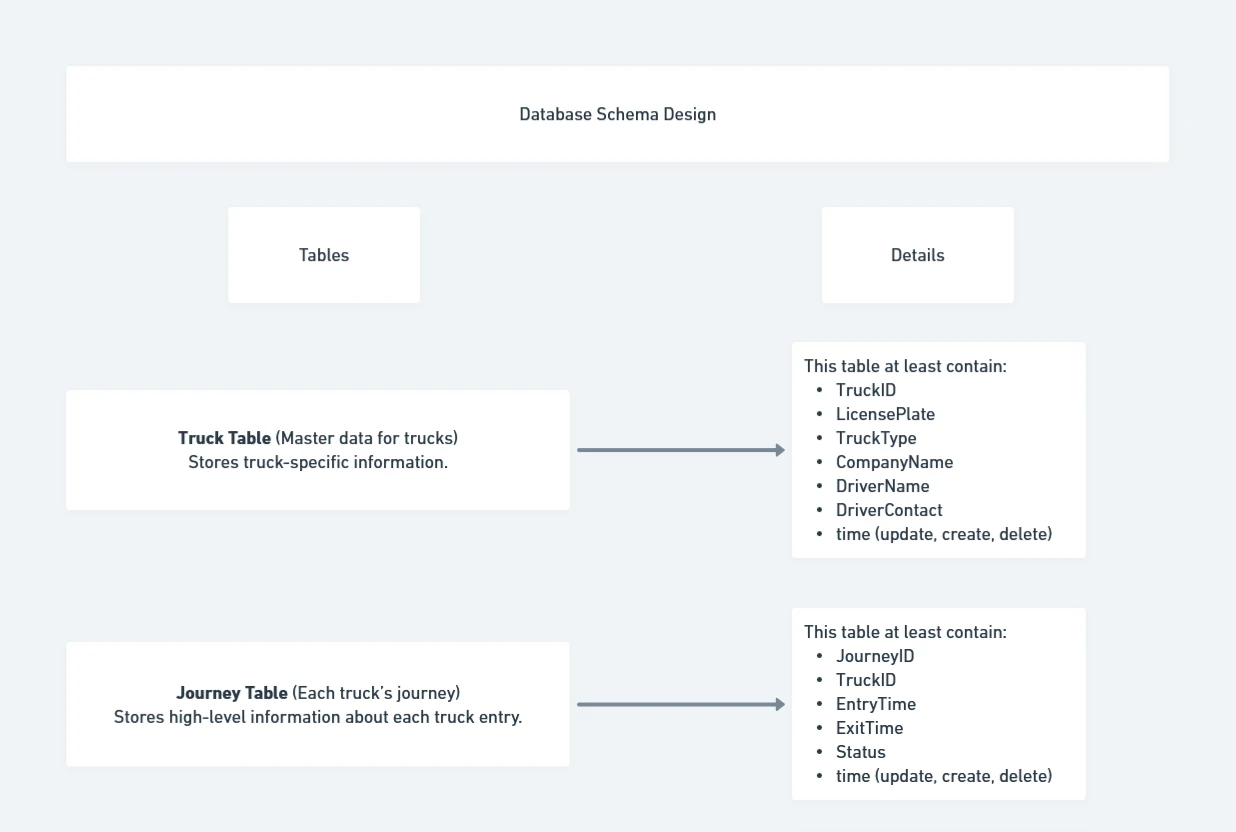
- Truck Table (Master data for trucks) – Stores truck-specific information.
CREATE TABLE Trucks ( TruckID INT PRIMARY KEY AUTO_INCREMENT, LicensePlate VARCHAR(20) UNIQUE NOT NULL, TruckType VARCHAR(50), CompanyName VARCHAR(100), DriverName VARCHAR(100), DriverContact VARCHAR(20) ); - Journey Table (Each truck’s journey) – Stores high-level information about each truck entry.
CREATE TABLE Journeys (
    JourneyID INT PRIMARY KEY AUTO_INCREMENT,
    TruckID INT NOT NULL,
    EntryTime DATETIME NOT NULL,
    ExitTime DATETIME,
    Status ENUM('Ongoing', 'Completed', 'Flagged') DEFAULT 'Ongoing',
    FOREIGN KEY (TruckID) REFERENCES Trucks(TruckID)
);
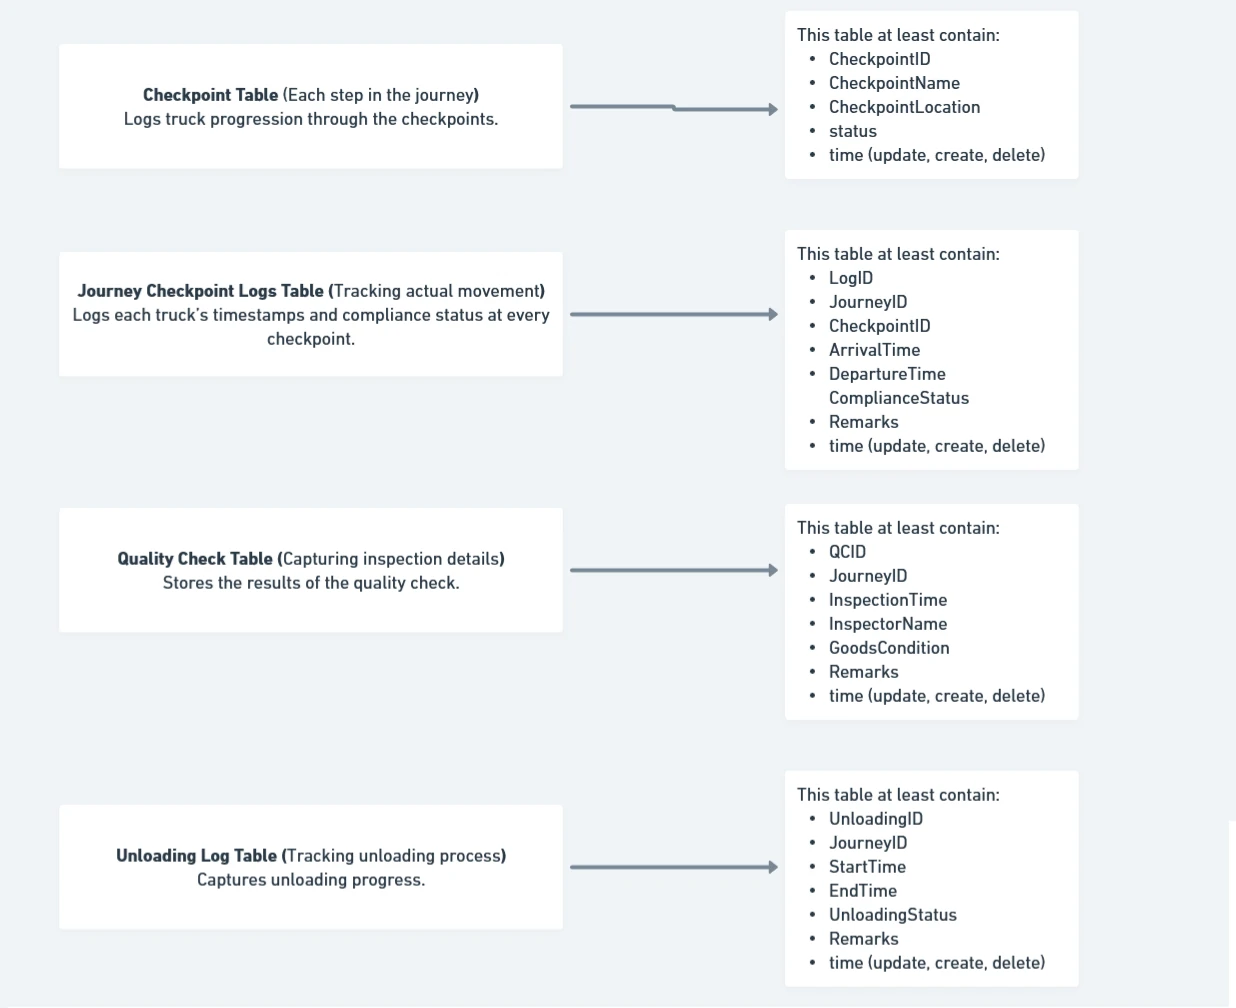
- Checkpoint Table (Each step in the journey) – Logs truck progression through the checkpoints.
CREATE TABLE Checkpoints ( CheckpointID INT PRIMARY KEY AUTO_INCREMENT, CheckpointName ENUM('Security', 'Quality Check', 'Unloading') NOT NULL, CheckpointLocation VARCHAR(100) NOT NULL ); - Journey Checkpoint Logs Table (Tracking actual movement) – Logs each truck’s timestamps and compliance status at every checkpoint.
CREATE TABLE JourneyCheckpoints ( LogID INT PRIMARY KEY AUTO_INCREMENT, JourneyID INT NOT NULL, CheckpointID INT NOT NULL, ArrivalTime DATETIME NOT NULL, DepartureTime DATETIME, ComplianceStatus ENUM('Pass', 'Fail', 'Pending') DEFAULT 'Pending', Remarks TEXT, FOREIGN KEY (JourneyID) REFERENCES Journeys(JourneyID), FOREIGN KEY (CheckpointID) REFERENCES Checkpoints(CheckpointID) ); - Quality Check Table (Capturing inspection details) – Stores the results of the quality check.
CREATE TABLE QualityChecks ( QCID INT PRIMARY KEY AUTO_INCREMENT, JourneyID INT NOT NULL, InspectionTime DATETIME NOT NULL, InspectorName VARCHAR(100), GoodsCondition ENUM('Good', 'Damaged', 'Incomplete') NOT NULL, Remarks TEXT, FOREIGN KEY (JourneyID) REFERENCES Journeys(JourneyID) ); - Unloading Log Table (Tracking unloading process) – Captures unloading progress.
CREATE TABLE UnloadingLogs (
    UnloadingID INT PRIMARY KEY AUTO_INCREMENT,
    JourneyID INT NOT NULL,
    StartTime DATETIME NOT NULL,
    EndTime DATETIME,
    UnloadingStatus ENUM('Completed', 'Partial', 'Failed') DEFAULT 'Partial',
    Remarks TEXT,
    FOREIGN KEY (JourneyID) REFERENCES Journeys(JourneyID)
);
Design Assumptions
- Offline Capability
- Each checkpoint system will locally store the data.
- A background process will sync with the central database once a connection is available.
- Easy Querying for Compliance Analysis
- All journey data is linked through JourneyID, making it easy to slice data by truck, date, or compliance status.
- Status fields (ComplianceStatus, UnloadingStatus, etc.) make it easy to flag non-compliance cases.
- Timestamp-Based Analysis
- ArrivalTime and DepartureTime allow tracking of delays and bottlenecks.
- Normalization vs. Denormalization
- This design is normalized for data integrity, but we could create materialized views or aggregated tables for faster analysis.
Potential Implementation
- Prototype a small-scale system at one checkpoint and validate data capture reliability.
- Test the offline data collection and syncing process to ensure no data loss.
- Develop front-end dashboards for real-time monitoring and reporting.
- Fine-tune compliance rules and define automated alerts for violations.
This database design is built for scalability, reliability, and easy compliance tracking. It ensures smooth tracking of truck movements while allowing analysts to slice and analyze the data efficiently. By structuring it properly, we make sure the system is future-proof and adaptable to business needs.
Designing a Dashboard for Process Performance
Since the operational supervisor needs to monitor the field process and ensure that purchases are fully fulfilled, the dashboard should be simple, insightful, and action-oriented.
Key Design Principles
- Clarity: The dashboard should provide a quick overview of key metrics.
- Real-time Monitoring: Since truck processes are ongoing, the data should be as fresh as possible.
- Drill-Down Capability: Allow supervisors to investigate issues when needed.
- Actionable Insights: Highlight delays, compliance violations, and fulfillment gaps.
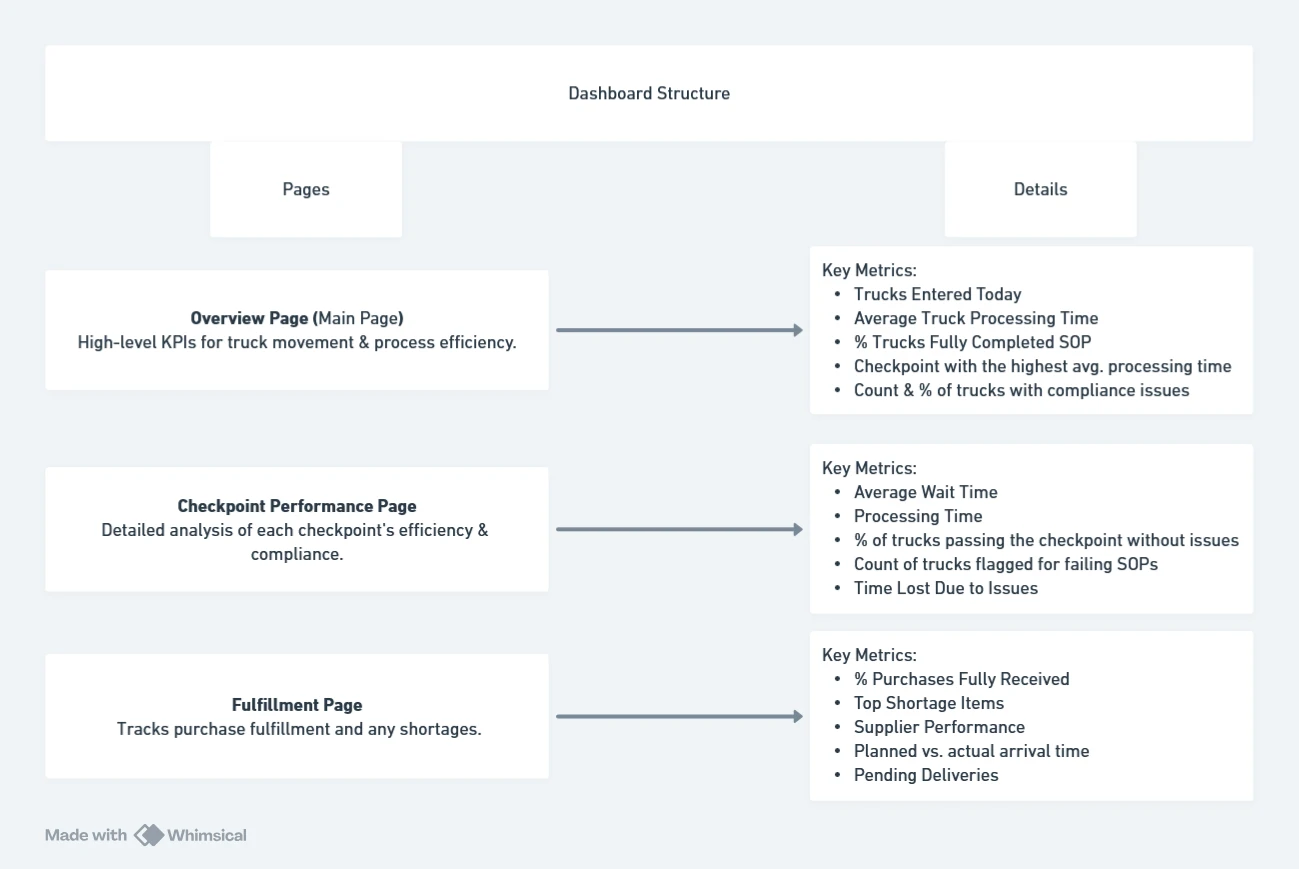
Dashboard Structure
To keep the dashboard clean and structured, I would design three main pages:
- Overview Page (Main Page) – High-level KPIs for truck movement & process efficiency.
- Checkpoint Performance Page – Detailed analysis of each checkpoint’s efficiency & compliance.
- Fulfillment Page – Tracks purchase fulfillment and any shortages.
Page Breakdown and Metrics
-
Overview Page - Field Process Summary
Purpose: Provide a high-level summary of truck activity and process efficiency.
Key Metrics:
- Trucks Entered daily (Count of trucks that arrived)
- Average Truck Processing Time (From entry to exit)
- % Trucks Fully Completed SOP (Trucks that passed all checkpoints without issues)
- Bottleneck Checkpoint (Checkpoint with the highest avg. processing time)
- Trucks Flagged for Issues (Count & % of trucks with compliance issues)
-
Checkpoint Performance Page - Compliance & Process Breakdown
Purpose: For analyzing performance and Tracking truck movement through checkpoints, spot delays, and monitor compliance.
Key Metrics per Checkpoint (Security, Quality Check, Unloading):
- Average Wait Time (Time spent waiting before each checkpoint)
- Processing Time (Time taken to complete each checkpoint process)
- Compliance Pass Rate (% of trucks passing the checkpoint without issues)
- Non-Compliance Cases (Count of trucks flagged for failing SOPs)
- Time Lost Due to Issues (Extra time taken due to compliance failures)
-
Fulfillment Page - Purchase Completion Tracking
Purpose: Help the supervisor track whether purchases have been fulfilled completely and Ensuring that all ordered goods are received fully
Key Metrics:
- % Purchases Fully Received (Orders where all items arrived in full quantity)
- Top Shortage Items (Items with the highest % of missing quantities)
- Supplier Performance (Suppliers frequently under-delivering)
- Average Delivery Time Variance (Planned vs. actual arrival time)
- Pending Deliveries (Orders still in progress)
Additional Features for Usability
To make the dashboard practical and efficient:
- Filters: Date range, supplier, truck type, checkpoint, etc.
- Drill-Down: Clicking a flagged truck should show its journey details.
- Exportable Reports: CSV/PDF exports for management reporting.
- Alerts & Notifications: Automatic alerts when compliance drops below a threshold.
This structured dashboard design ensures that the operational supervisor can quickly assess truck process efficiency, identify bottlenecks, and monitor purchase fulfillment. It is designed to be simple, actionable, and scalable, making it a valuable tool for daily operations
Developing a Truck Arrival Time Prediction Model
By utilize CRISP-DM framework, we ensure a practical, data-driven solution to predict truck arrival times. And by choosing a combination of machine learning and statistical methods, we balance accuracy, interpretability, and operational usability.
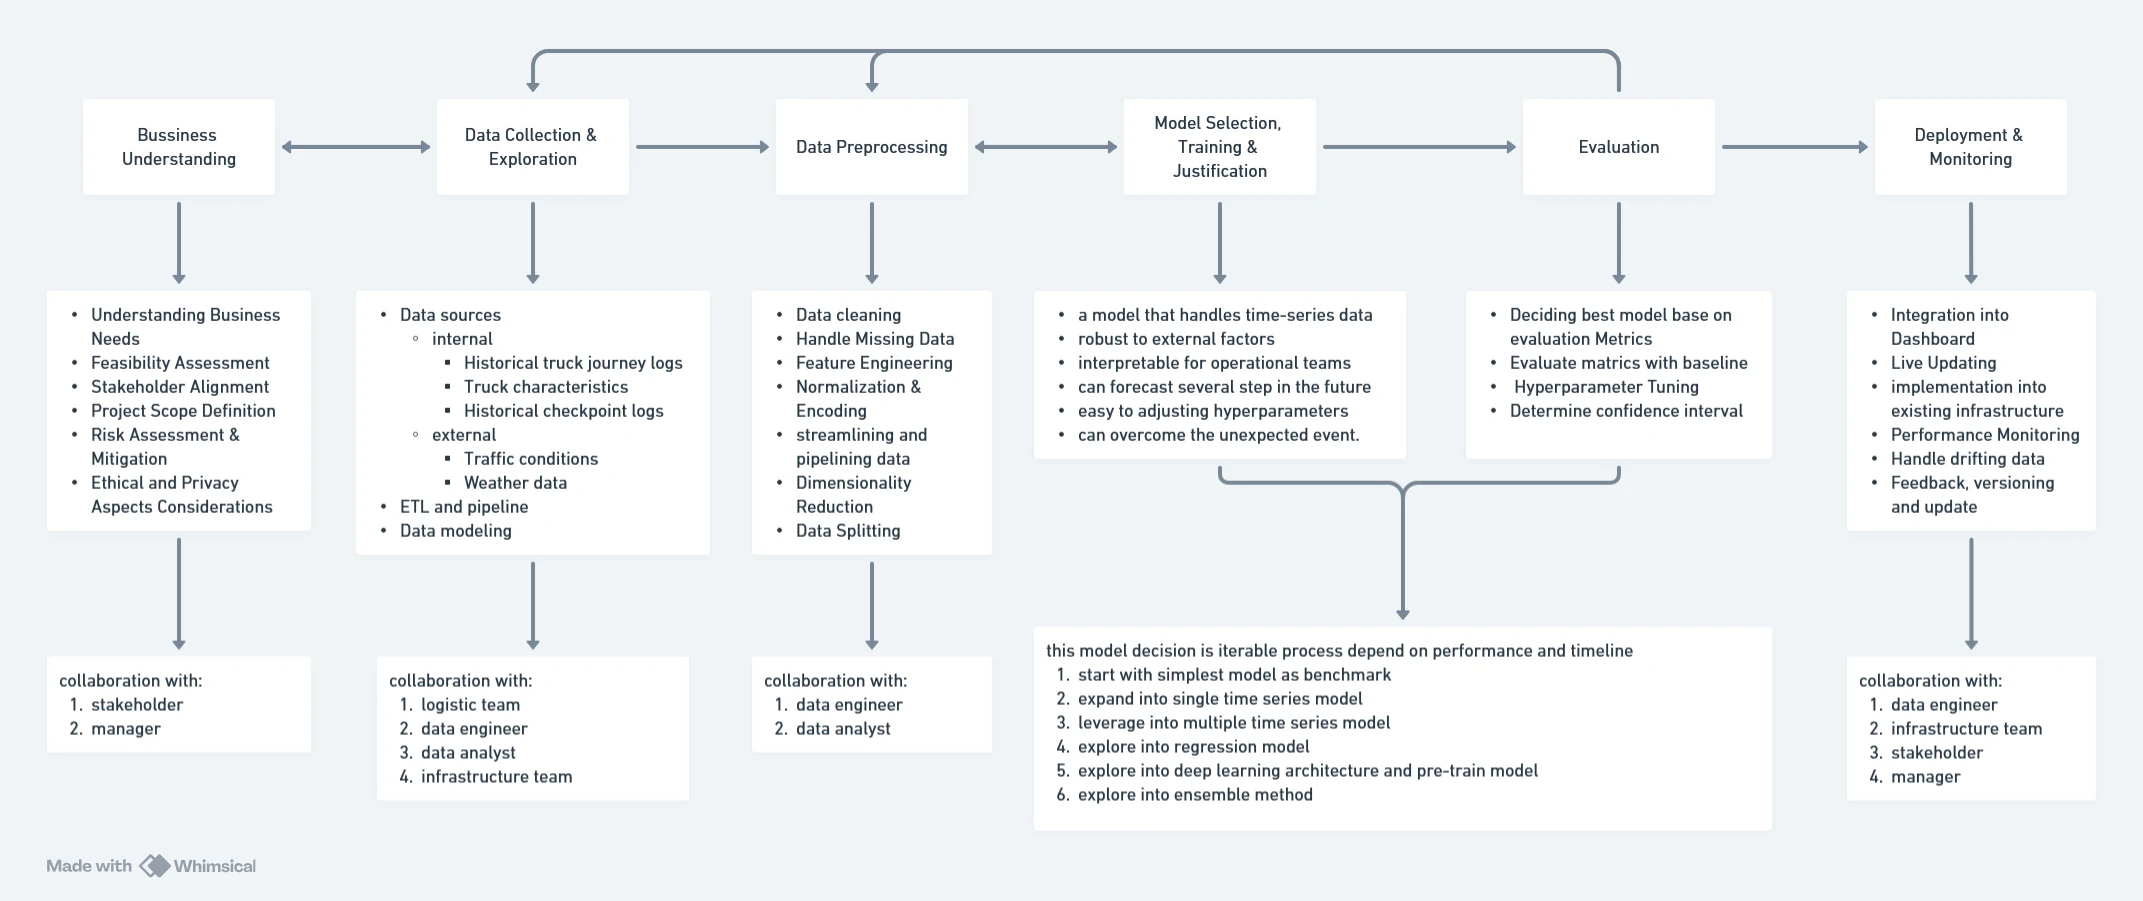
Understanding the Problem
The goal is to predict when a truck will arrive at the premise based on available data. This helps operational teams optimize resource allocation, reduce waiting times, and improve efficiency in handling truck arrivals.
- Key Challenges:
- Traffic & External Factors: Unexpected road conditions, weather, or detours.
- Data Availability: Historical truck arrival data might be incomplete.
- Offline Checkpoints: Some locations lack real-time tracking.
Collaboration with:
- All stakeholder
- Data manager
- Product manager
- ect
Data Collection & Exploration
- What we need:
- Internal data:
- Historical truck entry logs (Timestamped records of when each truck arrived).
- Truck departure times from suppliers (When the truck left the origin).
- Checkpoint delays (Time lost due to security, inspection, unloading).
- Truck characteristics (Size, type, speed limit, supplier consistency).
- External data:
- Traffic conditions (Road congestion, accidents, alternative routes).
- Weather data (Heavy rain, storms could impact arrival time).
- Internal data:
Collaboration with:
- Logistics Team
- Data Engineer
- Data Analyst
- Infrastructure Team
- Software Engineer
Data Preprocessing
- What we could do:
- Handle Missing Data: Impute missing timestamps using median travel times.
- Feature Engineering:
- Time-based features: Hour of the day, day of the week (weekday/weekend).
- Traffic conditions: Encode congestion levels.
- Supplier consistency: Average delay per supplier.
- Weather conditions: Assign delay impact scores.
- Normalization & Encoding: Standardize continuous variables, encode categorical variables.
- Streamlining and Pipelining data
- Spliting data into Training, Validation, and Test
Collaboration with:
- Data Engineer
- Data Analyst
Model Selection, Training & Justification
- Key Considerations:
- We need a model that handles time-series data.
- It should be robust to external factors (e.g., sudden traffic spikes).
- It should be interpretable for operational teams.
- Model decision: This model decision is iterable process and depend on performance and timeline of project.
- Start with simplest model as benchmark
- Expand into single time series model
- Leverage into multiple / multivariable time series model
- Explore into regression model
- Explore into deep learning architecture and pre-train model
- Explore into ensemble method
- Some Examples Forecasting Model
| Model | Pros | Cons |
|---|---|---|
| Linear Regression | Simple, interpretable | Can’t capture non-linear delays (traffic/weather) |
| Random Forest Regressor | Handles non-linearity, robust | Less interpretable, slower with large data |
| Gradient Boosting (XGBoost) | High accuracy, handles missing data well | Requires careful hyperparameter tuning |
| LSTM (Deep Learning) | Captures time dependencies | Needs large data, complex to explain |
| Hybrid Approach (Statistical + ML) | Combines historical trends with real-time adjustments | More effort in implementation |
Collaboration with:
- Data Engineer
- Data Analyst
Model Training & Evaluation
- What we could do:
- Decising The Best Model Based on Evaluation Metrics.
- Evaluate Metrics with Baseline / Benchmark / Reference.
- Hyperparameter Tunning – using Grid Search/Cross-Validation.
- Determine Confidence Interval
- Evaluation Metrics:
- Mean Absolute Error (MAE) – Measures average prediction error.
- Root Mean Squared Error (RMSE) – Penalizes large errors.
- R² Score – Measures how well the model explains variation in arrival times.
- Mean Absolute Percentage Error (MAPE) – Measures of prediction accuracy of a forecasting method.
- Symmetric Mean Absolute Percentage Error (SMAPE) – Similiar with MAPE but with designed to account for the relative difference between predicted and actual values, considering their magnitudes in a balanced manner.
Deployment & Monitoring
- What we could do:
- Integration into Dashboard – Provide predicted arrival times to the operations team.
- Live Updating – Retrain model periodically with new data.
- Performance Monitoring – Compare predictions vs. actual arrivals; adjust model as needed.
Collaboration with:
- Data Engineer
- Infrastructure Team
- Stakeholders
- Manager
This approach ensures a practical, data-driven solution to predict truck arrival times. By choosing a combination of machine learning and statistical methods, we balance accuracy, interpretability, and operational usability. Collaboration with logistics, security, and IT teams will be essential for gathering reliable data and making real-time predictions possible.
Explaining the Prediction Model to Management
It is common that Stakeholders scrutinize the model and its results, questioning its accuracy and the methodology behind its predictions.
This situation is sometimes referred to as the Machine Learning model being a “black box”. When management describes the model “a black box”, they are concerned about transparency, interpretability, and trust in the predictions. Our goal is to simplify the explanation, show how the model works, and provide proof of its reliability.
- There area some apporach that we can use:
- Explain the Model in Simple Terms – using Lyman’s terms to explain how the model works.
- Show What Factors Influence the Prediction – by present:
- Feature Importance Chart – Showing which factors (e.g., traffic, supplier delays) contribute most to the prediction.
- Decision Tree Example – A simplified tree explaining how different variables affect the outcome.
- SHAP (SHapley Additive Explanations) Values – A method to break down individual predictions.
- Compare Model Predictions vs. Actual Outcomes – provide a performance report:
- Historical Accuracy – “In the last 30 days, our predictions were within ±10 minutes for 85% of trucks.”
- Error Analysis – “When errors occurred, they were mostly due to unpredictable events (e.g., accidents).”
- Offer a Simple Benchmark for Reference – Comparing the advance model with the simplest model as reference to show it capability.
- Enable Human Oversight – add some addition components, e.g. manual adjustment, provide confidence intervals, Keep the model continuously updated with new data.
By explaining in simple terms, showing how predictions are made, and demonstrating real accuracy, we can assure management that the model is not a black box but a well-informed decision tool.