Data Modeling
data engineering
data modeling

What Is Data Modelling?
Data modelling is the process used to structure how data is stored, as well as modelling relationships within the data. The goal is to create a visual data map that accurately describes the data structure, how data will flow through the system whilst highlighting important data relationships. This can involve the data input itself, the data infrastructure and output, whether that’s predictive models, ML algorithms, AI or other products/services.
Project Overview
Problem Statement and Objective
The main goal is to store and provide access to both actual and historical price data with granularity for region, SKU, Channel, and bottom prices for selling and buying. This data-mart will support analytics, reporting, and business intelligence needs.
This mart will help team data to analyze more deeper such as:
- Price prediction
- Recommendation system for High velocity and margin for each area, channel and SKU
- Part of matchmaking recommendation to generate transaction with high margin
- etc
issues From product FOV
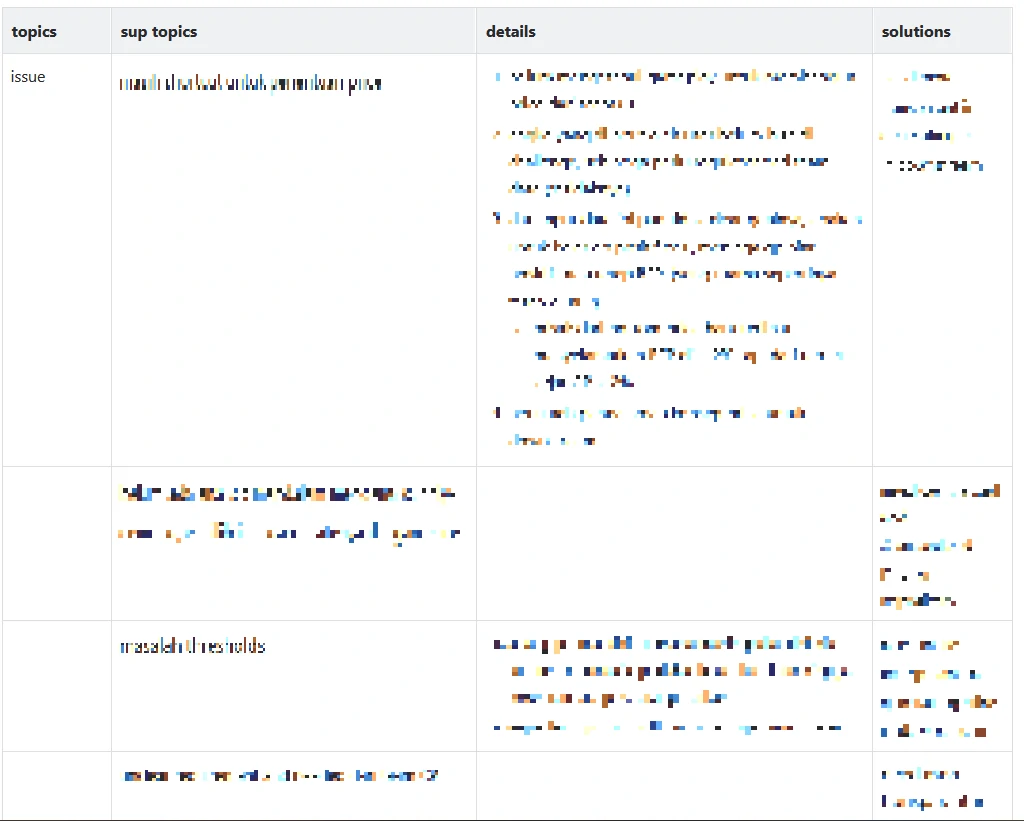
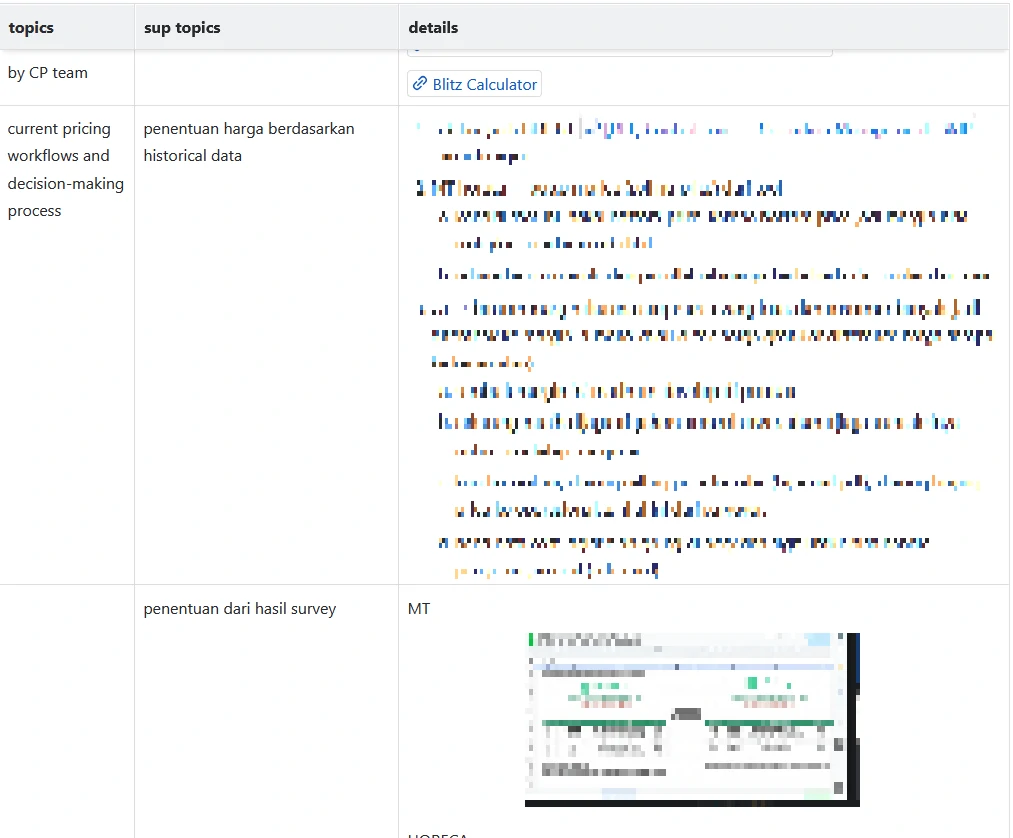
issues From Business FOV
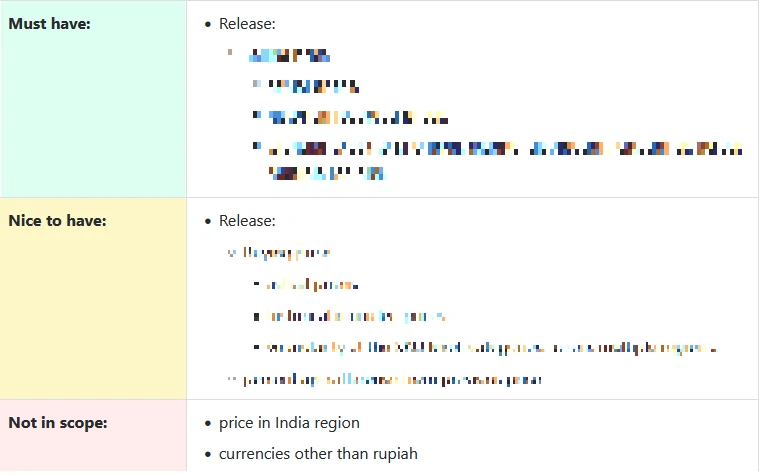
scope
Success Criteria
Define how the datamart’s success will be measured:
- All key metrics are available with the required granularity.
- Data is accurate, consistent, and available for reporting.
- The datamart supports required performance and scalability.
Steps
We start from these step to step define requirment and and build data model. 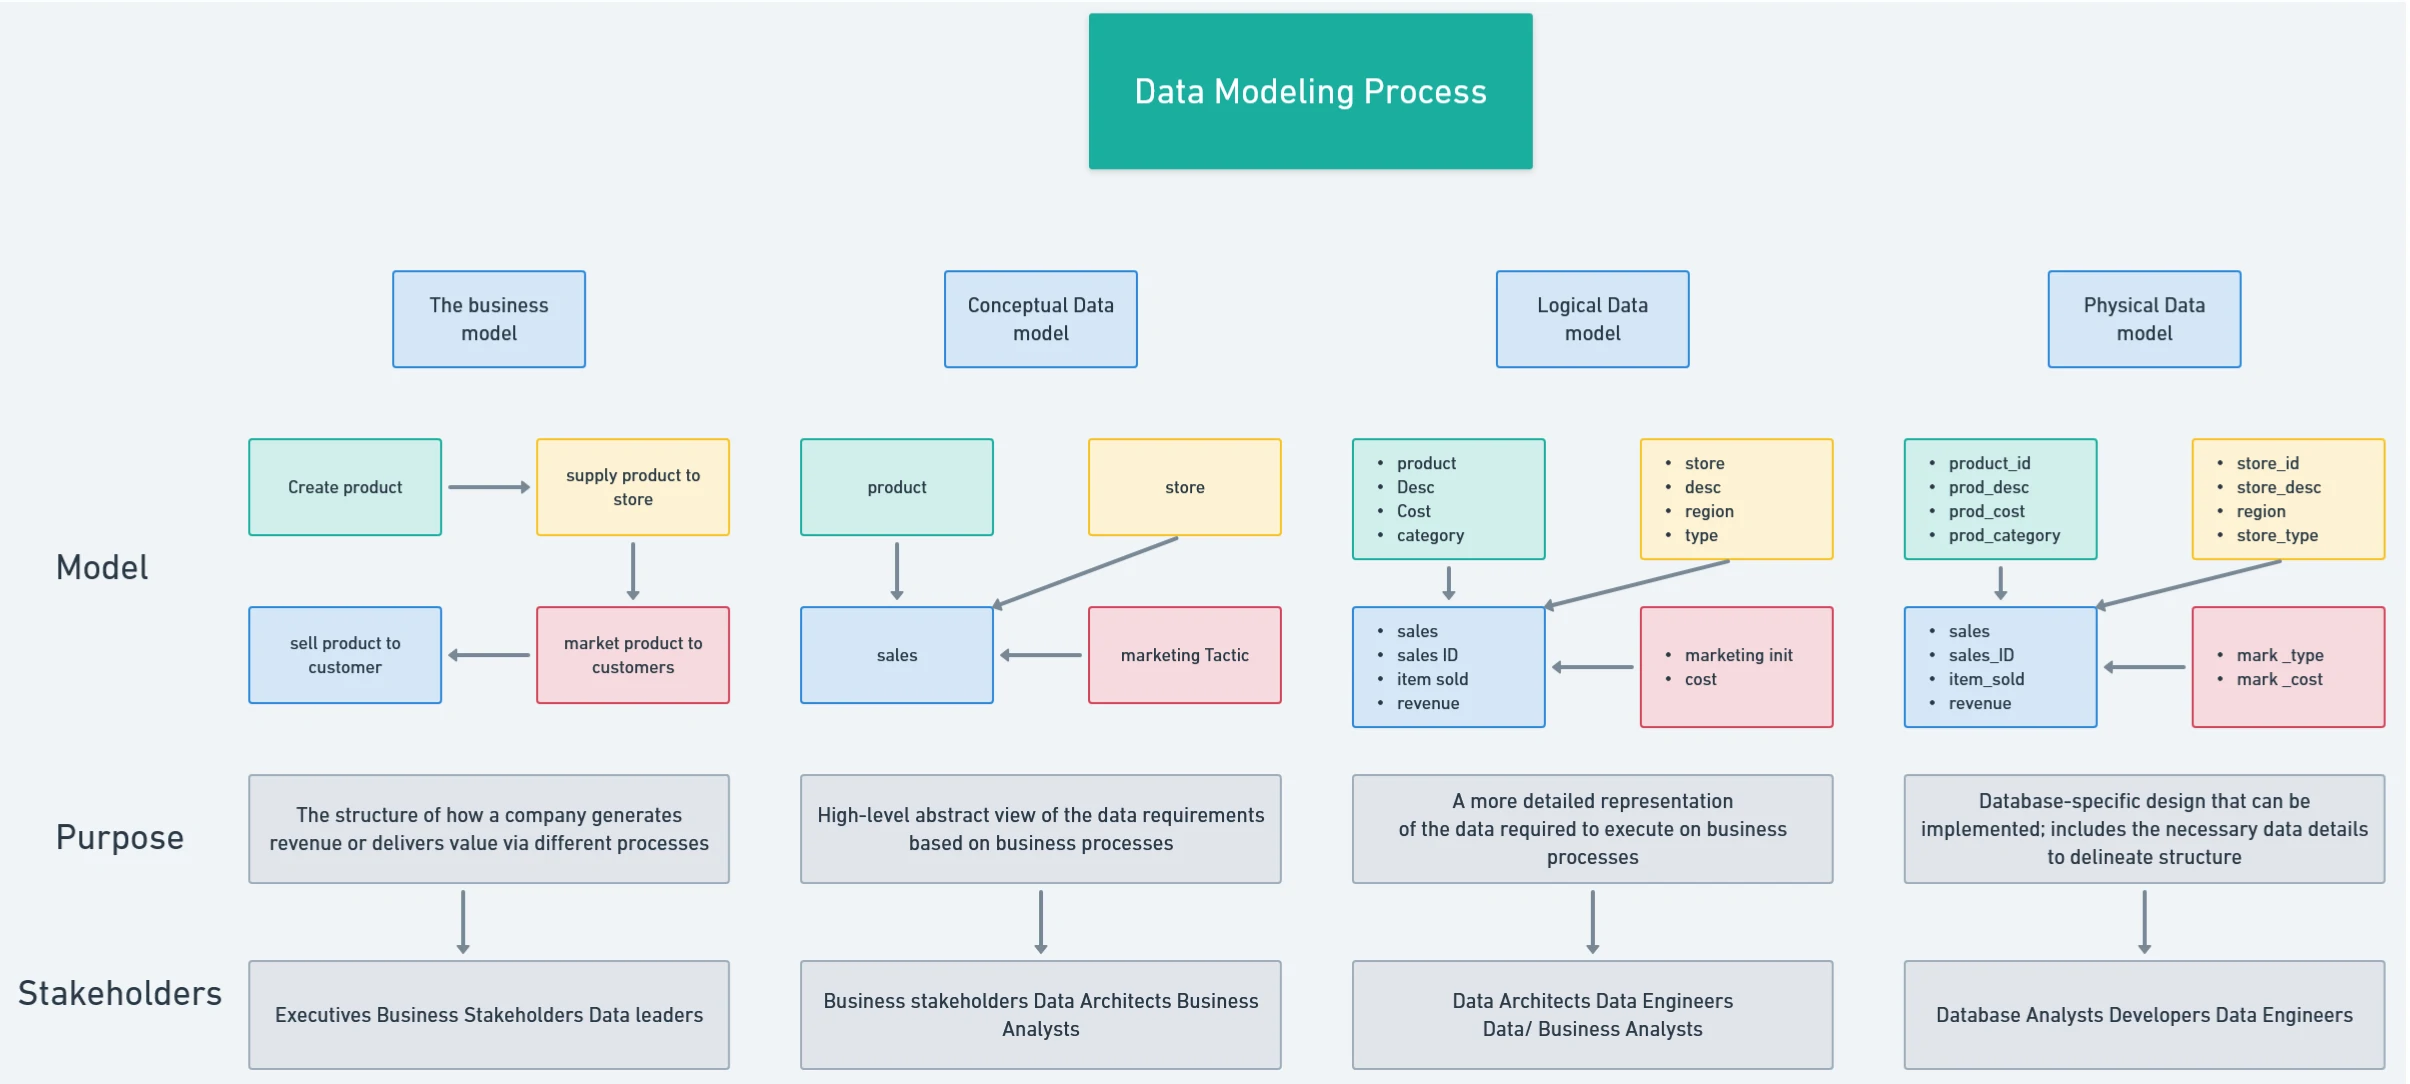
Timeline
Define a high-level timeline with phases: 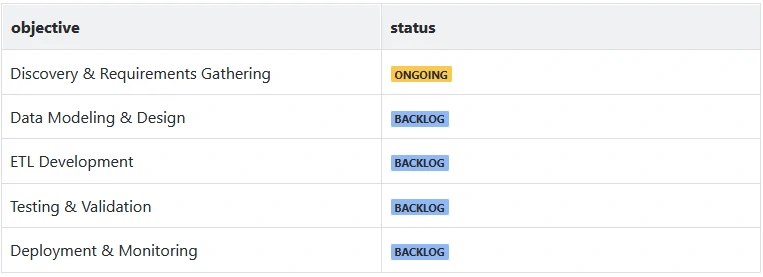
Comparing analysis
Gap Analysis
Assess gaps between current systems and the desired state: 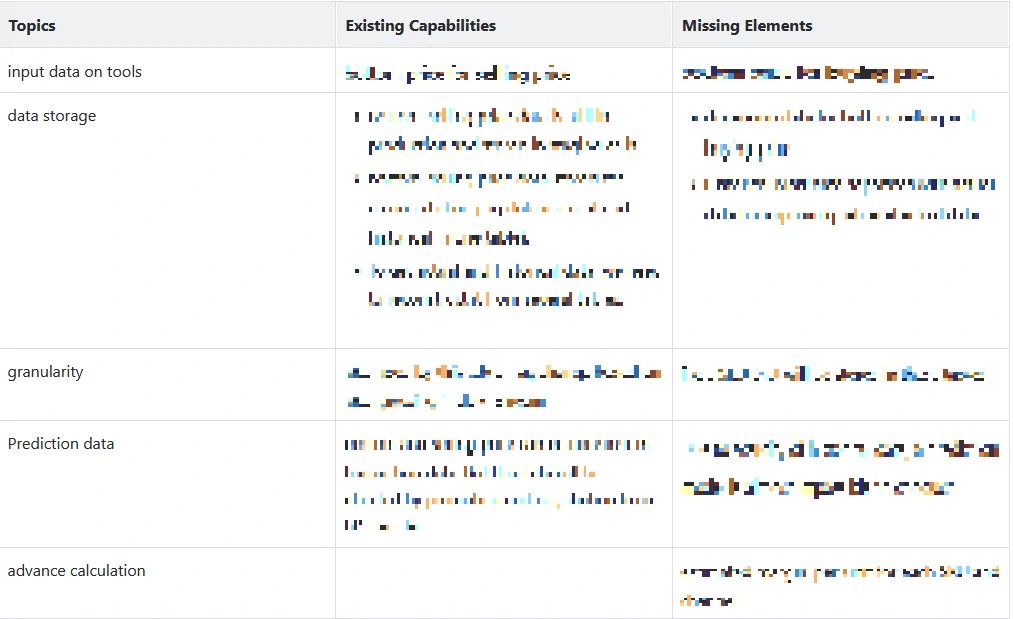
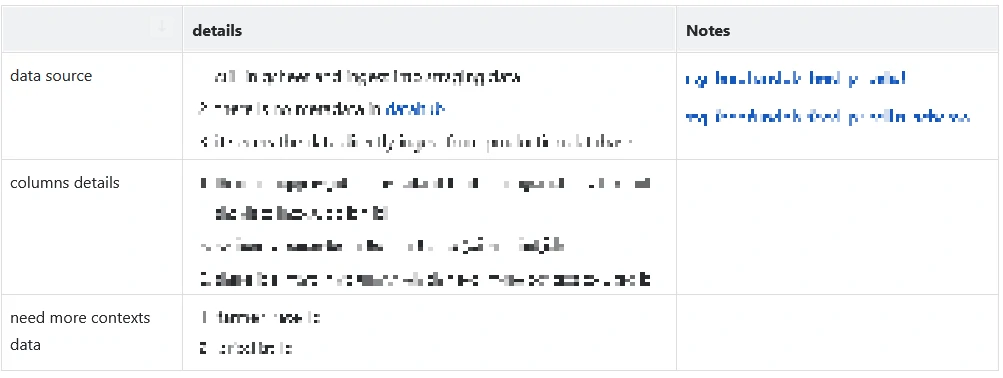
Data Sources and Input Tables
Source Systems:
- List the source systems (e.g., transactional sales systems, procurement systems, ERP, third-party APIs).
Input Tables:
- Specify the tables and fields that will feed into the datamart (e.g., sales_transactions, procurement_orders, product_master, region_hierarchy).
Data Frequency:
- Define how often the data will be updated (e.g., daily, weekly, real-time).
Data Model Design
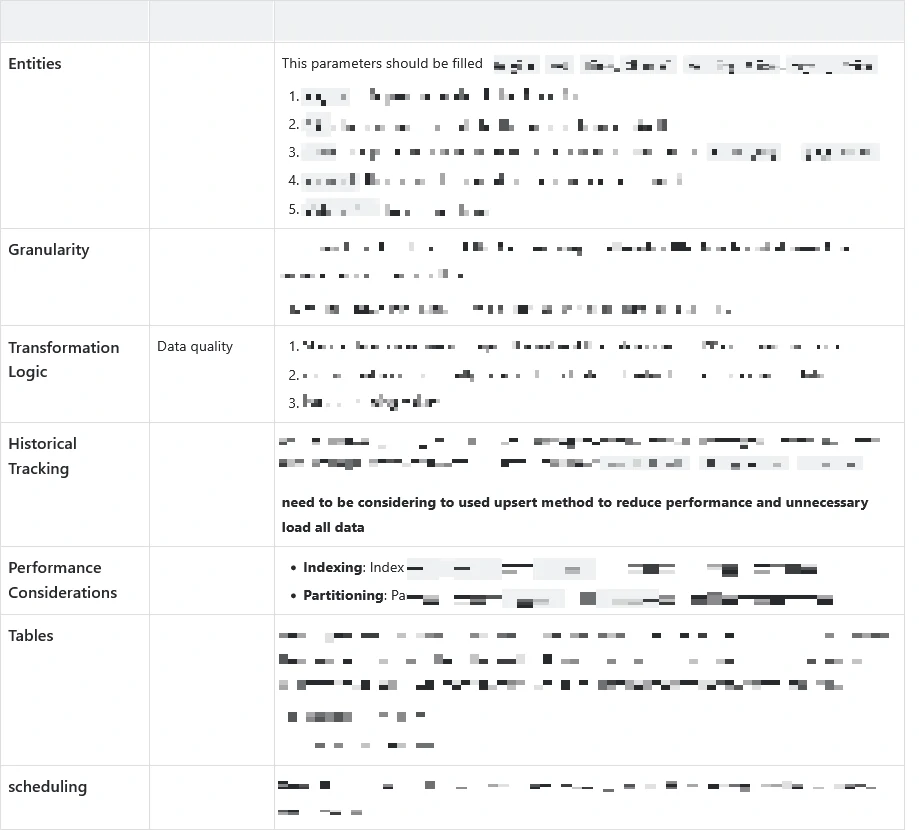
Entities:
- Define key entities: Region, SKU, Time, parameters.
Granularity:
- Data will be aggregated at the parameters and regional levels with time-based dimensions (daily, weekly, or monthly granularity).
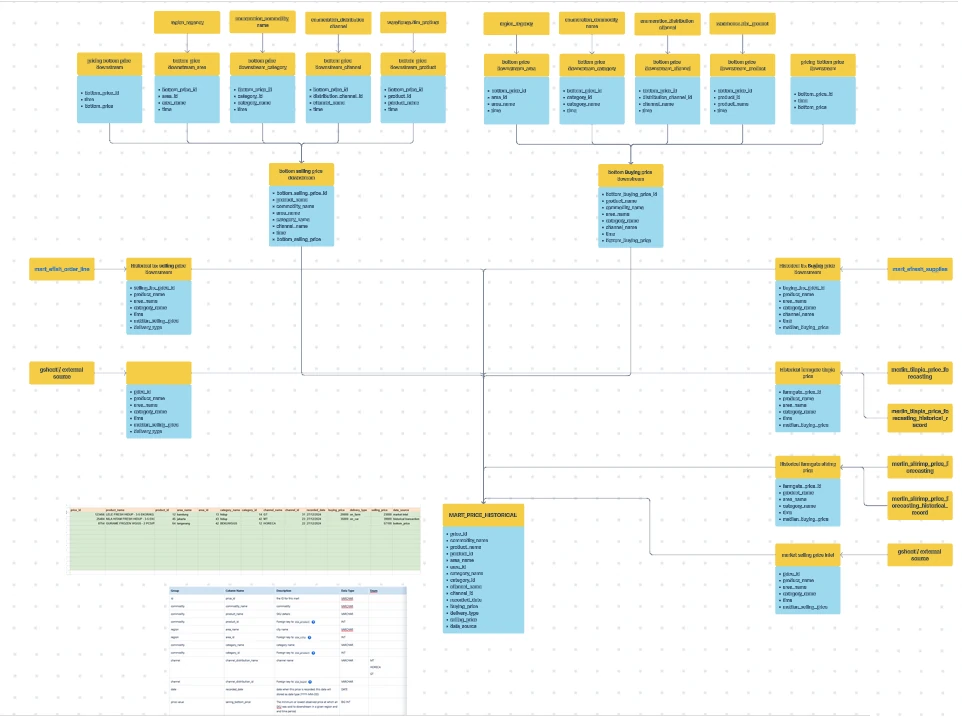
Data Modeling Approach
Star Schema: The data model will use a star schema design. This structure will include:
- Fact Table: parameter_fact — contains quantitative data, representing the main transactions.
- Dimension Tables: sku_dimension, region_dimension, time_dimension, and potentially others depending on business needs (e.g., supplier_dimension).
The star schema is chosen for its simplicity and performance, optimized for fast query response in reporting and analytics.
Fact Table
Fact Table: parameter_fact The fact table stores the main transactional data. It will be the central table of the datamart, containing measures (e.g., actual parameter) and foreign keys to dimension tables.
Schema Definition
| Column Name | Data Type | Description |
|---|---|---|
| parameter_fact_id | INT | Primary key (auto-increment) |
| sku_id | INT | Foreign key to sku_dimension |
| region_id | INT | Foreign key to region_dimension |
| date_id | INT | Foreign key to time_dimension |
| … | … | … |
Design Considerations
- Granularity: The lowest level of detail is at the SKU, region, and daily level (based on date_id).
- Currency Handling: parameters fields should accommodate different currencies; conversions might be applied if needed.
- Historical Tracking: Each record represents a snapshot of parameters at a specific time, ensuring a historical trail.
Dimension Tables
sku_dimension Table Stores metadata about the products (SKUs).
| Column Name | Data Type | Description |
|---|---|---|
| sku_id | INT | Primary key |
| sku_name | VARCHAR | Name of the SKU/product |
| category | VARCHAR | Product category (e.g., Electronics). |
| … | … | … |
region_dimension Table Contains information about regions or markets.
| Column Name | Data Type | Description |
|---|---|---|
| region_id | INT | Primary key |
| region_name | VARCHAR | Name of the region (e.g., West Java) |
| region_code | VARCHAR | Code or abbreviation for the region |
| … | … | … |
time_dimension Table Provides a time-based reference for daily, weekly, and monthly aggregations.
| Column Name | Data Type | Description |
|---|---|---|
| date_id | INT | Primary key (YYYYMMDD format) |
| date | DATE | Full date (YYYY-MM-DD) |
| day | INT | Day of the month |
| … | … | … |
Relationships
The tables are connected via foreign keys:
prarameter_fact.sku_id→sku_dimension.sku_idprarameter_fact.region_id→region_dimension.region_idprarameter_fact.date_id→time_dimension.date_idsku_dimension.supplier_id→supplier_dimension.supplier_id
Data Flow and ETL Considerations
Source to Target Mapping:
- Extract actual parameters and historical records from transactional tables.
- Transform data by aggregating parameters and calculating bottom parameters.
- Load into the
parameters_facttable and update relevant dimensions.
Incremental Loading:
- Daily updates for new parameters and changes in historical records.
- Implement Slowly Changing Dimensions (SCD Type 2) for tracking changes in dimensions like
sku_dimensionorregion_dimension.
Transformation Logic
Data Cleansing:
- Standardize parameters, remove outliers, handle missing values.
Aggregation Rules:
- Define how data will be aggregated at different levels (e.g., averaging for time periods, lowest parameters).
Historical Tracking:
- Ensure historical changes in parameters are tracked using slowly changing dimensions or versioning.
Performance Considerations
Indexing:
- Index SKU, region, and date columns to optimize query performance.
Partitioning:
- Partition data by region and time period for efficient data retrieval.
Example Queries
Query 1: Get the historical trend of the bottom selling price for a specific SKU in a region.
SELECT date, bottom_selling_price
FROM price_fact
JOIN sku_dimension ON price_fact.sku_id = sku_dimension.sku_id
JOIN region_dimension ON price_fact.region_id = region_dimension.region_id
WHERE sku_name = 'Product A' AND region_name = 'West Java'
ORDER BY date;
Query 2: Calculate the average selling price for each SKU in a given month.
SELECT sku_name, AVG(actual_selling_price) AS avg_selling_price
FROM price_fact
JOIN sku_dimension ON price_fact.sku_id = sku_dimension.sku_id
JOIN time_dimension ON price_fact.date_id = time_dimension.date_id
WHERE month = 10 AND year = 2024
GROUP BY sku_name;
Security and Access Control
Data Access:
- Define user roles and permissions (e.g., read-only access for analysts, write access for data engineers).
Data Sensitivity:
- Handling of sensitive pricing information, especially PII data.
Testing and Validation
Test Scenarios:
- Data consistency checks, historical parameters accuracy validation, region-wise aggregations.
Acceptance Criteria:
- Data accuracy should meet business requirements, performance benchmarks for query speed.
MART_xx SCHEMA
Define Key Metrics and Definitions 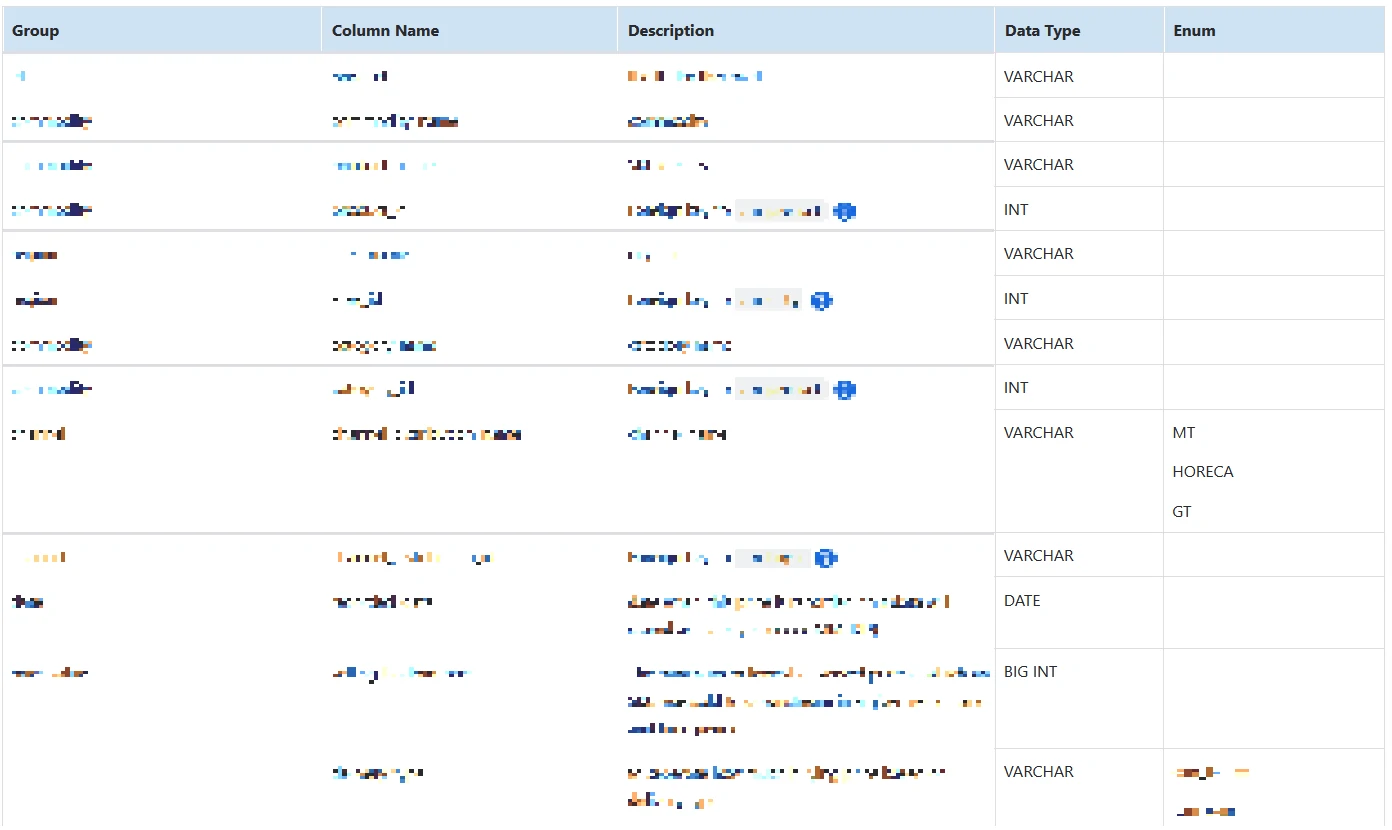
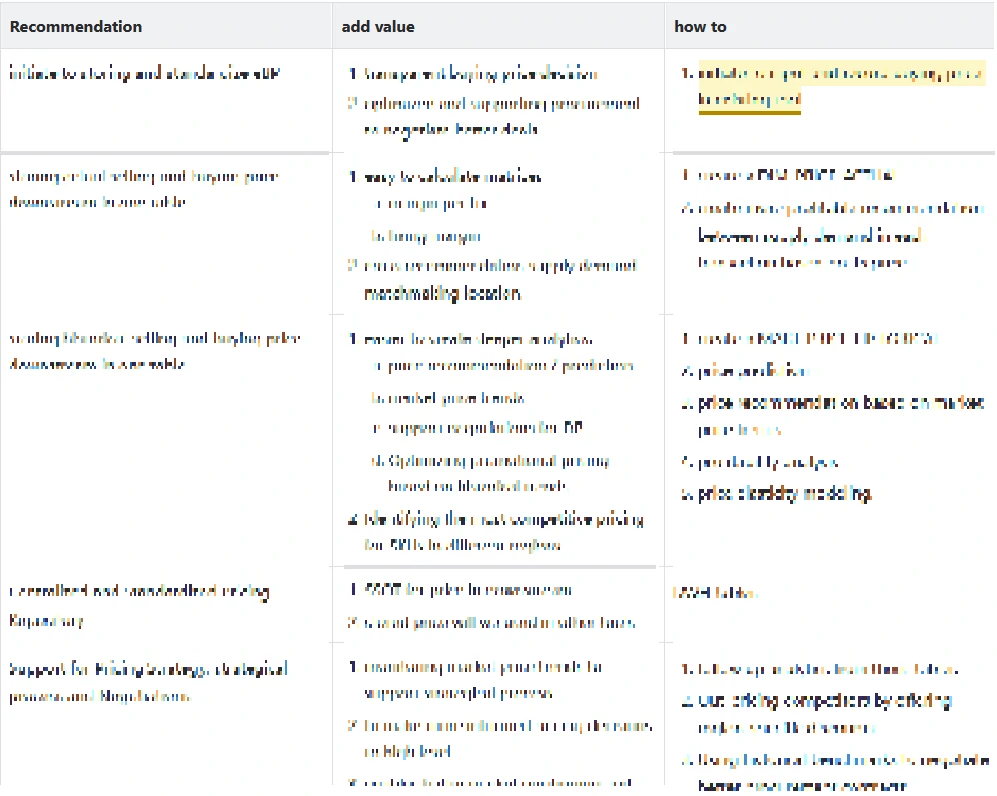
Recommendation and Added Values
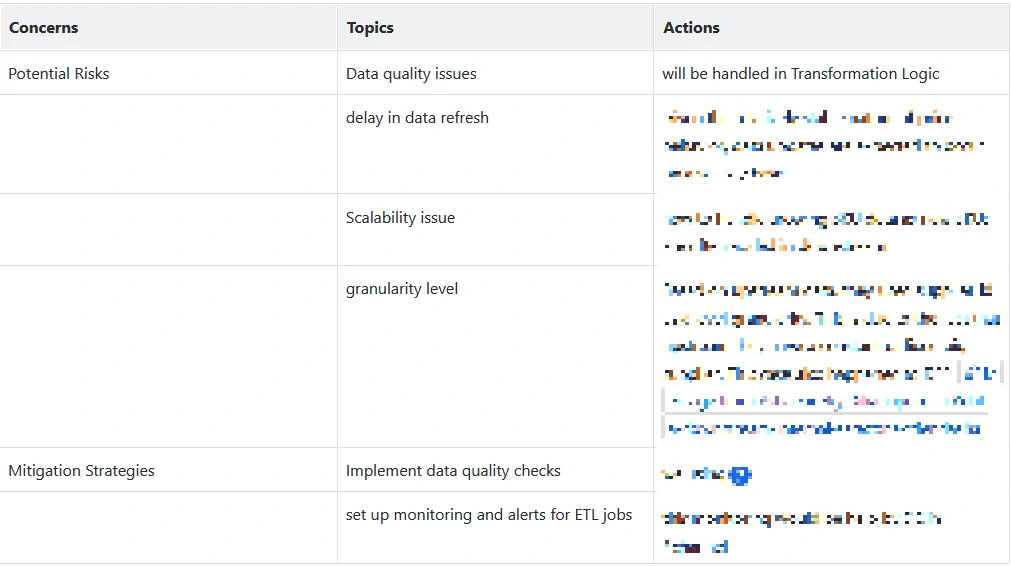
Risks and Mitigation
Stakeholders