Generating Grid area
Dataset
Load dataset
First, we load a dataset containing accident record with high detail about location, times, roads intercross, detail rural area around that accident.
accident_data = pd.read_csv(r'..\map\Accidents_2015.csv')
accident_data = accident_data.sample(n=1000, random_state=None)
accident_data.dropna(subset=["Latitude", "Longitude"], inplace=True)
accident_data = accident_data.reset_index(drop=True)

geometry = [Point(xy) for xy in zip(accident_data.Latitude, accident_data.Longitude)]
accident_data = gpd.GeoDataFrame(accident_data, geometry=geometry, crs="EPSG:4326")
| Accident_Index | Location_Easting_OSGR | Location_Northing_OSGR | Longitude | Latitude | Police_Force | Accident_Severity | Number_of_Vehicles | Number_of_Casualties | Date | Day_of_Week | Time | Local_Authority_(District) | Local_Authority_(Highway) | 1st_Road_Class | 1st_Road_Number | Road_Type | Speed_limit | Junction_Detail | Junction_Control | 2nd_Road_Class | 2nd_Road_Number | Pedestrian_Crossing-Human_Control | Pedestrian_Crossing-Physical_Facilities | Light_Conditions | Weather_Conditions | Road_Surface_Conditions | Special_Conditions_at_Site | Carriageway_Hazards | Urban_or_Rural_Area | Did_Police_Officer_Attend_Scene_of_Accident | LSOA_of_Accident_Location | geometry | |
|---|---|---|---|---|---|---|---|---|---|---|---|---|---|---|---|---|---|---|---|---|---|---|---|---|---|---|---|---|---|---|---|---|---|
| 0 | 201501HT20994 | 535370 | 182030 | -0.050251 | 51.521 | 1 | 3 | 1 | 1 | 07/11/2015 | 7 | 21:00 | 5 | E09000030 | 3 | 11 | 6 | 30 | 3 | 2 | 4 | 121 | 0 | 5 | 4 | 1 | 2 | 0 | 0 | 1 | 1 | E01004290 | POINT (51.520973 -0.050251) |
| 1 | 201504WA15499 | 334010 | 433730 | -3.00329 | 53.7957 | 4 | 1 | 2 | 1 | 09/12/2015 | 4 | 23:11 | 71 | E06000009 | 3 | 5230 | 3 | 70 | 1 | 4 | 3 | 583 | 0 | 0 | 4 | 2 | 2 | 0 | 0 | 1 | 1 | E01012688 | POINT (53.795674 -3.003287) |
| 2 | 2015132A80678 | 423223 | 410602 | -1.65063 | 53.5915 | 13 | 3 | 1 | 1 | 08/10/2015 | 5 | 09:10 | 203 | E08000034 | 4 | 6116 | 6 | 30 | 8 | 4 | 6 | 0 | 0 | 1 | 1 | 1 | 1 | 0 | 0 | 2 | 2 | E01011113 | POINT (53.591487 -1.650627) |
| 3 | 201506K003369 | 373360 | 406620 | -2.4036 | 53.5555 | 6 | 3 | 1 | 1 | 27/06/2015 | 7 | 19:30 | 100 | E08000001 | 5 | 0 | 6 | 30 | 0 | -1 | -1 | 0 | 0 | 0 | 1 | 1 | 1 | 0 | 0 | 1 | 2 | E01004857 | POINT (53.555523 -2.403599) |
| 4 | 201531C234515 | 456392 | 345659 | -1.16108 | 53.0053 | 31 | 3 | 1 | 1 | 07/11/2015 | 7 | 11:48 | 346 | E06000018 | 6 | 0 | 6 | 30 | 0 | -1 | -1 | 0 | 0 | 1 | 1 | 2 | 2 | 0 | 0 | 1 | 1 | E01013849 | POINT (53.005285 -1.161076) |
The Code
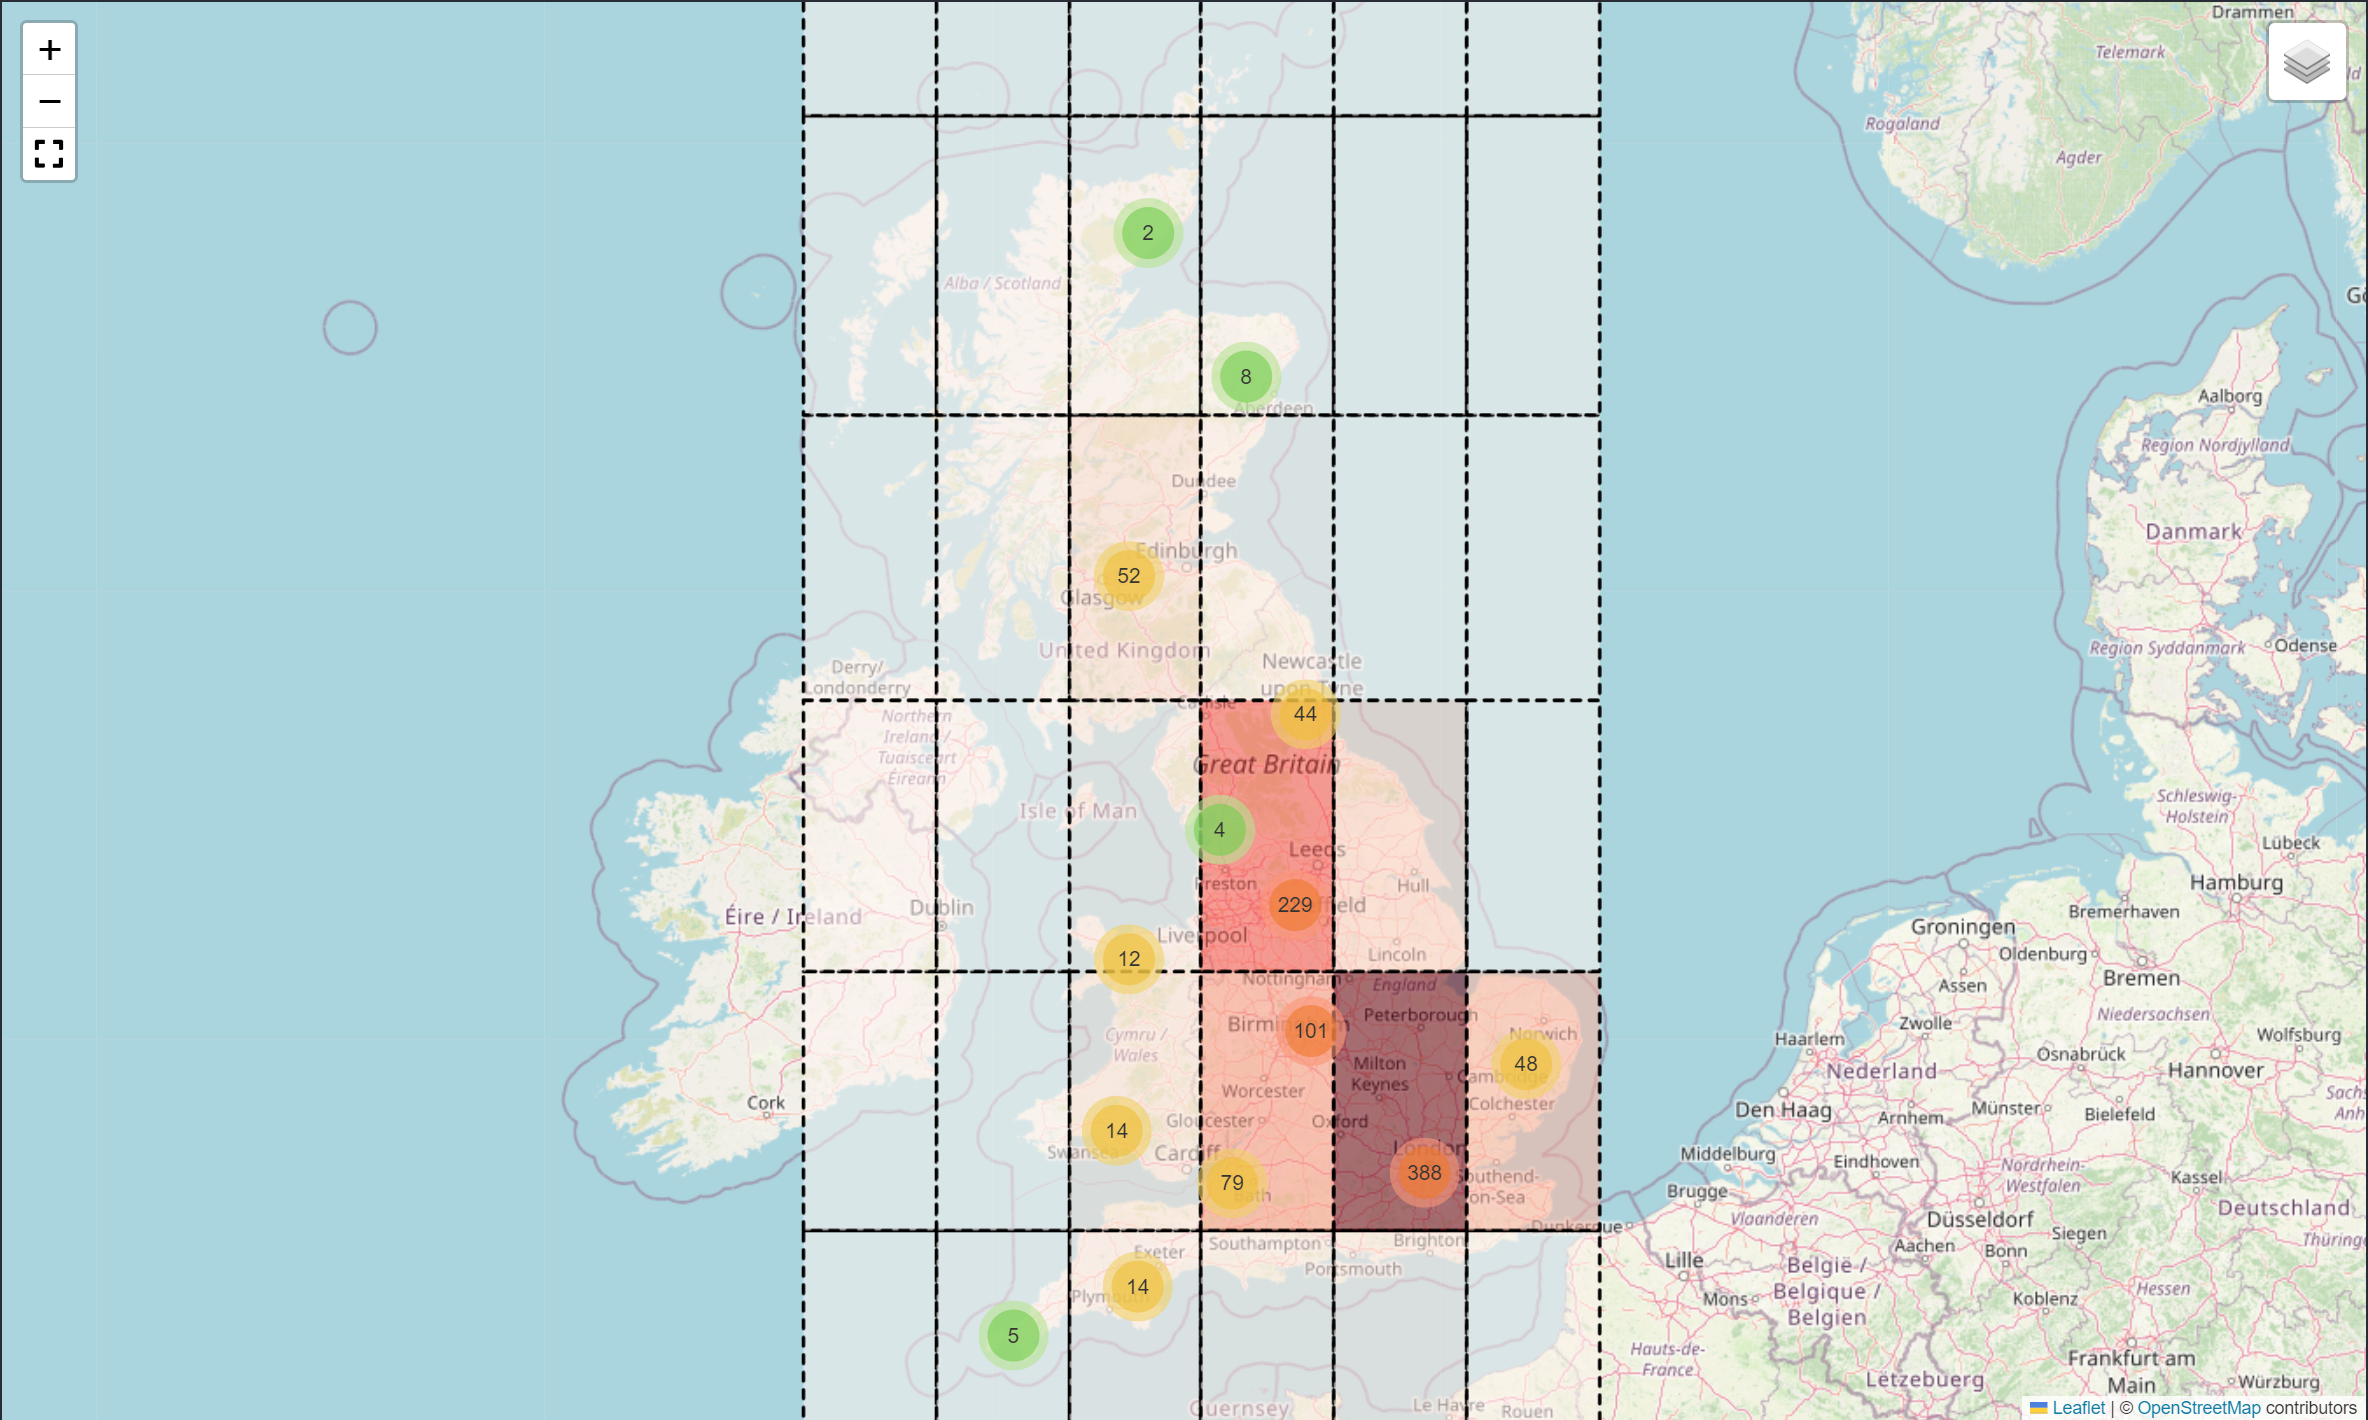
By calling maps.get_grid, we can generate grid with 2 types of outputs, geojson or array format. Both of this output needed for difference condition and analysis.
result = maps.get_grid(main_data, upper_right=None, lower_left=None, n=6, col_list=['Latitude','Longitude'], type_='geojson')
This function requires the following parameters:
- main_data (
geodataframe): Data location and value - upper_right (
float): upper right on boundary - lower_left (
float): lower left on boundary - n (
int): interval - col_list (
list): longitude and latitude columns name - type_ (
string): output type
The result for Json output
[{'type': 'FeatureCollection',
  'properties': {'lower_left': [-2.461976, 55.132204],
   'upper_right': [-1.2882623333333332, 56.3643015]},
  'features': [{'type': 'Feature',
    'geometry': {'type': 'Polygon',
     'coordinates': [[[-2.461976, 56.3643015],
       [-1.2882623333333332, 56.3643015],
       [-1.2882623333333332, 55.132204],
       [-2.461976, 55.132204],
       [-2.461976, 56.3643015]]]}}]},
 {'type': 'FeatureCollection',
  'properties': {'lower_left': [-1.2882623333333332, 55.132204],
   'upper_right': [-0.11454866666666641, 56.3643015]},
  'features': [{'type': 'Feature',
    'geometry': {'type': 'Polygon',
     'coordinates': [[[-1.2882623333333332, 56.3643015],
       [-0.11454866666666641, 56.3643015],
       [-0.11454866666666641, 55.132204],
       [-1.2882623333333332, 55.132204],
       [-1.2882623333333332, 56.3643015]]]}}]},
 {'type': 'FeatureCollection',
  'properties': {'lower_left': [-0.11454866666666641, 55.132204],
   'upper_right': [1.0591650000000004, 56.3643015]},
  'features': [{'type': 'Feature',
    'geometry': {'type': 'Polygon',
     'coordinates': [[[-0.11454866666666641, 56.3643015],
       [1.0591650000000004, 56.3643015],
       [1.0591650000000004, 55.132204],
       [-0.11454866666666641, 55.132204],
       [-0.11454866666666641, 56.3643015]]]}}]}]
The result for Array output
array([[50.09284 , -7.371592],
       [51.377747, -7.371592],
       [52.662654, -7.371592],
       [53.947561, -7.371592],
       [55.232468, -7.371592],
       [56.517375, -7.371592],
       [57.802282, -7.371592],
       [50.09284 , -5.856329],
       [51.377747, -5.856329],
       [52.662654, -5.856329],
])