Power BI 101
tools
simulation
power bi

Introduction
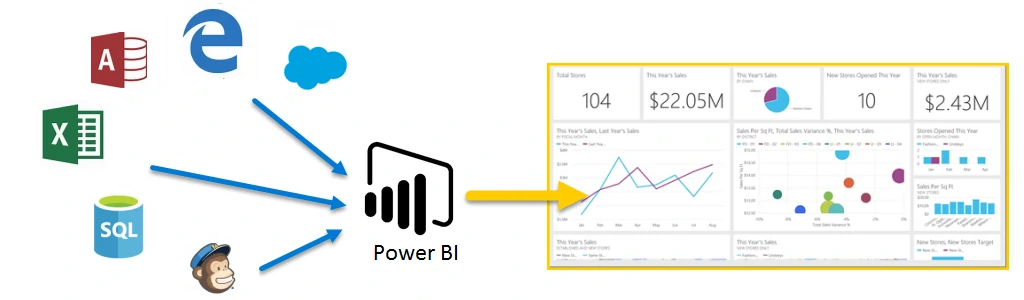
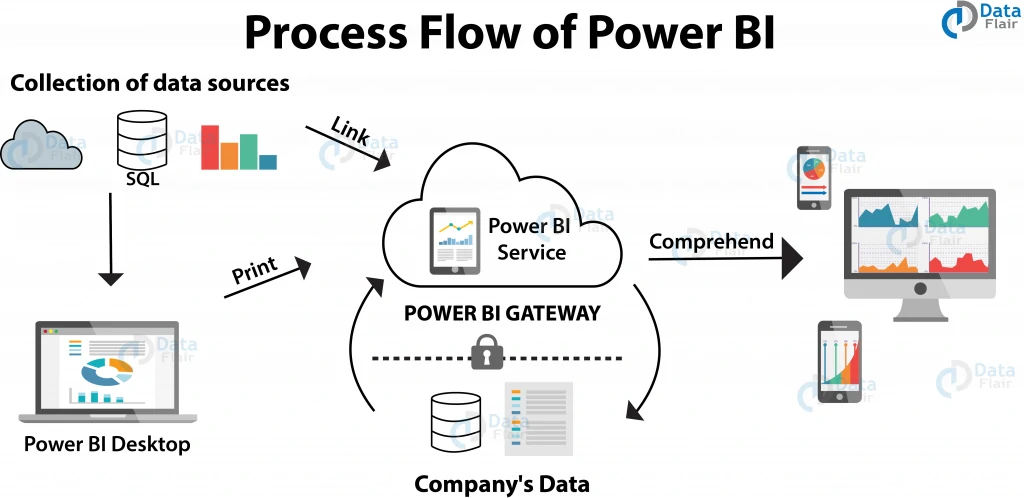
Microsoft Power BI is a collection of software services, apps, and connectors that work together to turn your unrelated sources of data into coherent, visually immersive, and interactive insights.
The parts of Power BI
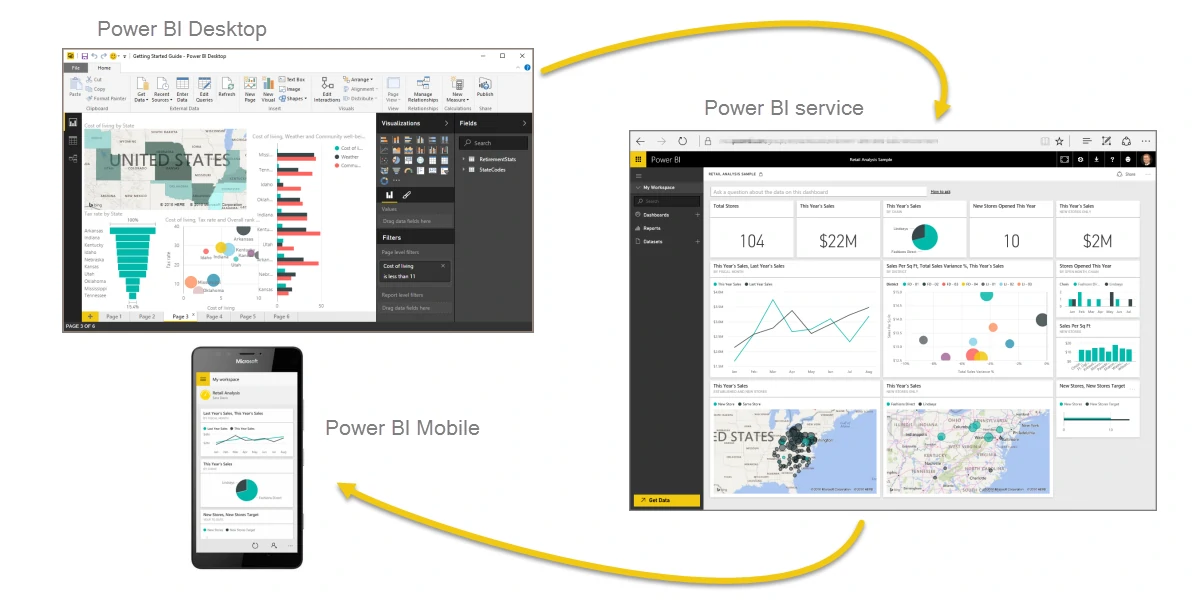
In order to create reports with Power BI, we must first understand the tools necessary. There are three primary components to Power BI:
- Power BI Desktop (desktop application)
- Power BI service (online platform) http://app.powerbi.com
- Power BI Mobile (cross-platform mobile app)(power BI link)
Common Workflow in Power BI:
- Connect to data with Power BI Desktop.
- Transform and model data with Power BI Desktop.
- Create visualizations and reports with Power BI Desktop.
- Publish report to Power BI service.
- Distribute and manage reports in the Power BI service.
- View and interact with shared dashboards and reports in Power BI service or Power BI Mobile.
Building blocks of Power BI
- Create a semantic model: A semantic model consists of all connected data, transformations, relationships, and calculations. (data modeling)
- Create visualizations in a report: Create a visualization, and add it to the canvas for a report page.
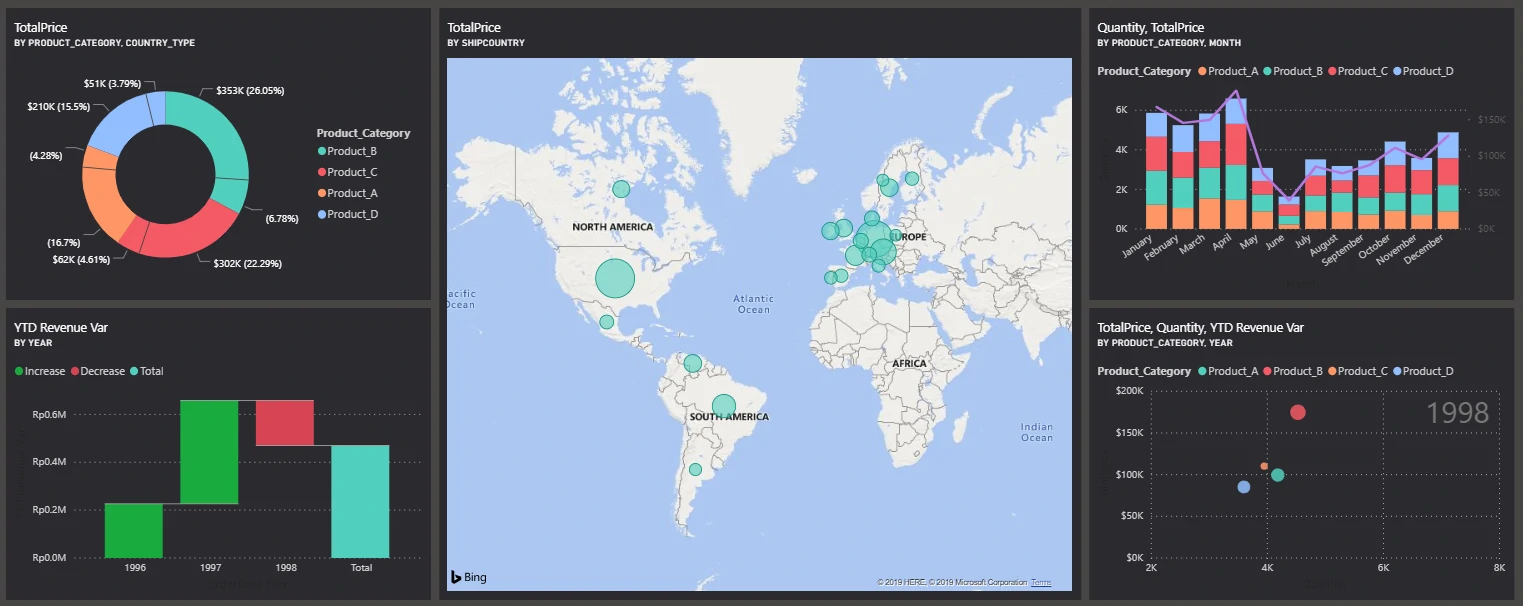
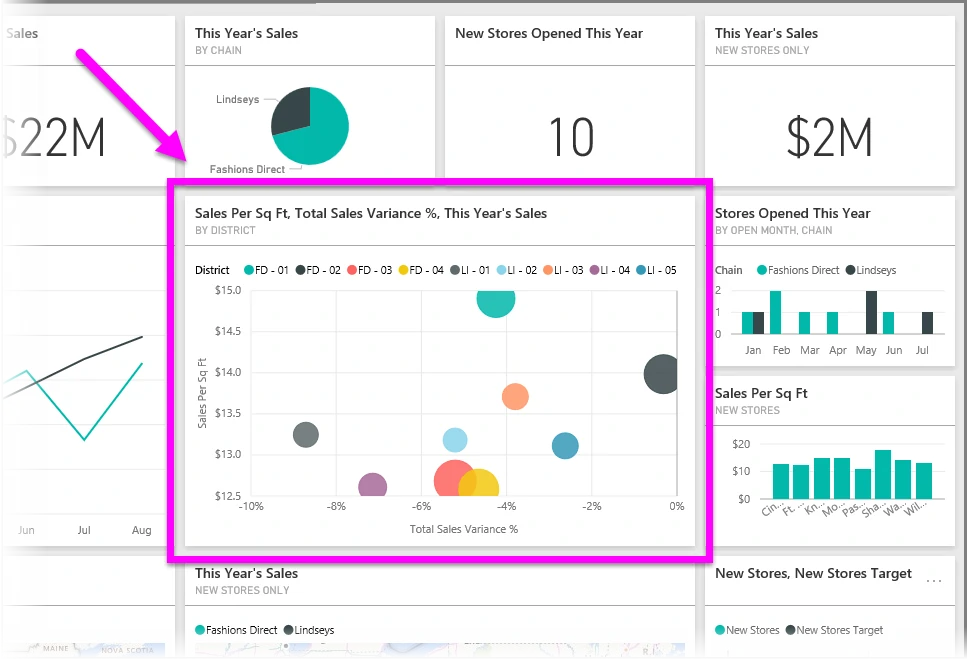
- Create a dashboard A collection of visuals from a single page that you can share with others.
Components
-
Dataset: a collection of data that Power BI uses to create its visualizations.
-
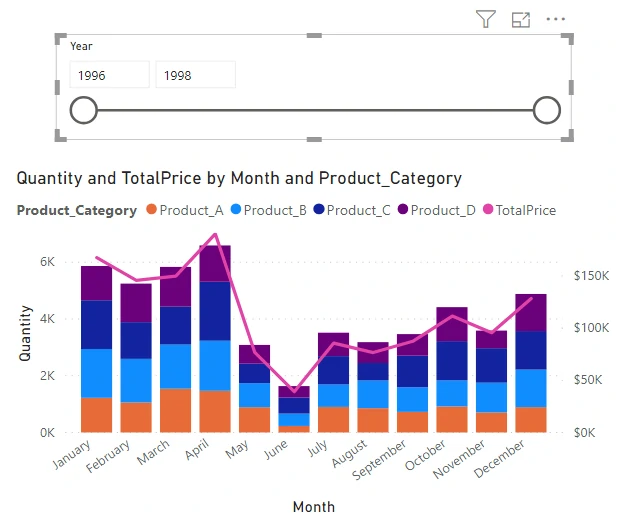
Visualization: a visual representation of data, like a chart, a color-coded map, or other interesting things you can create to represent your data visually.
-
Tile: a single visualization on a report or a dashboard. It’s the rectangular box that holds an individual visual.
-
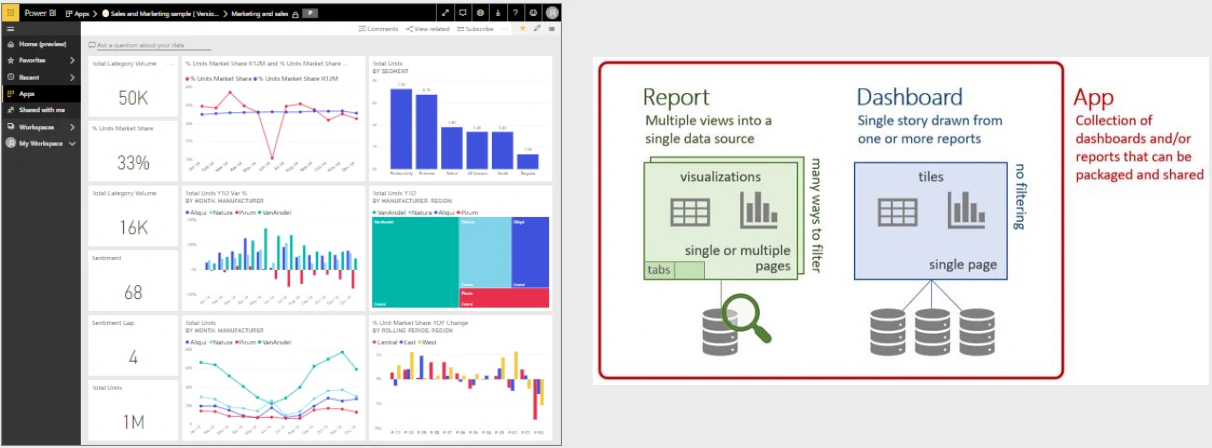
Report: a collection of visualizations that appear together on one or more pages.
-
Dashboard: a collection of visuals from a single page that you can share with others.
Summary of Power BI workflow
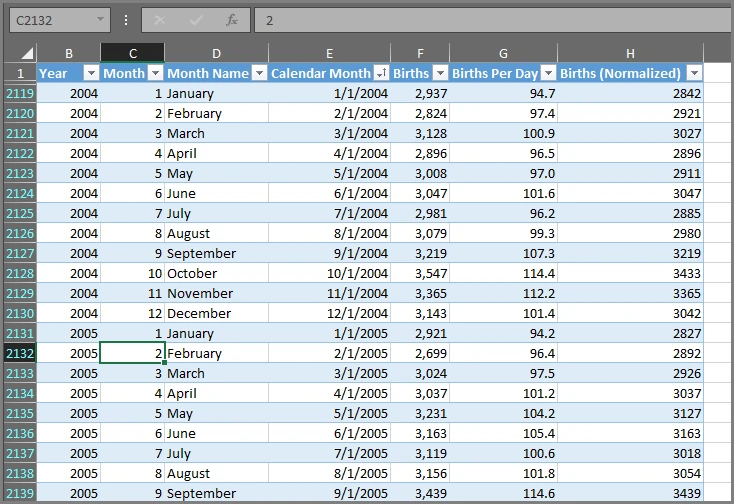
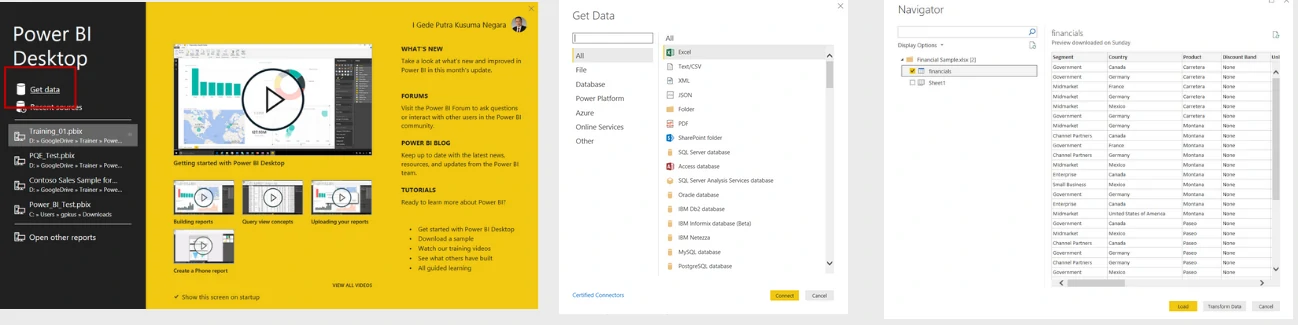
Get data with Power BI desktop
- Download excel file “Financial Sample.xlsx” from http://go.microsoft.com/fwlink/?LinkID=521962
-
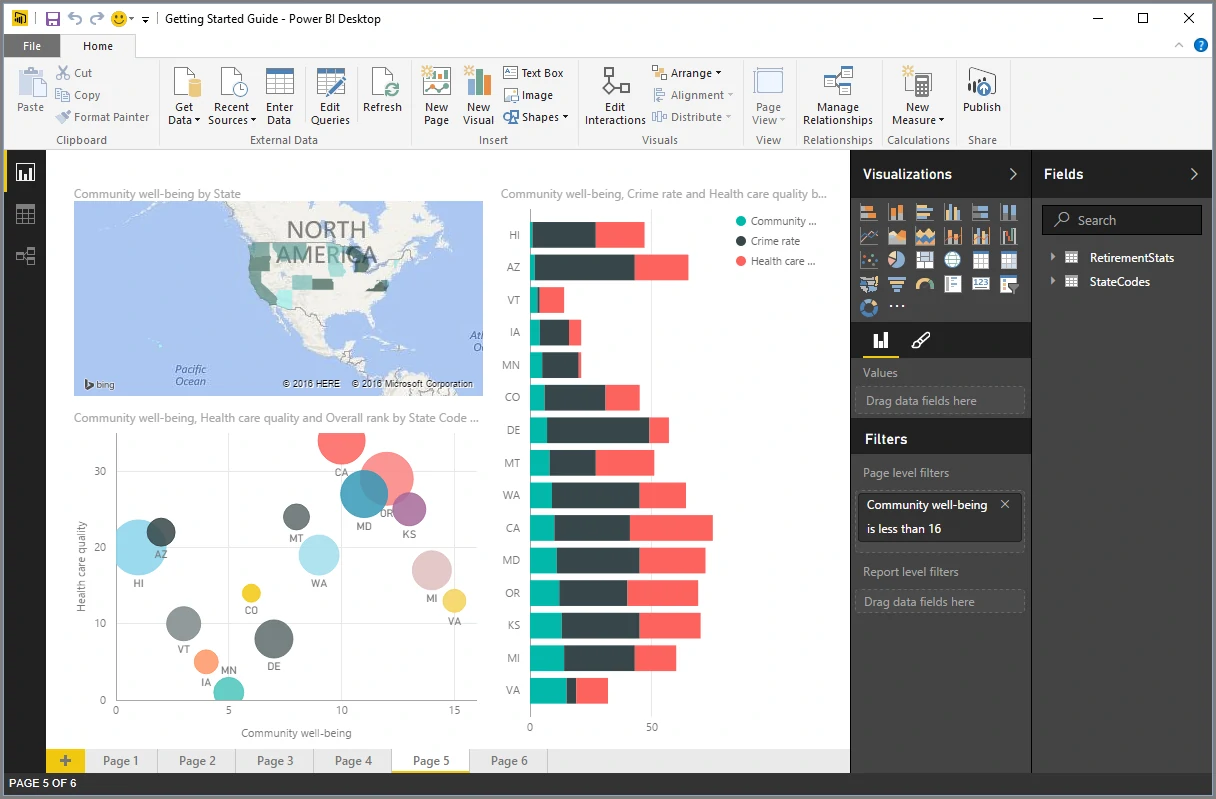
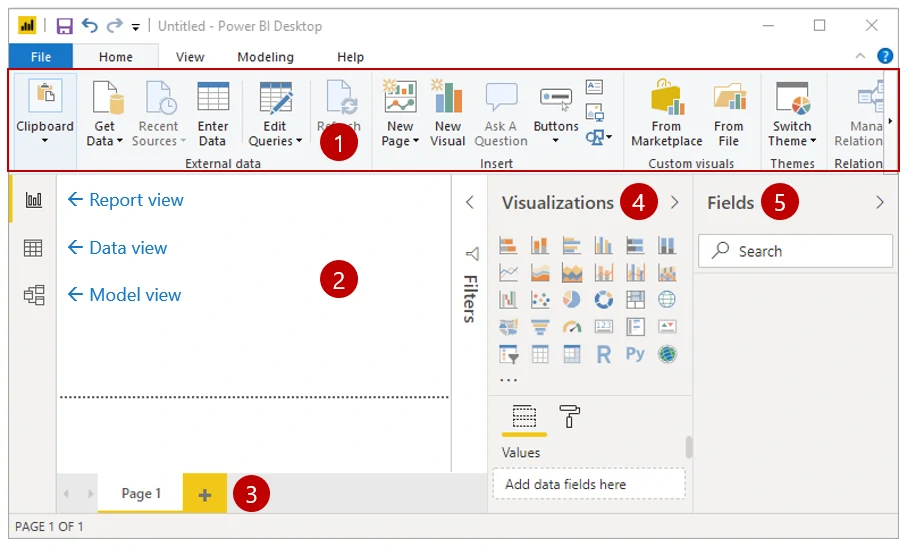
Launch Power BI Desktop and load the excel file:
- Ribbon - Displays common tasks that are associated with reports and visualizations.
- Report view, or canvas - Where visualizations are created and arranged. You can switch between Report, Data, and Model views by selecting the icons in the left column.
- Pages tab - Located along the bottom of the page, this area is where you would select or add a report page.
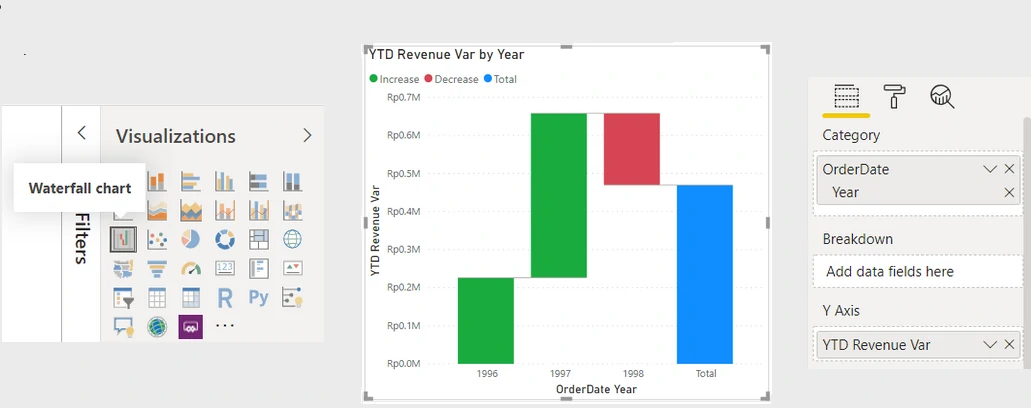
- Visualizations pane - Where you can change visualizations, customize colors or axes, apply filters, drag fields, and more.
-
Fields pane - Where query elements and filters can be dragged onto the Report view or dragged to the Filters area of the Visualizations pane.
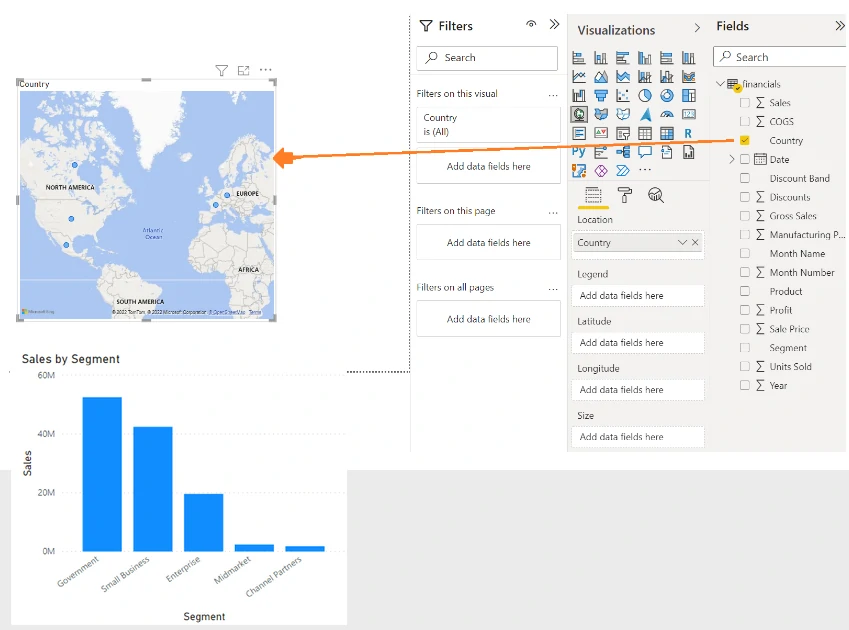
Create Report using Power BI Desktop
- Sales by Segment: select Sales and Segment fields or drag and drop into report canvas
-
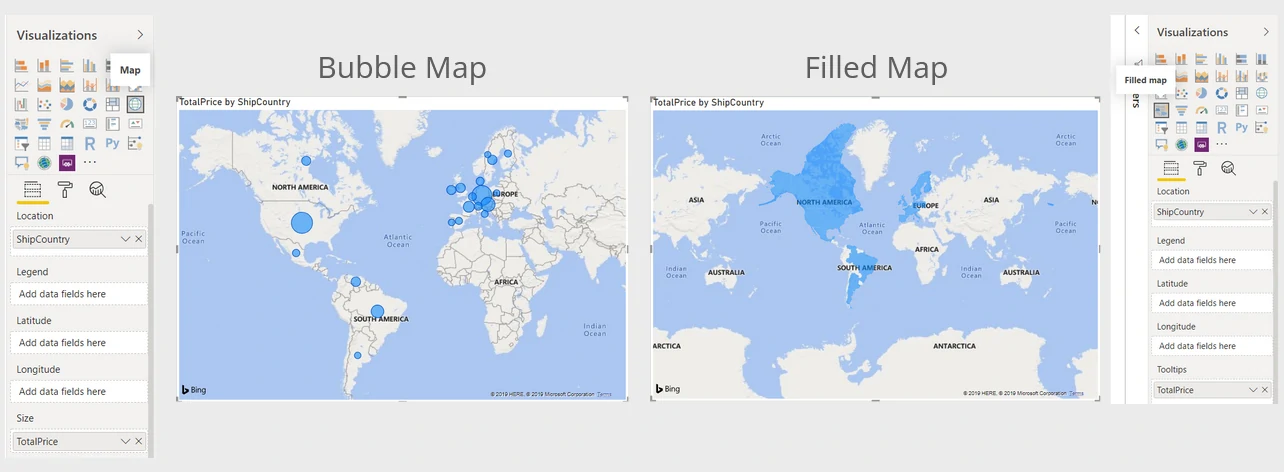
Sales by Country: select Map visualization and Sales and Country fields
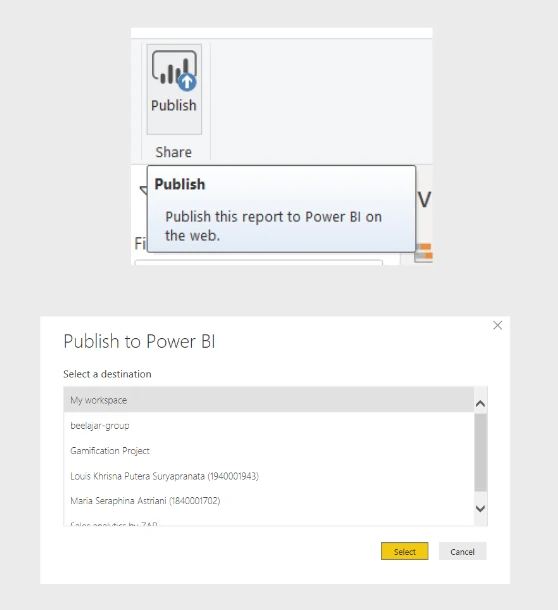
Publish Report to Power BI service
- Save report to file: File > Save
-
Publish report into “My workspace”:
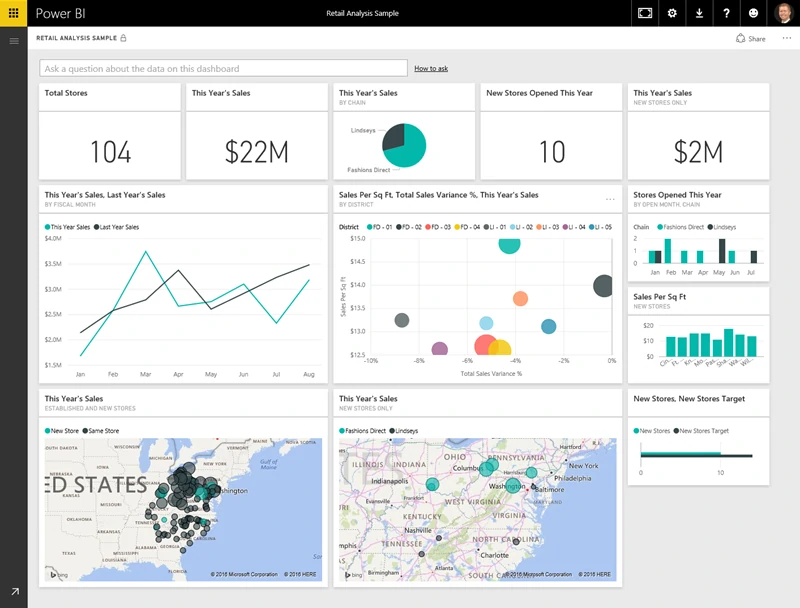
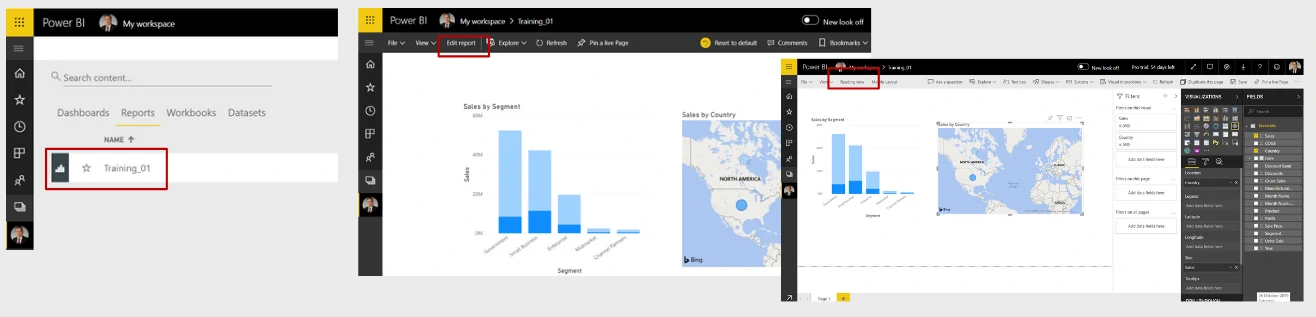
View or Edit Report in Power BI service
- Login to Power BI service: https://app.powerbi.com
- Go to Reports in My Workspace and select a report to view
- Select Edit report to edit it in Power BI service
-
Select Reading view to return to view mode.
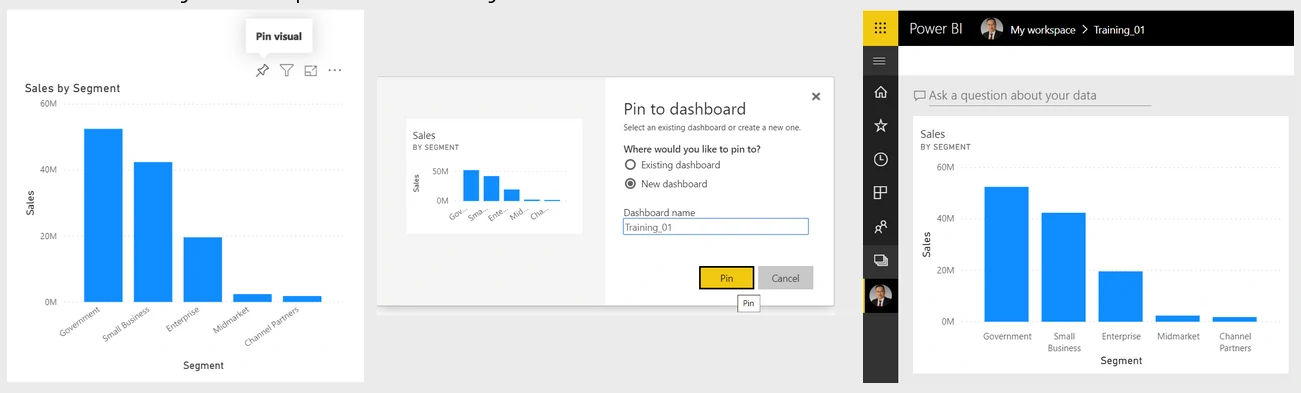
Build Dashboard in Power BI service
- From Reading view or Edit report mode, select Pin visual to add selected visual to a New or Existing dashboard
-
Go to My workspace to view your dashboard
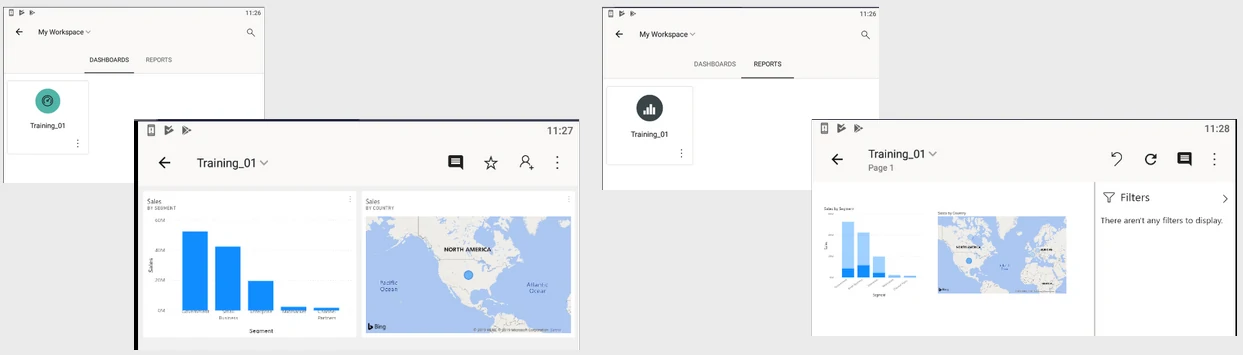
View Report and Dashboard in Power BI Mobile
- Launch Power BI Mobile app and login using your Power BI account
-
Go to My Workspace to open and view report or dashboard
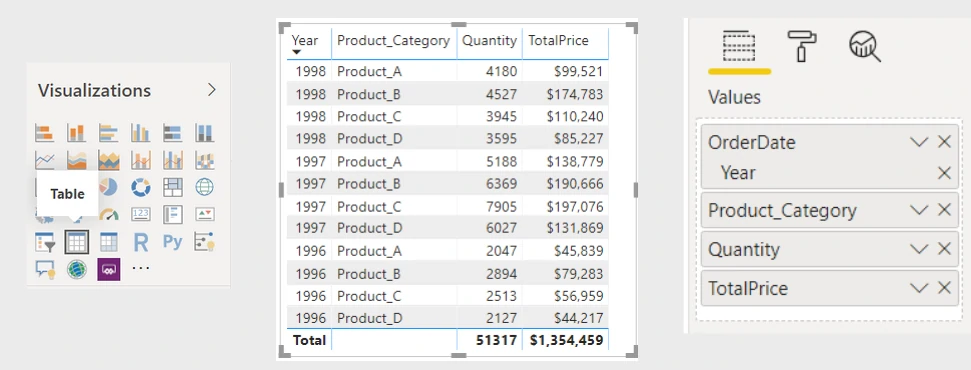
Use visuals in Power BI desktop
- Visuals allow you to present data in a compelling and insightful way.
- Visualizing data is one of the core parts and basic building blocks of Power BI.
- Creating visuals is one of the most effective ways to find and share your insights.
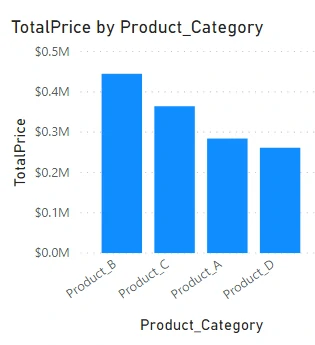
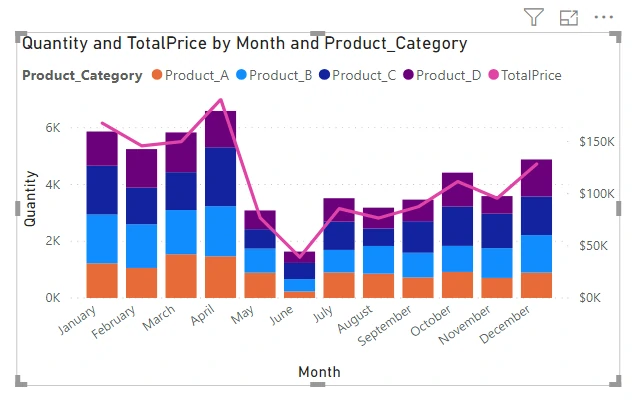
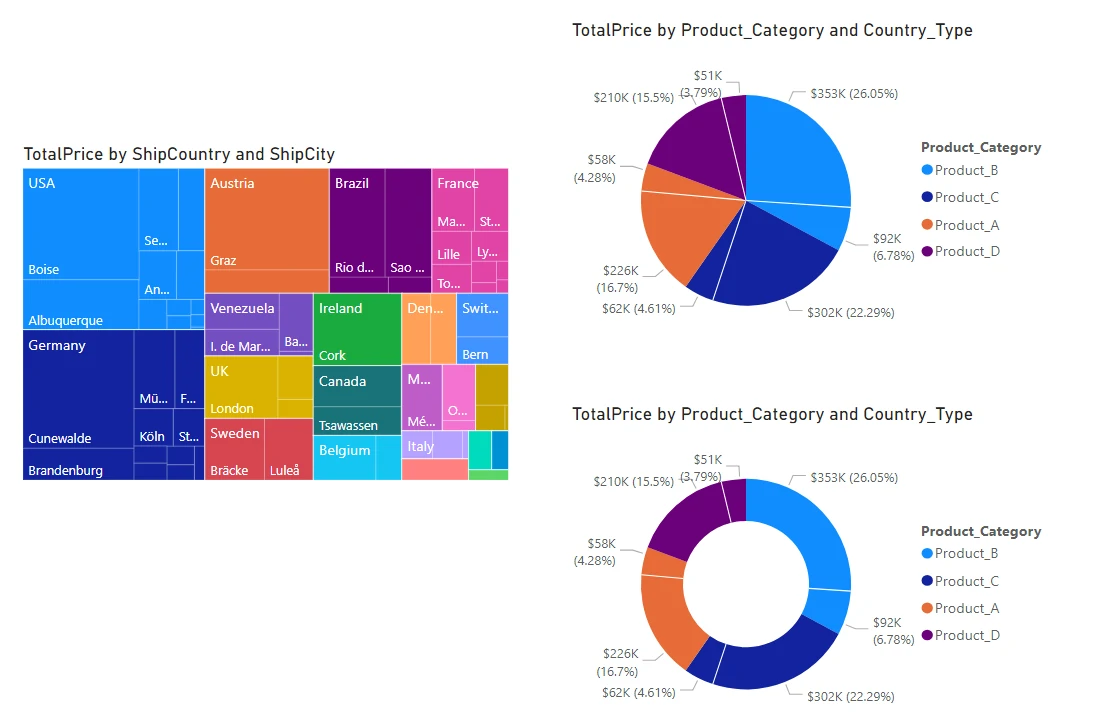
- You’ll discover a wide variety of visualizations in Power BI, which offers features such as simple bar charts, pie charts, maps, and many more.
- Power BI Desktop also offers extensive page formatting tools, such as shapes and images, that help bring your report to life.