Using PostGIS + DLT: Ingesting CSVs into a Medallion Architecture for spatial data.
data engineering
data modeling
Why This Matters?
How It Works
- PostGIS container:
- Runs a PostgreSQL database with PostGIS enabled for spatial operations.
- Using latest postgis image from the docker image official.
- Exposes a port to the host machine, making it accessible for queries and ingestion.
- Optimized with PostgreSQL parameters (
shared_buffers,work_mem, etc.) for better performance.
- ETL container with DLT:
- Using latest python:3.11-slim
- Add requirement libraries at this container
- Mounts your host’s CSV folder (
./warehouse_data) into the container. - Uses DLT (Data Load Tool) to extract data from these CSV files and load them into PostGIS.
- Acts as the orchestration layer for ingestion scripts, data quality checks, and dbt transformations (later in the pipeline).
- Workflow:
- Place
.csvfiles into thewarehouse_datafolder. - DLT scripts read and validate these files.
- The ETL container pushes them into the bronze schema of PostGIS.
- PostGIS now serves as the foundation for downstream dbt transformations into silver and gold tiers.
- Place
Purpose in the Medallion Architecture
- Bronze tier: Capture raw ingested data without modification.
- Silver tier (future step): Clean, validate, and harmonize the bronze data.
- Gold tier (future step): Curated datasets ready for analytics and reporting.
This setup focuses only on bronze ingestion, but it establishes the foundation for a full data warehouse lifecycle.
Advantages
- Reproducibility: Containers make the environment consistent across developers and deployments.
- Isolation: ETL logic is separated from the database, reducing conflicts.
- Scalability: Easy to extend with new containers (e.g., Airflow, DataHub, Metabase).
- Flexibility: DLT integrates with multiple sources beyond CSV (APIs, databases, cloud storage).
- Spatial support: PostGIS allows ingestion of spatial data types (points, polygons) alongside tabular CSVs.
Limitations
- Single-host setup: Running on one machine; not yet a distributed or production-grade cluster.
- Bronze-only: Data is raw; additional logic is required for validation and transformation (silver/gold tiers).
- Manual triggers: CSV ingestion requires placing files in a mounted folder (can be automated later).
- Resource-bound: PostgreSQL tuning depends on host machine specs; limited by Docker resource constraints.
Technology Details
- PostGIS: Extension to PostgreSQL that adds geospatial capabilities (spatial joins, projections, topology).
- DLT (Data Load Tool): Open-source Python framework for building declarative pipelines with minimal boilerplate.
- Docker Compose: Orchestrates multi-container workflows with a single configuration file.
- Volumes: Map host folders into containers for persistence (
pgdata) and ingestion (warehouse_data). - Networking: Both containers share a custom
data_network, enabling seamless communication.
Deep more about DBT (Data Build Tool)
DBT (Data Build Tool) is an essential open-source tool capable of transforming raw data into structured formats. It’s primarily focused on data transformation, transforming raw data into organized, meaningful data for analysis. While traditionally linked to the ELT (Extract, Load, Transform) paradigm – where data is first loaded into a data warehouse and then transformed – DBT doesn’t fully replace ELT or traditional ETL (Extract, Transform, Load) methods.
Instead, it significantly enhances the transformation stage by offering unparalleled flexibility, allowing us to repeatedly aggregate, normalize, and sort data without constantly updating your pipeline. In this way, DBT increases the efficiency and adaptability of data transformation, positioning itself as a critical component of modern data workflows.
Core advantage of using DBT
- Data Transformation using SQL - With DBT, data transformations are written in SQL, a language familiar to data analysts. This simplifies the process of transforming data, making it more accessible to teams that may lack deep technical expertise. DBT models allow you to write SQL select statements to build models that transform raw data into business-ready datasets.
- Reusability and Modularity - One of the primary benefits of DBT is its capability for data modeling, allowing for modular, reusable, and version-controlled SQL scripts that aid in building efficient data pipelines. Data transformation logic can be divided into smaller, manageable pieces, which integrate seamlessly with continuous integration pipelines, making the entire process more efficient.
- Continuous Integration and Deployment (CI/CD) - DBT enables continuous integration pipelines, ensuring that any changes in the data models are tested and verified before they go into production. This is in line with how software developers work, ensuring that production-grade data pipelines are robust and reliable.
Schema and Usage
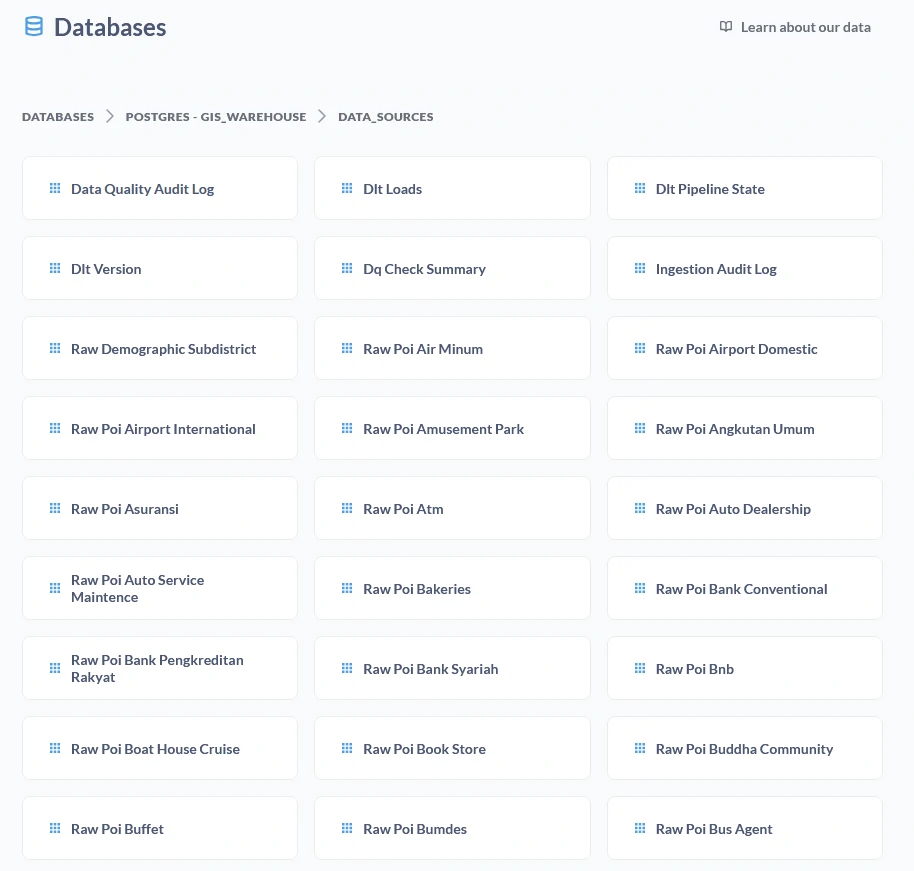
-
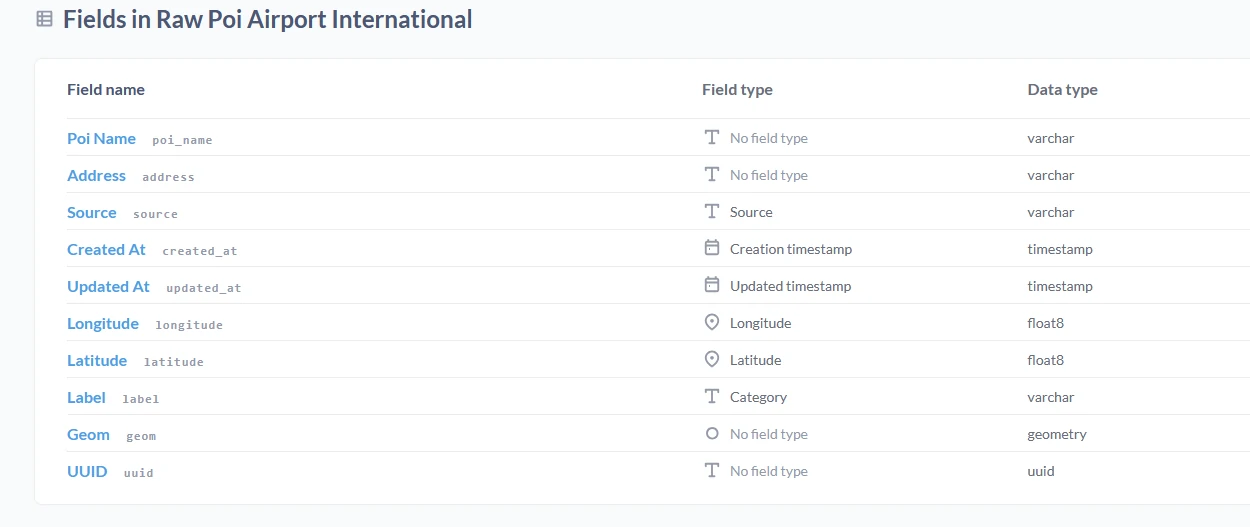
Bronze schema: All ingested CSV data lands here as-is, preserving original structure. Example:
bronze.poi_raw bronze.customer_transactions bronze.sensors_log -
How to use:
-
Drop CSV files into
./warehouse_data.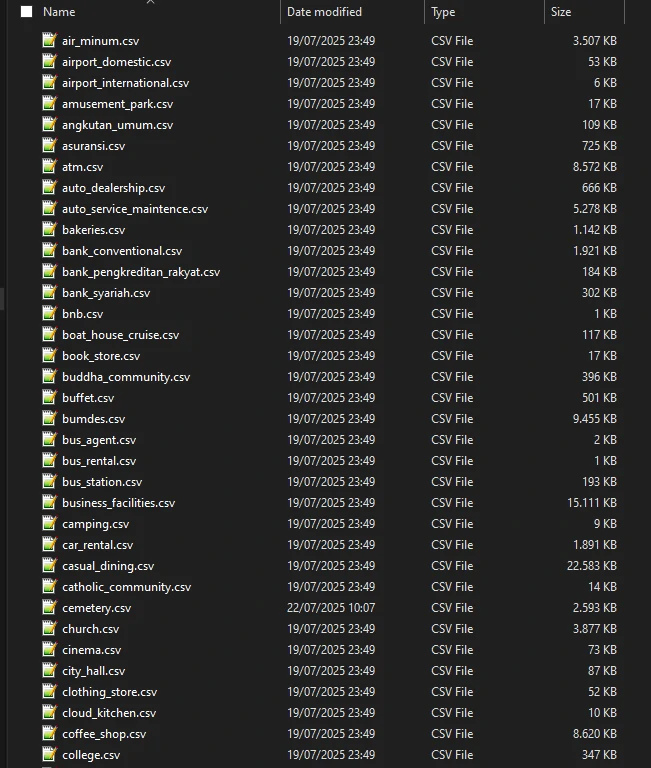
- Run DLT pipeline from ETL container. (it will be add to airflow scheduler for automation)
-
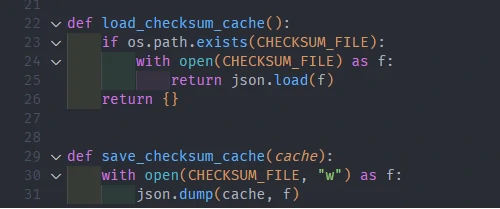
We add checksum checker to scalable out pipeline for new or updated data.
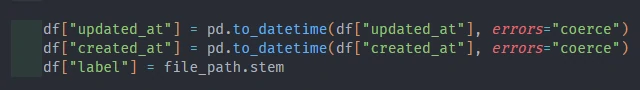
-
To standardize for datetime columns, we declare for existing datetime columns with datetime type.
- Additionally, we can give small transformation for our data to make it optimize for next steps, such as:
- Convert
xandytolongitudeandlatitude. - Generate geometry from
longitudeandlatitudevalue. And set geom at this column. - Generate UUID. This part is specific for data without an ID or primary key value. Other than that, this also could be used as a duplicate parameter to run a data quality process.
- Add Index and GIS index on columns (e.g.
updated_at,geom)
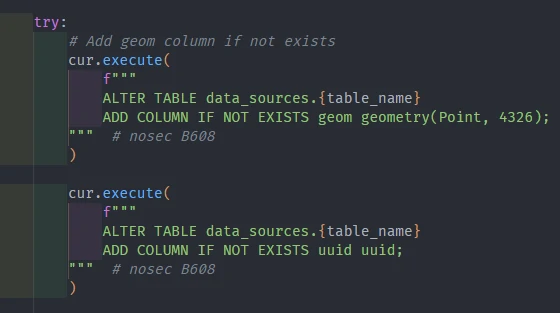
- Convert
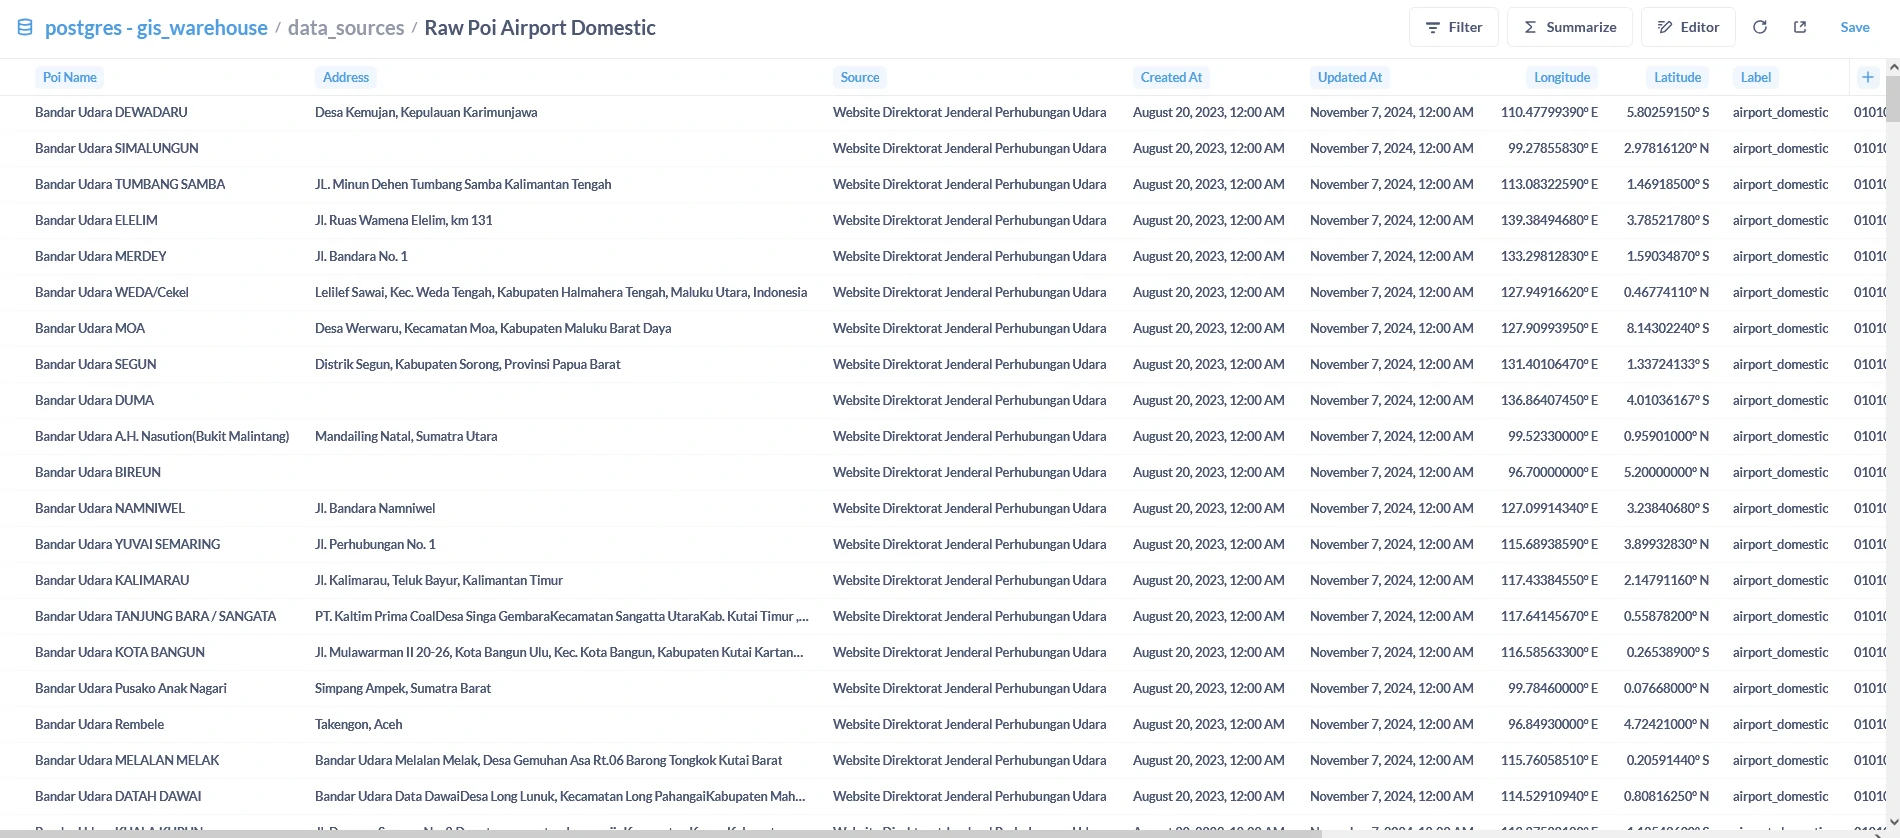
-
Query results in PostGIS via psql, pgAdmin, or any BI tool.
- We can use this pipeline concept to ingest other data such as:
- Administrative data in
.shpfile.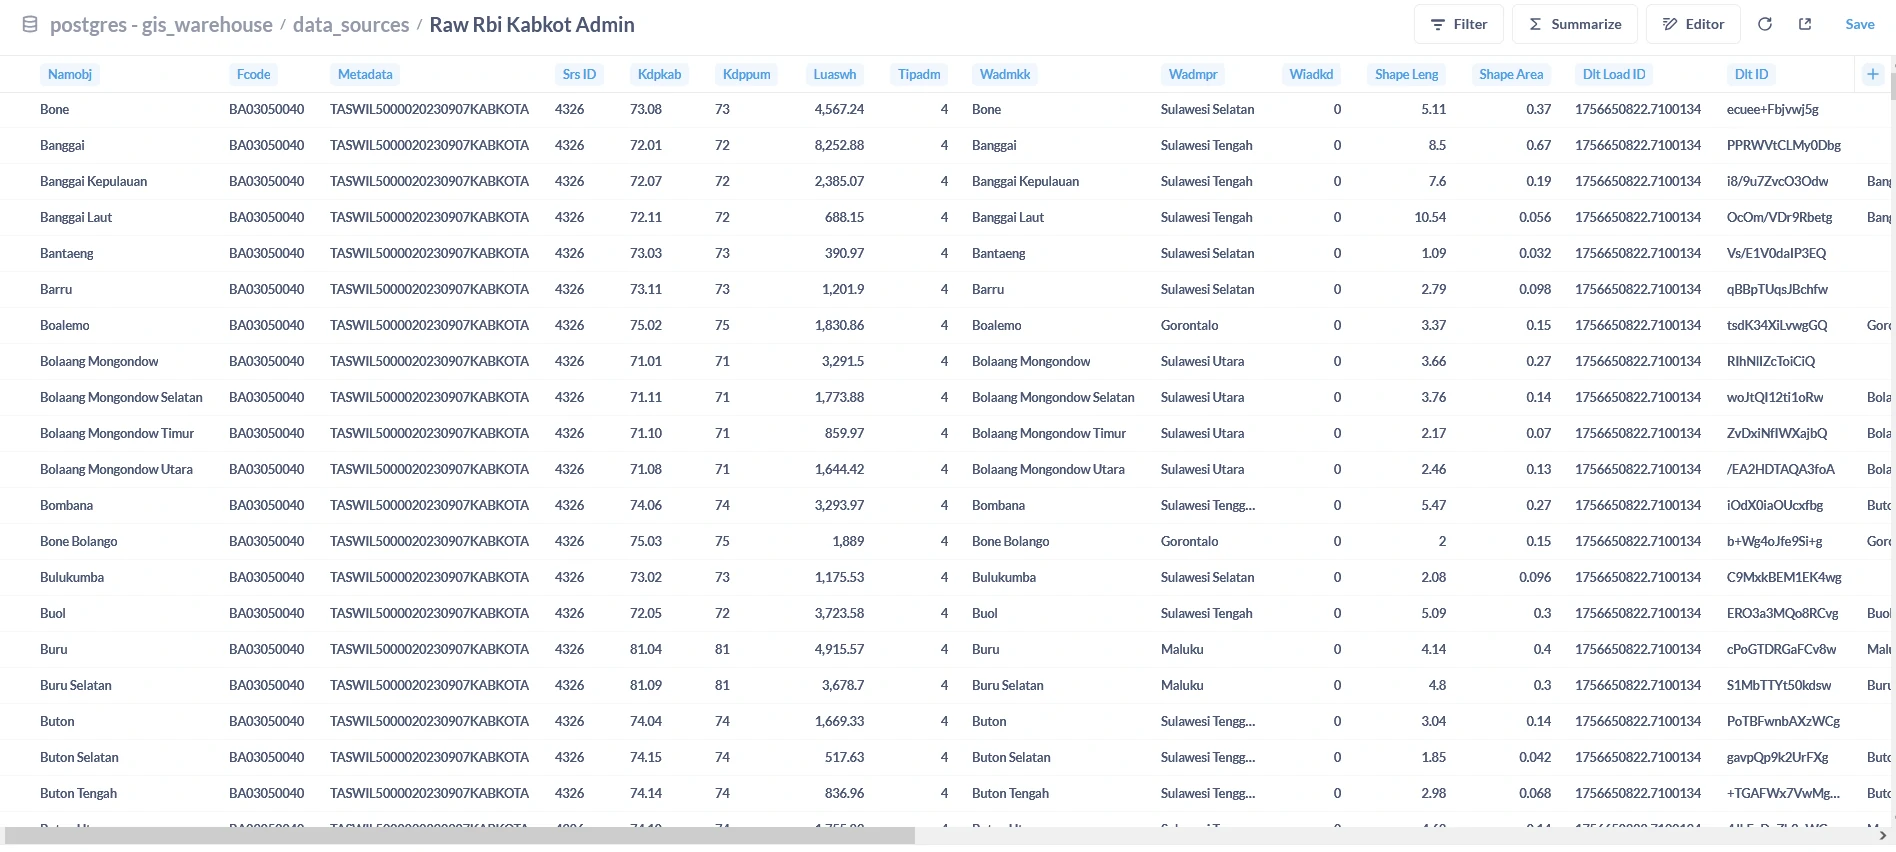
- Demographic data in
.jsonfile.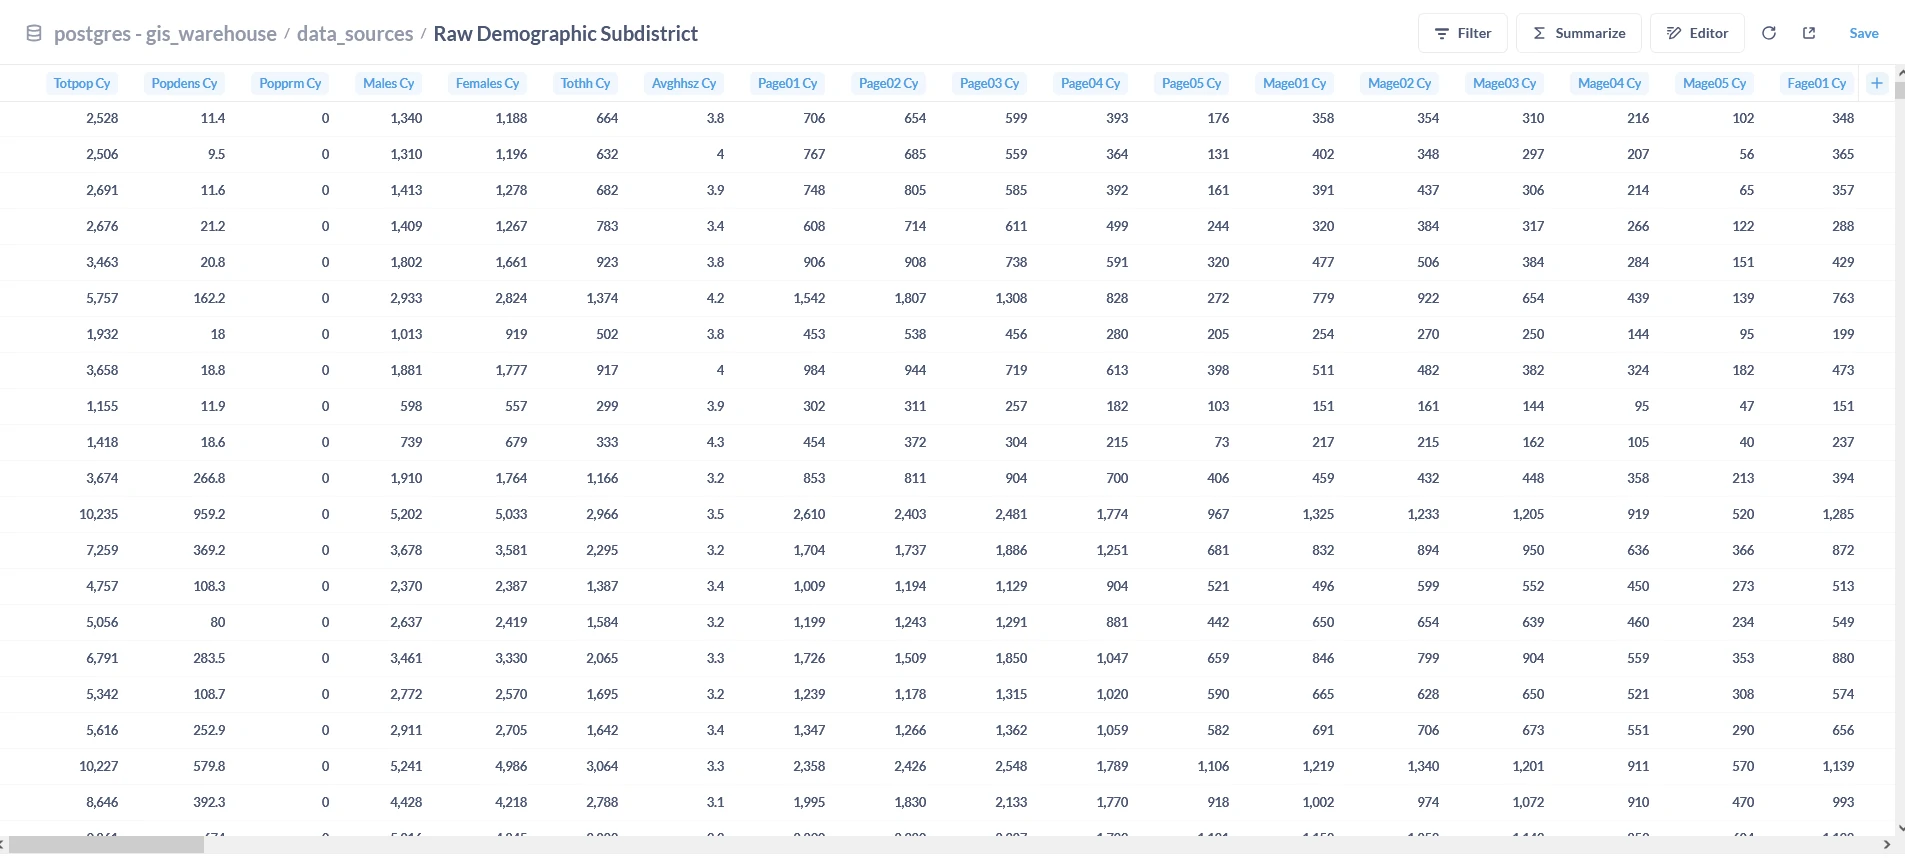
- Administrative data in
-
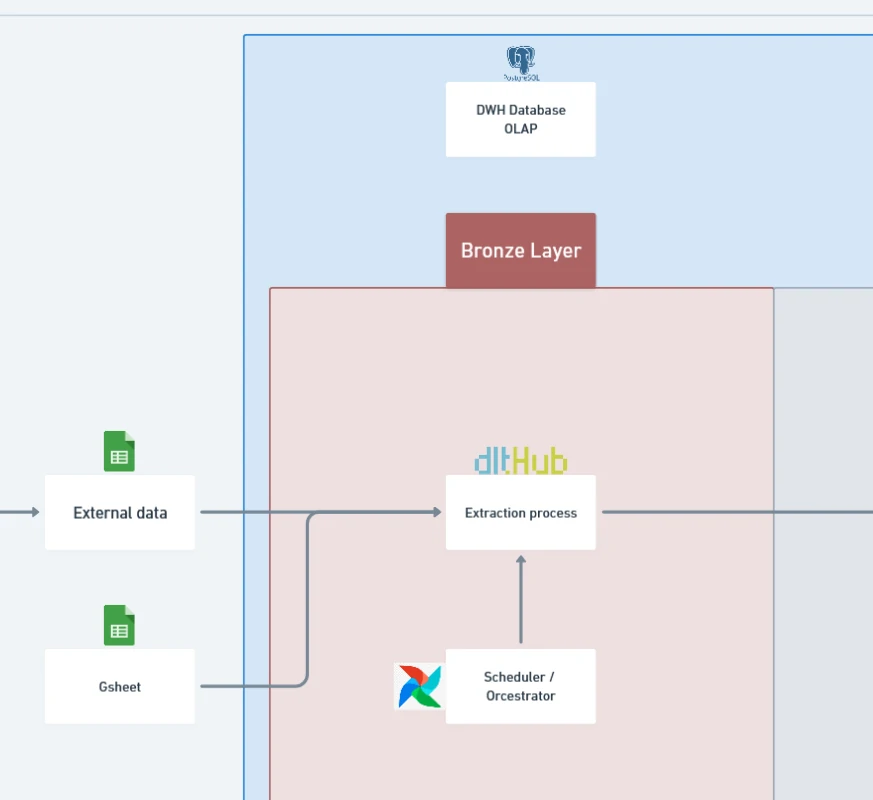
Architecture Overview
Future expansions could add:
- Airflow for orchestration
- dbt for transformations
- Metabase/PowerBI for analytics
- DataHub for metadata lineage
Final Thoughts
This setup may look simple at first glance—just two containers and a shared folder—but it establishes the foundation for a much larger data ecosystem. By using PostGIS and DLT inside Docker, you gain a repeatable and scalable way to bring raw files into your warehouse. This is the crucial bronze tier of the medallion architecture: where everything begins.
From here, you can grow the platform by layering in transformations (silver), curated business-ready data (gold), and orchestration tools to automate the flow end-to-end. The real strength of this design lies in its modularity: each container does one job well, and you can add or replace components without disrupting the whole system.
In short: start small, keep it clean, and build forward. This foundation ensures that every new step in your data journey is backed by a stable, reproducible process.