Additional Technic for Description Analysis
descriptive analytics
Dataset
Load dataset
we use simple and common titanic dataset from seaborn library.
df = sns.load_dataset("titanic")
| survived | pclass | sex | age | sibsp | parch | fare | embarked | class | who | adult_male | deck | embark_town | alive | alone | |
|---|---|---|---|---|---|---|---|---|---|---|---|---|---|---|---|
| 0 | 0 | 3 | male | 22 | 1 | 0 | 7.25 | S | Third | man | True | nan | Southampton | no | False |
| 1 | 1 | 1 | female | 38 | 1 | 0 | 71.2833 | C | First | woman | False | C | Cherbourg | yes | False |
| 2 | 1 | 3 | female | 26 | 0 | 0 | 7.925 | S | Third | woman | False | nan | Southampton | yes | True |
| 3 | 1 | 1 | female | 35 | 1 | 0 | 53.1 | S | First | woman | False | C | Southampton | yes | False |
| 4 | 0 | 3 | male | 35 | 0 | 0 | 8.05 | S | Third | man | True | nan | Southampton | no | True |
Support Value
Detail
Support value is well known in the context of association rule mining (like Apriori or market basket analysis).
Support measures how frequently a pattern appears in a dataset.
Support is used to:
- Filter out rare combinations (noise)
- Find “frequent itemsets”
- Build stronger rules later (with confidence & lift)
Support answers:
“How common is this pattern in the entire dataset?”
Simple process:
    support(X) = freq(X)/N(# of feature)
    support(X->Y) = freq(X join Y)/N(# of feature)
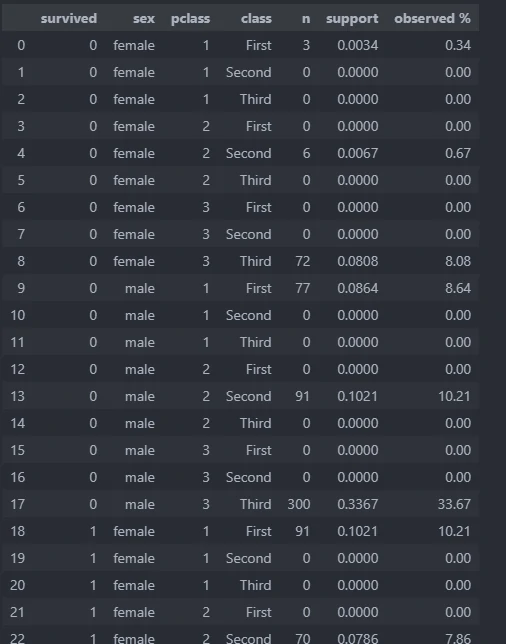
The support value means that this combination of values can be observed xx% of the time in the dataset.
The Code
By calling, describe.freq_unique_com we can generate Support value.
describe.freq_unique_com(main_data,col_list)
This function requires the following parameters:
- main_data (
dataframe): Data Input - col_list (
list): selected columns
The result