Some solutions for specific cases
Solutions
- Some solutions for specific cases
- Linear Optimization
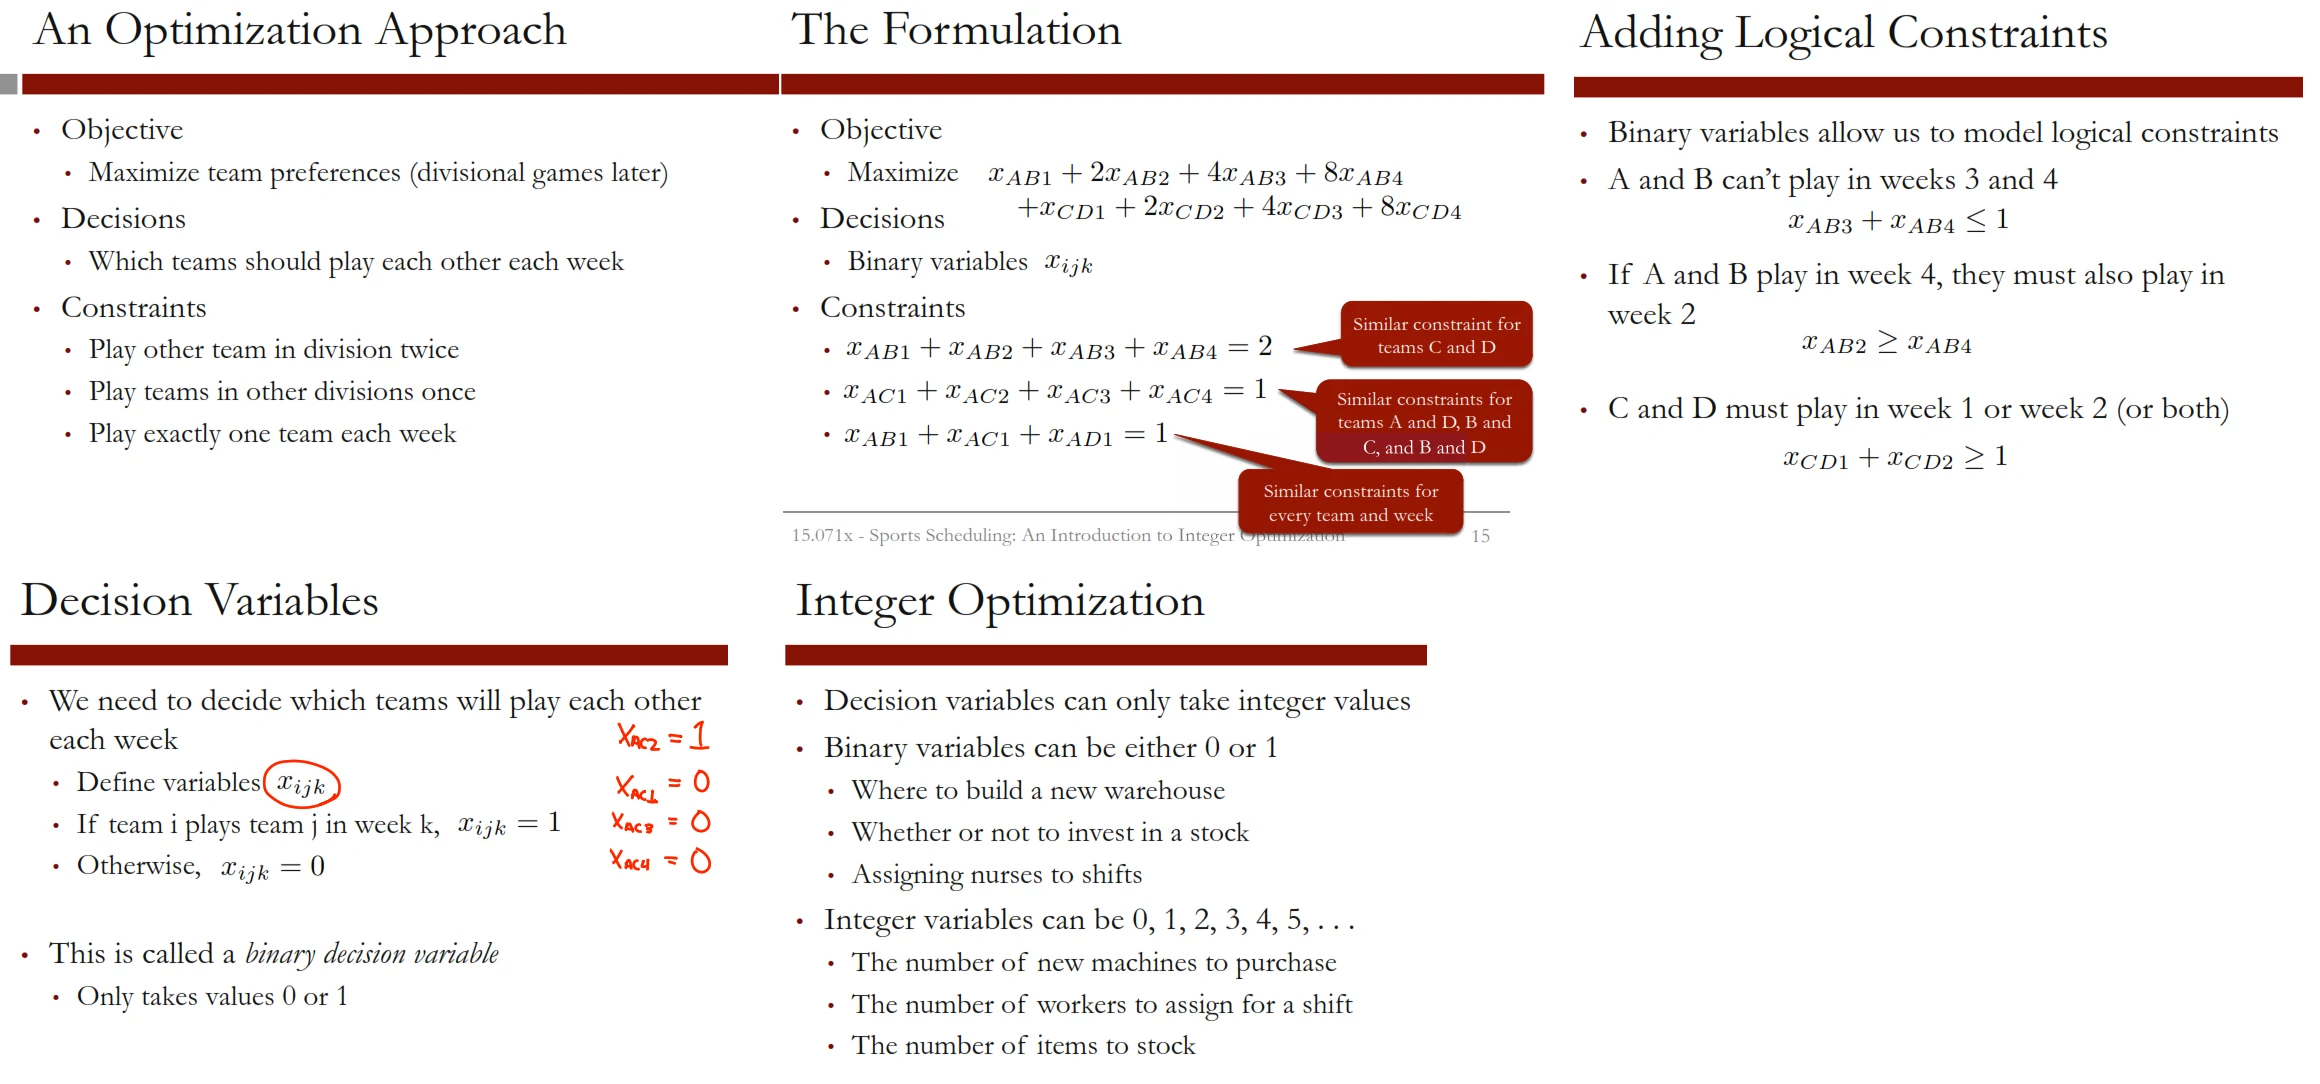
- Integer Optimization
- Spatial Development and Optimization
- Propensity / Churn / CLTV
- Recommendation System
- Demand-Supply (Supply Chain)
- Inventory and Warehouse
- Segmentation
- Marketing budget allocation
- Marketing strategic
- Market Research Analysis
- Anomaly and Fraud Detection
- Behavioral Modeling
- Ifluential Features
- Scoring
- Credit Scoring
- Data collection
- Prediction (binary or multiclass)
- Time Series Prediction
- Distance Measurement
- Computer Vision
- GeoAI
- LLM and Gen AI
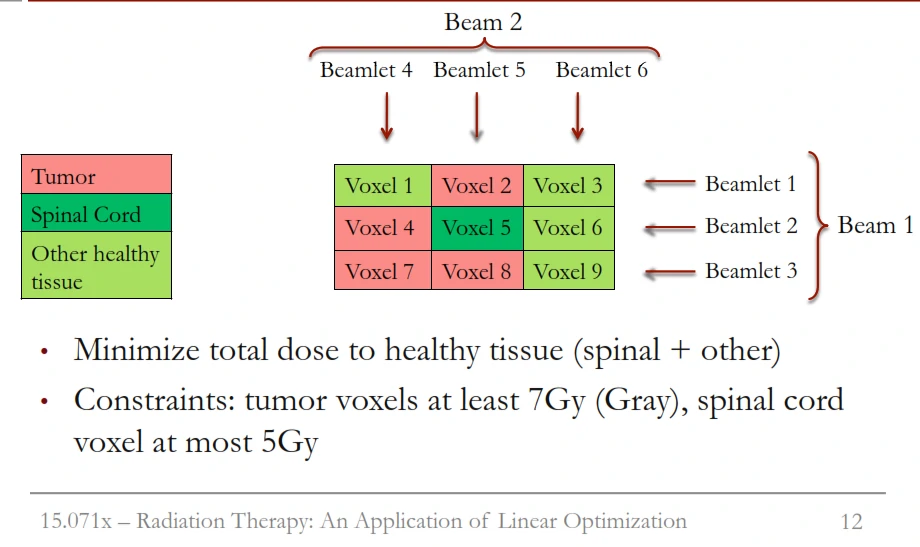
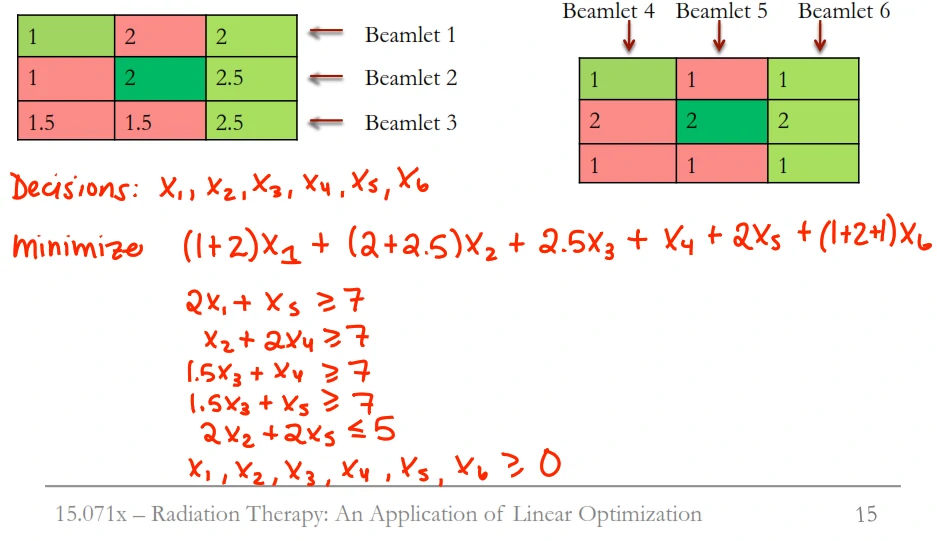
Linear Optimization
- Invention of intensity modulated radiation therapy (IMRT)
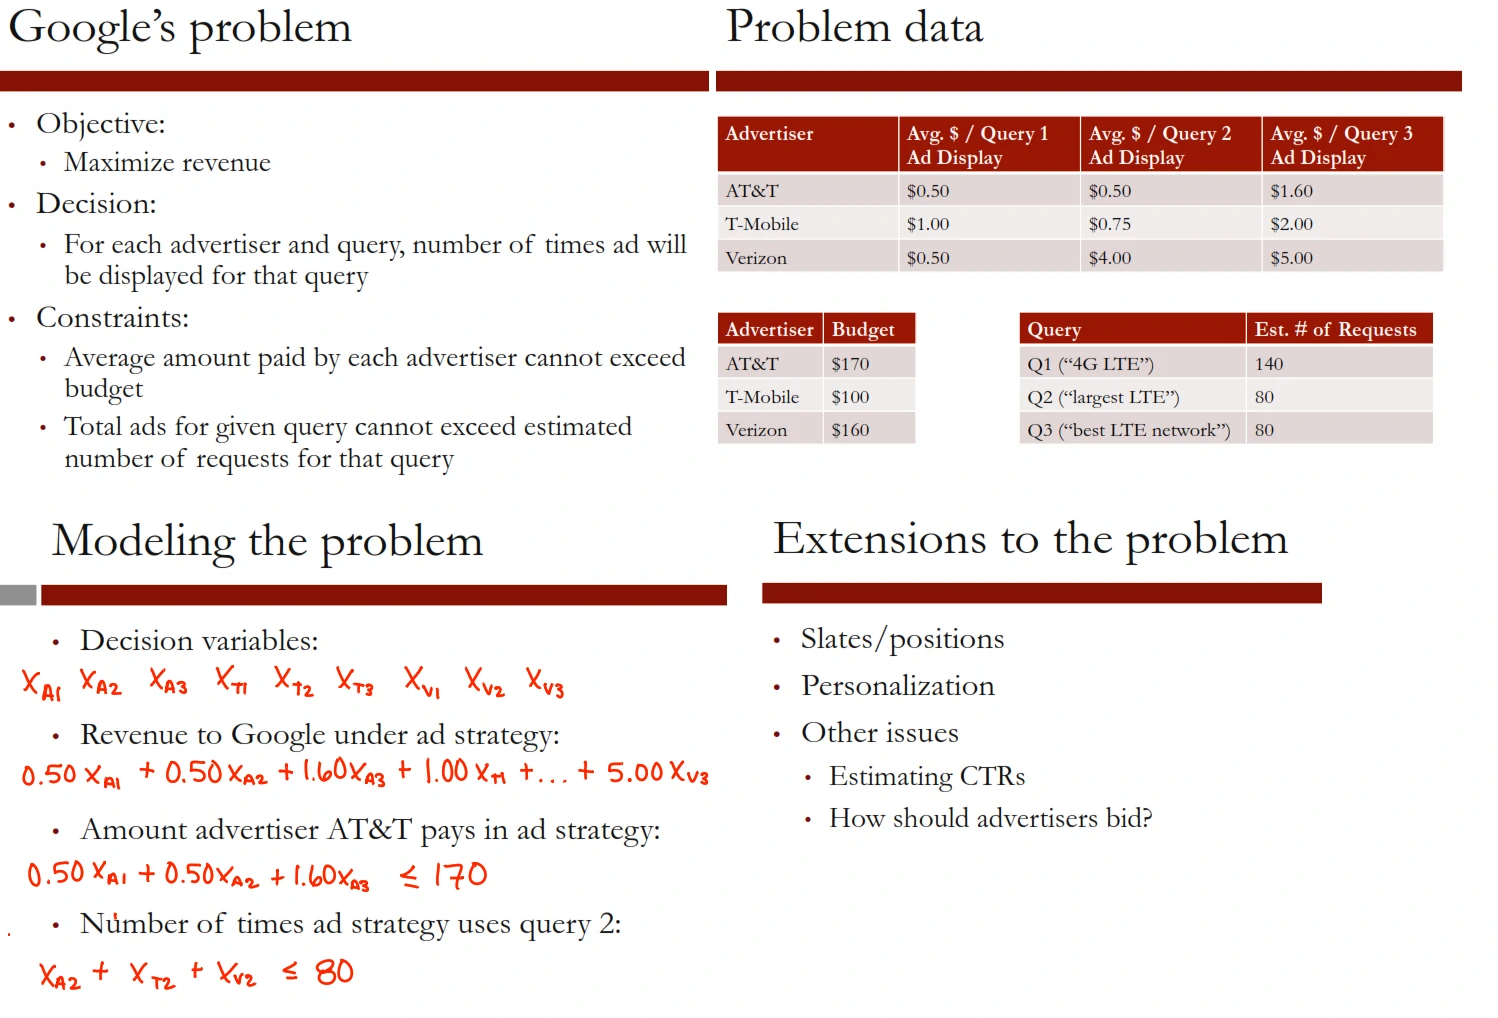
- Maximize revenue
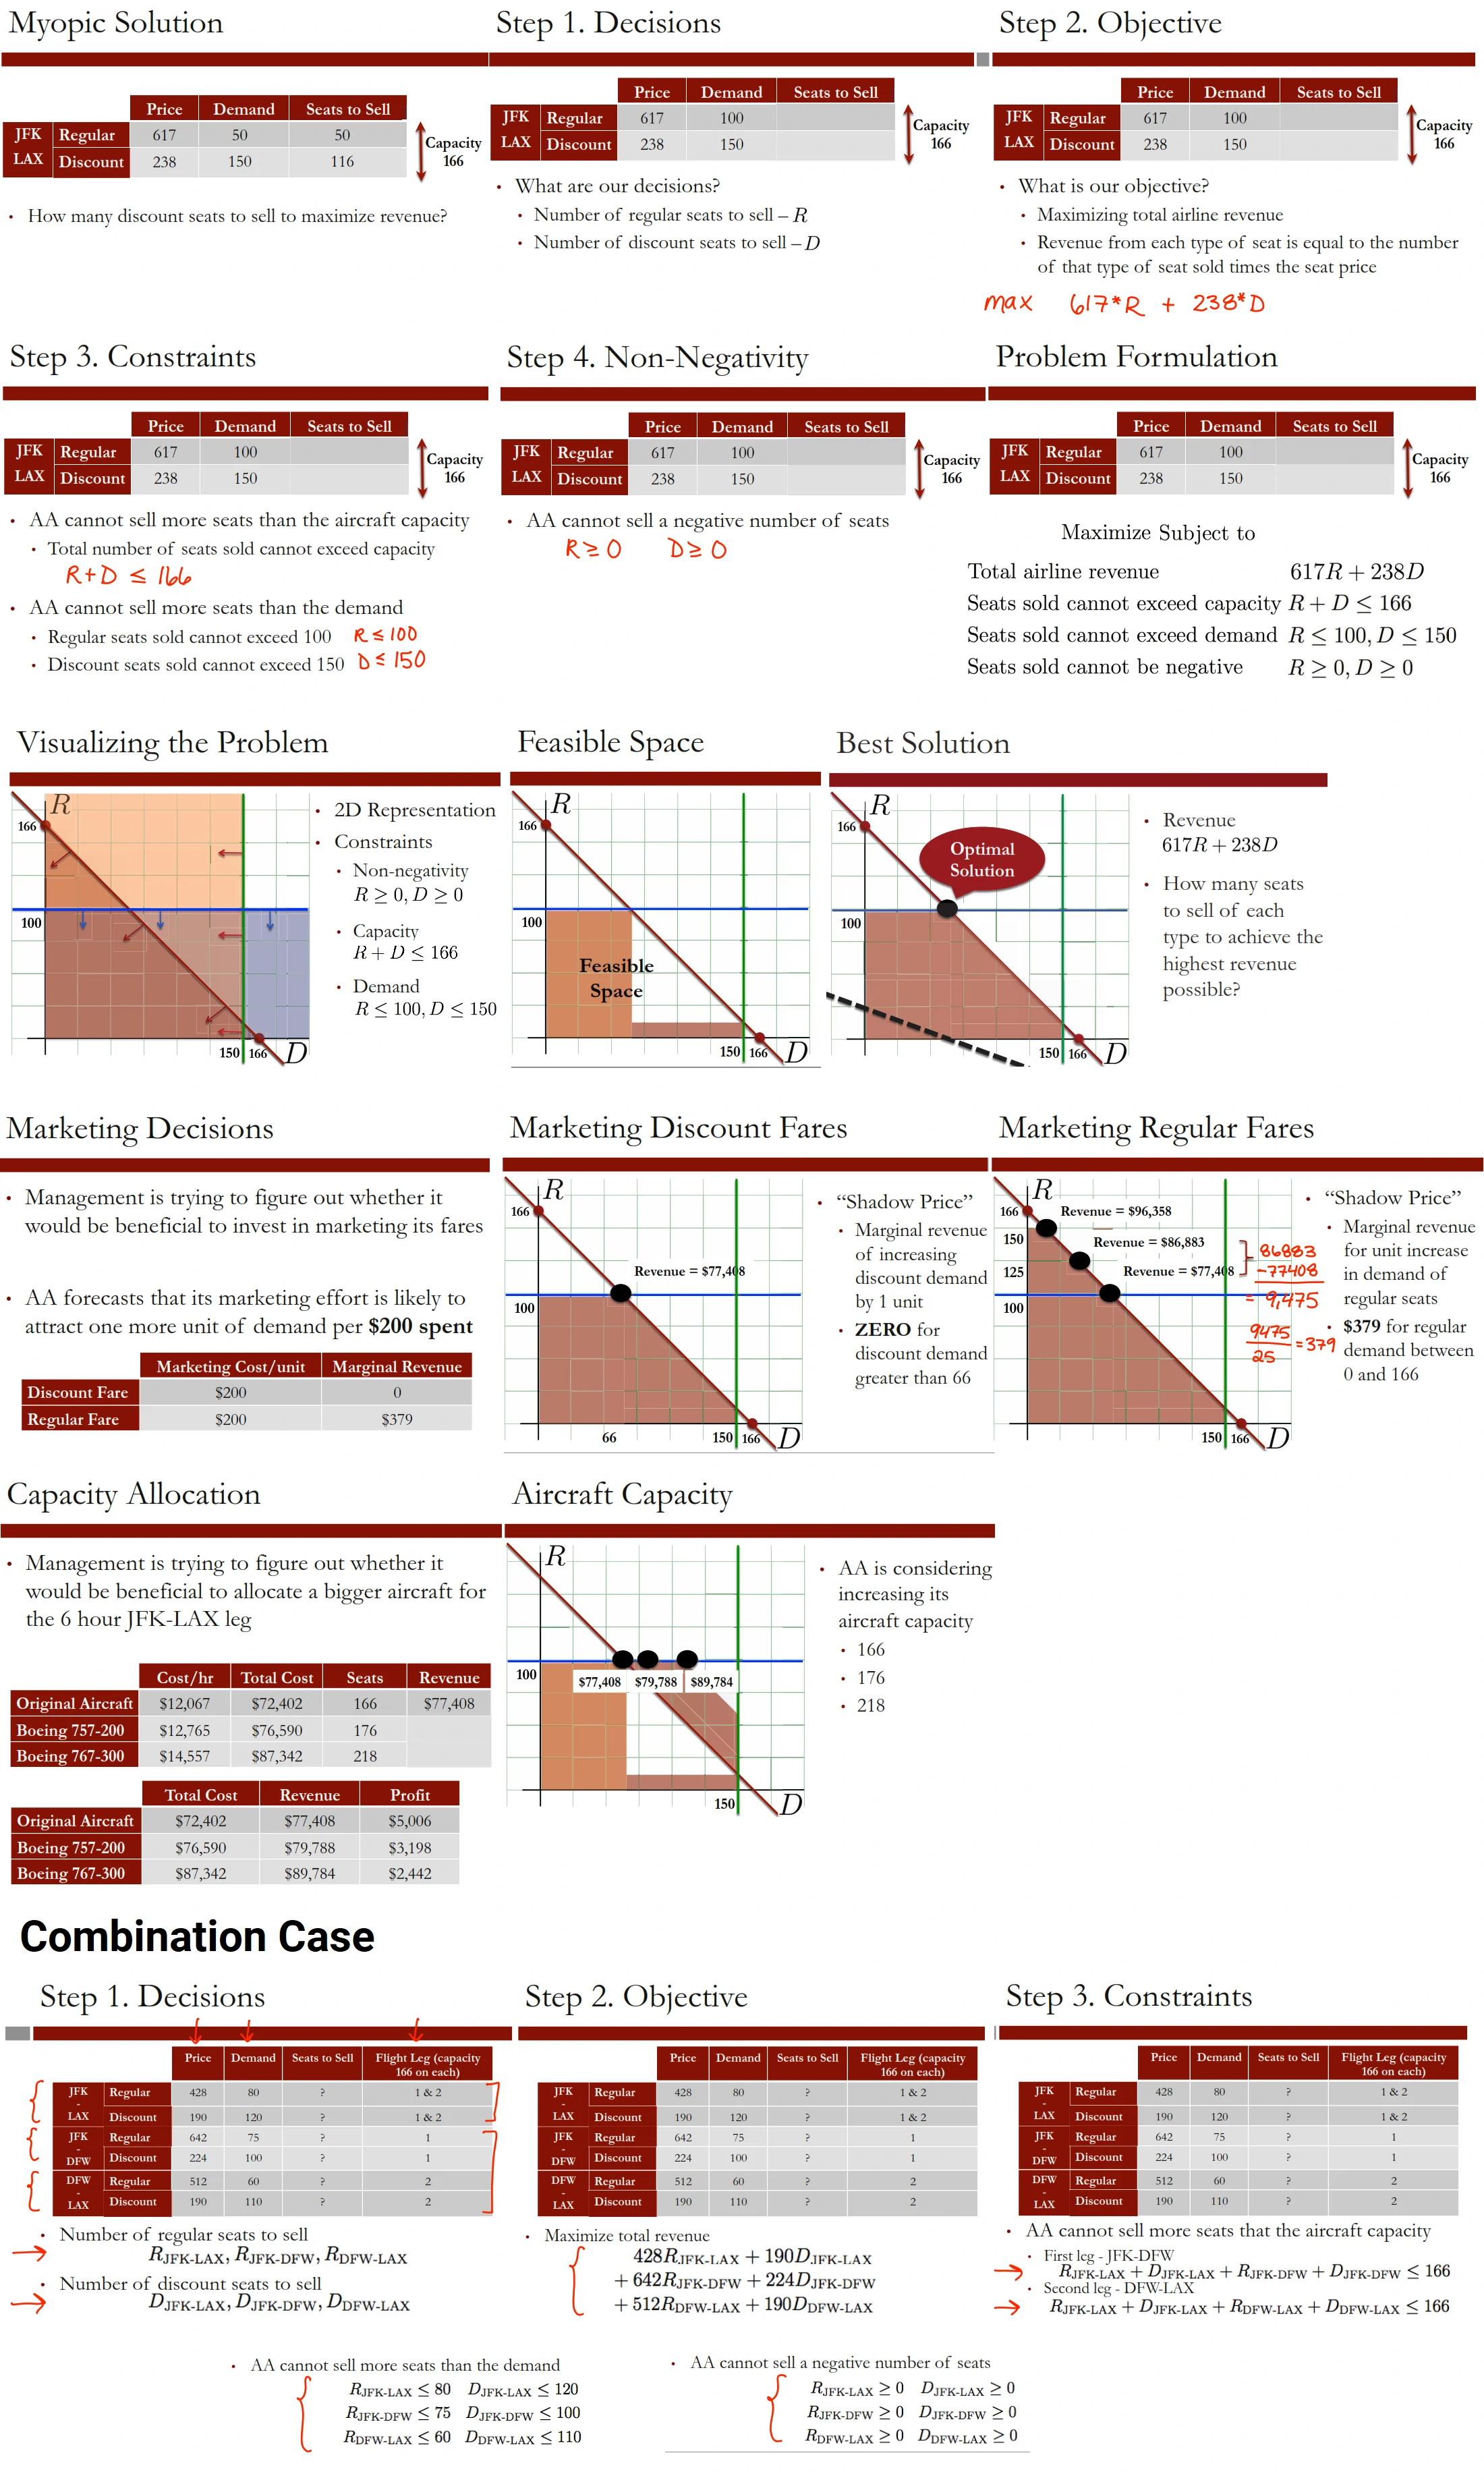
- Price and Demand Optimization
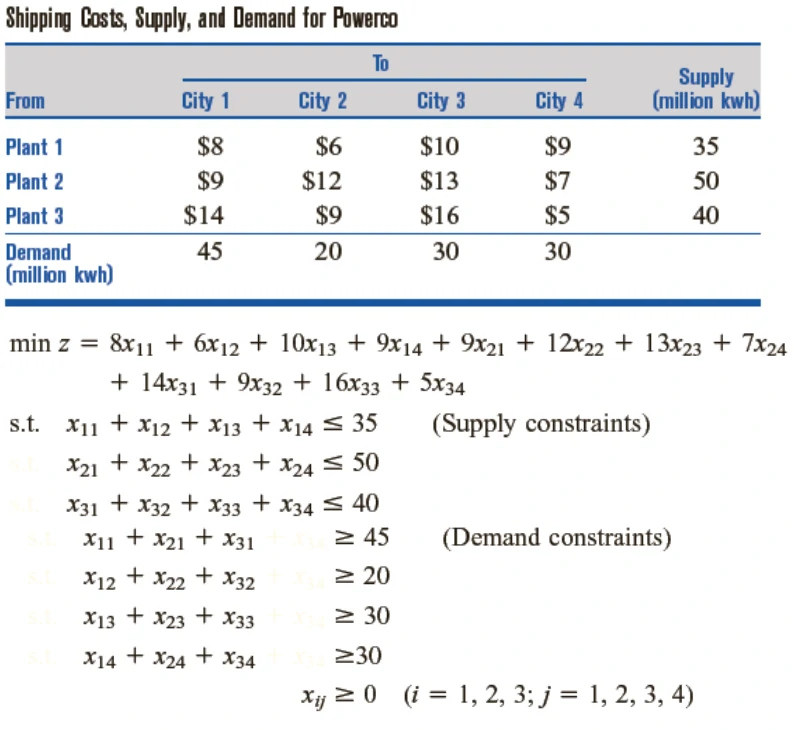
- Transportation Problem (Distribution Network)
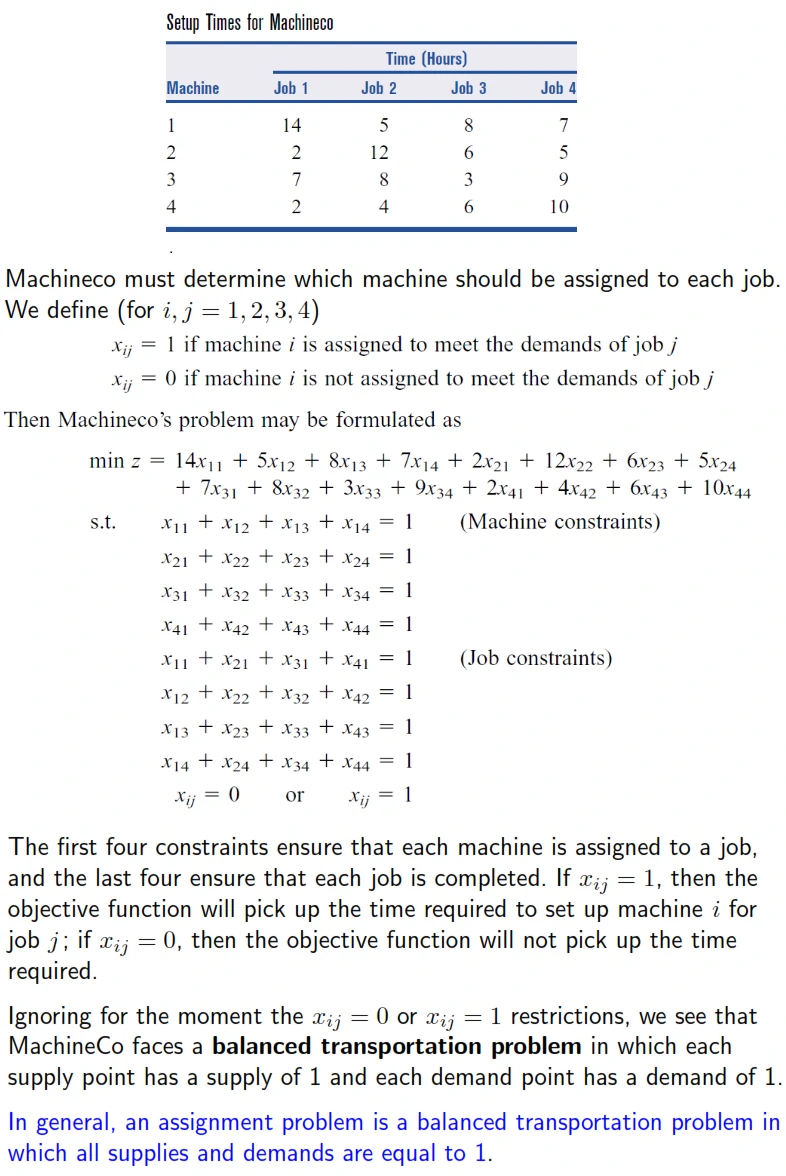
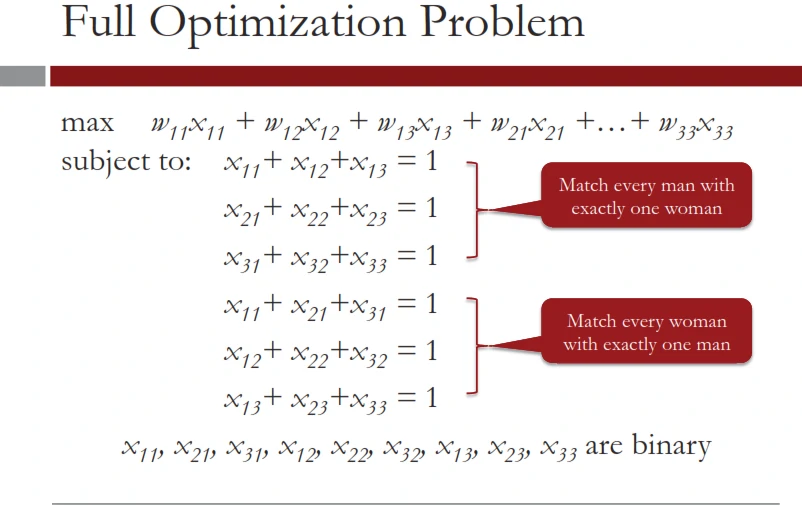
- Assignment Problem
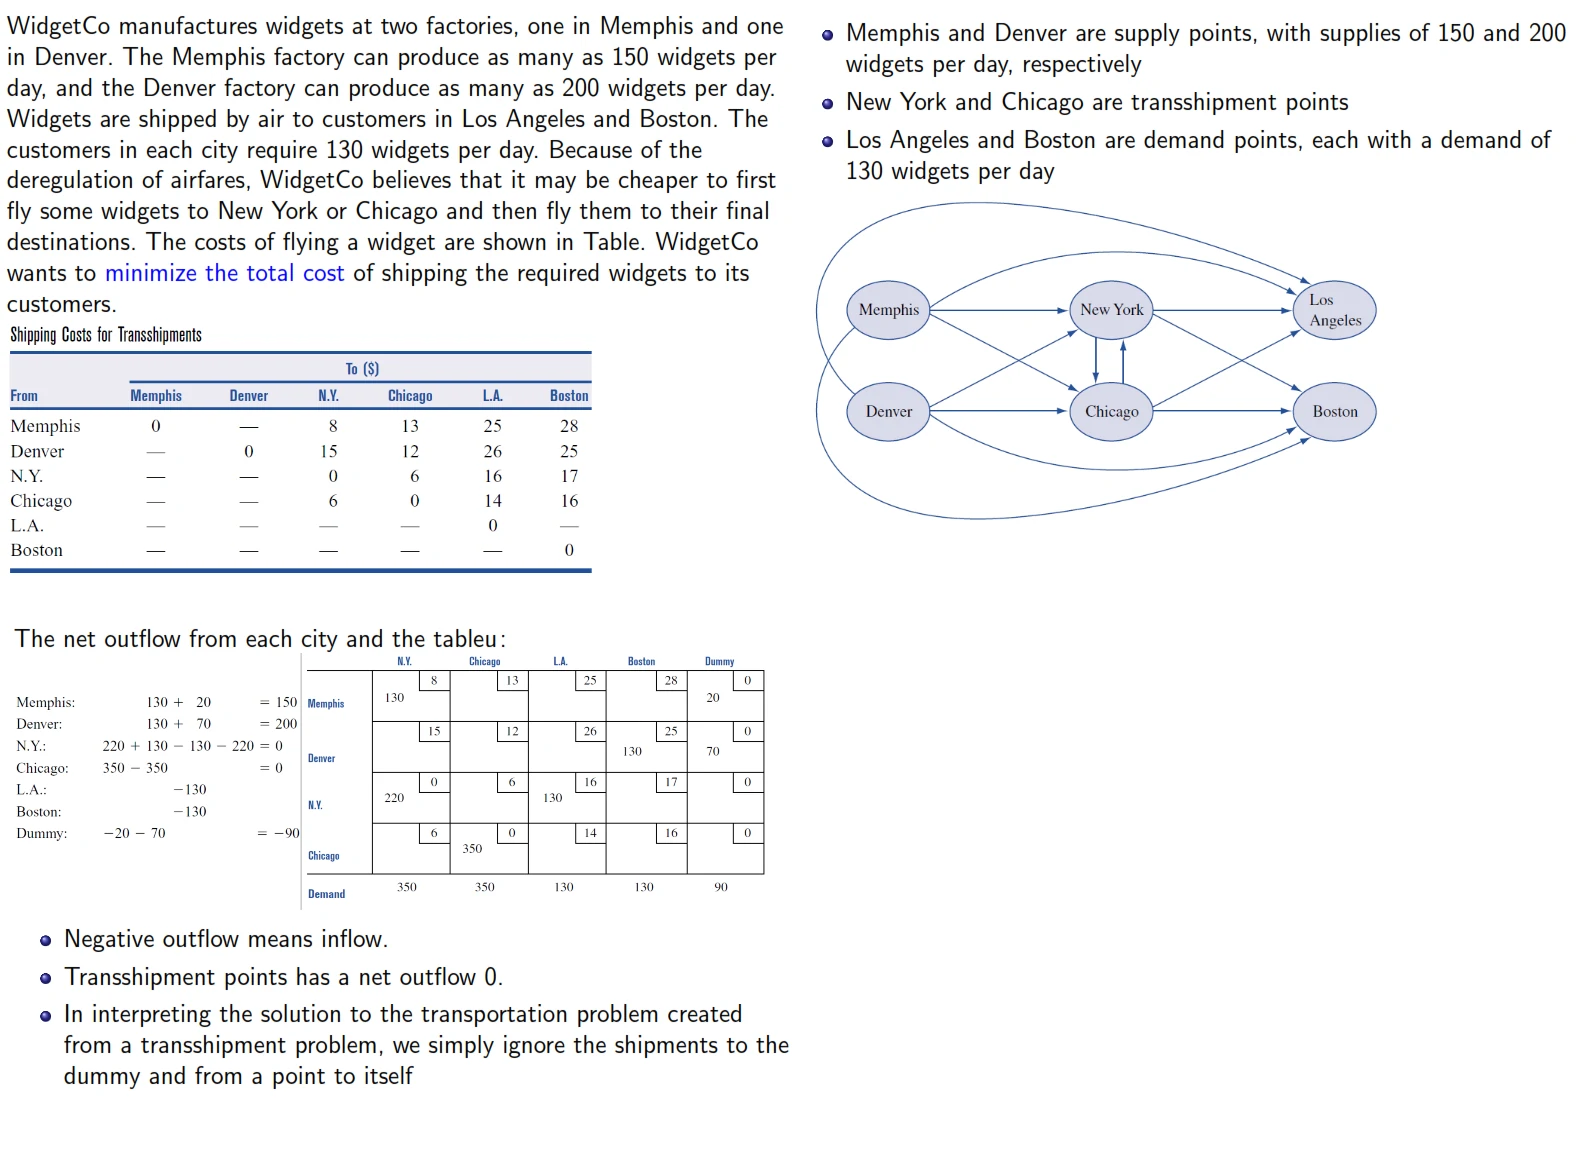
- Transshipment problem
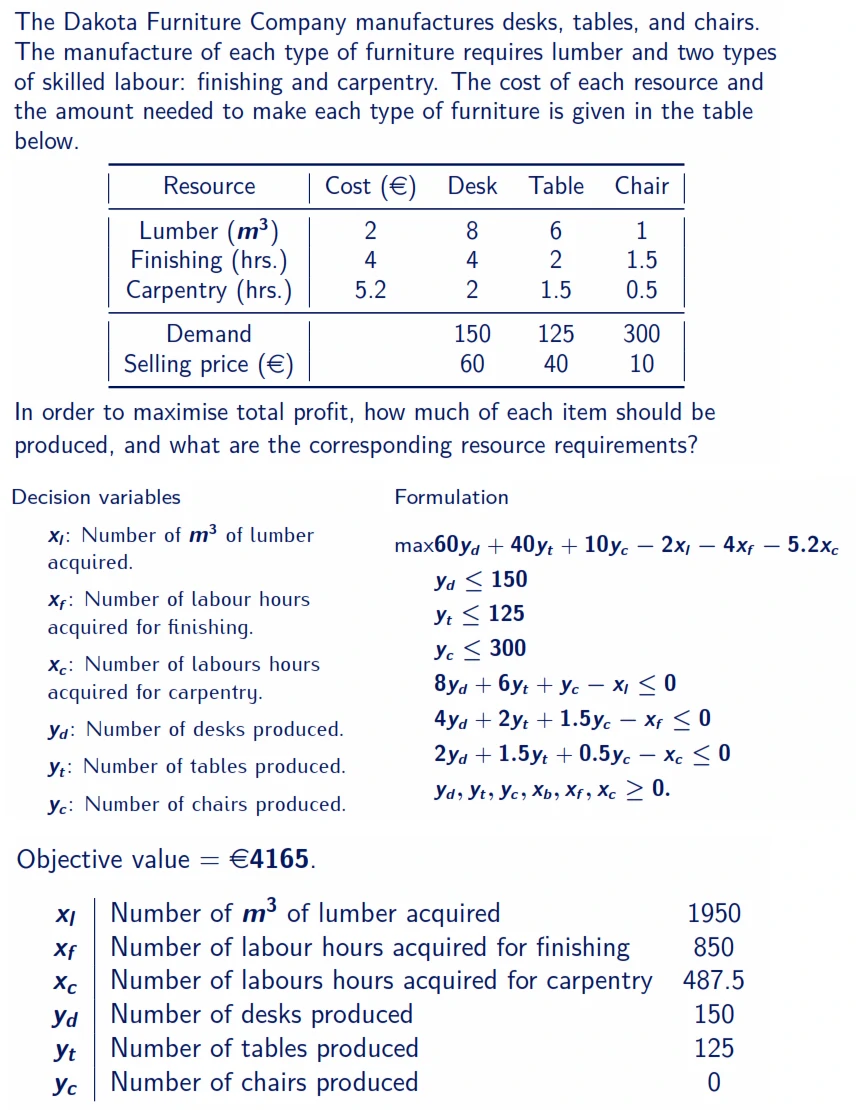
- Combinational Problem
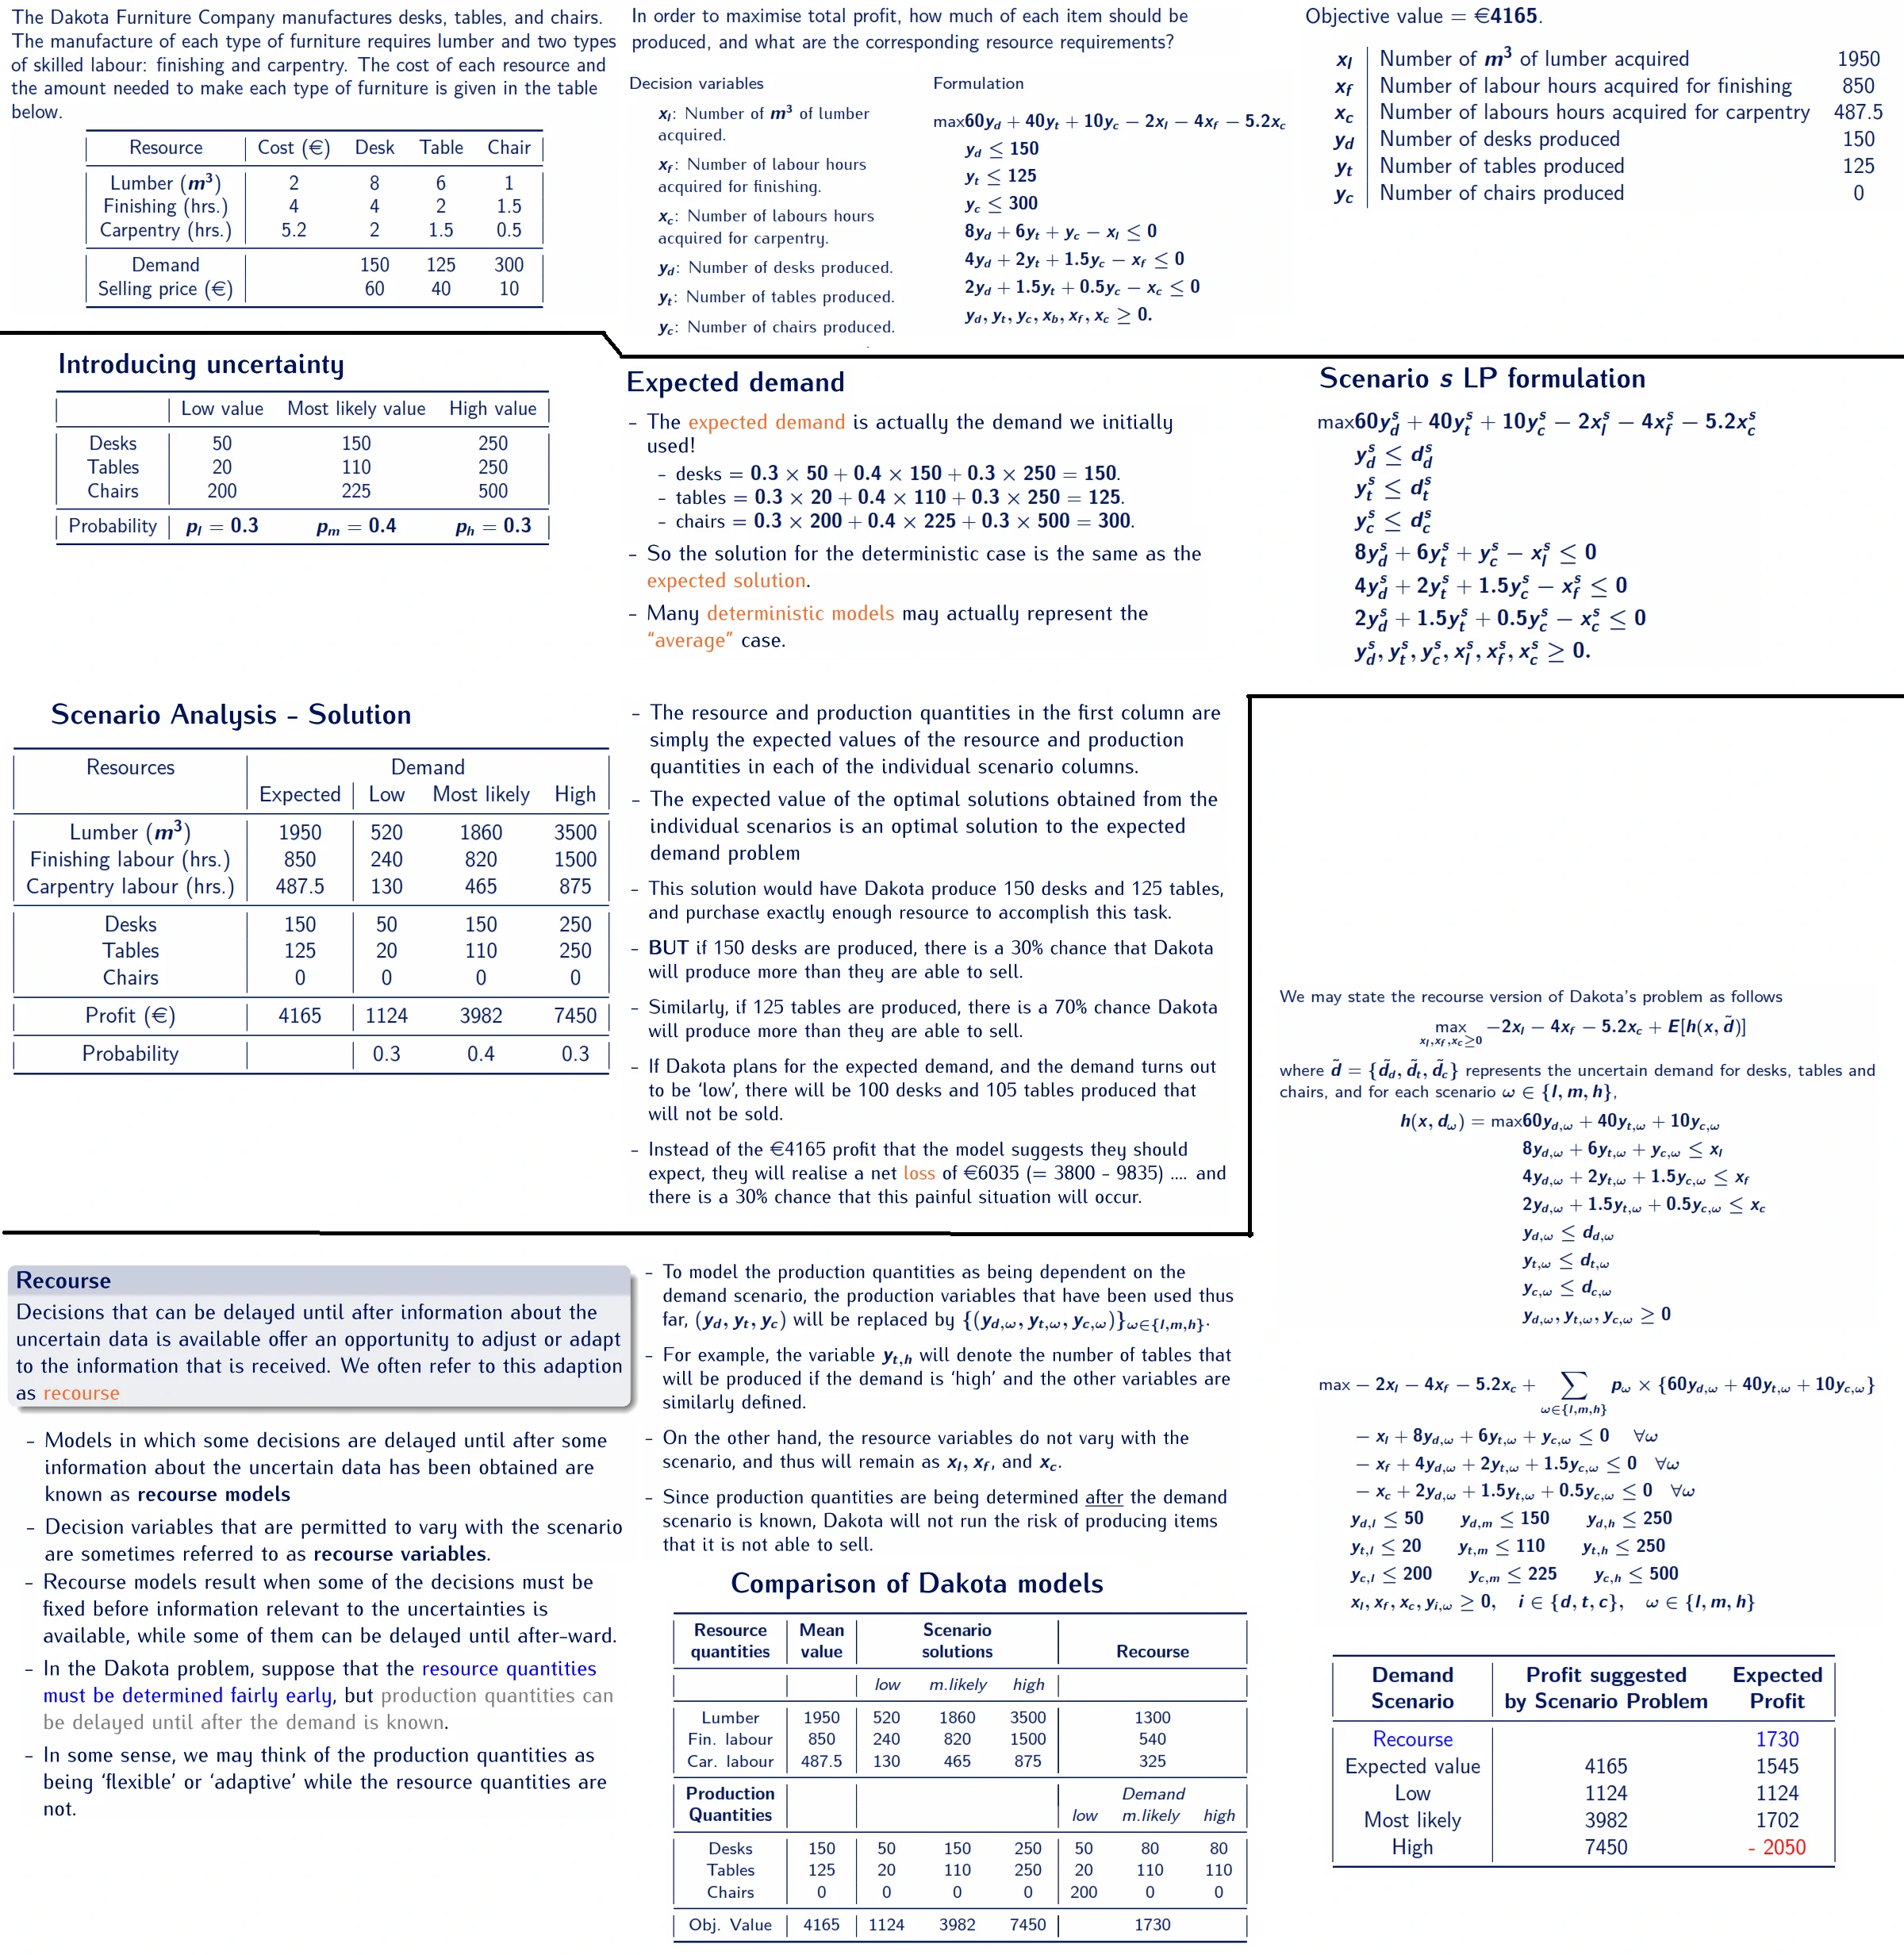
- Scenario Analysis
Integer Optimization
- Scheduling
- Knapsack problem
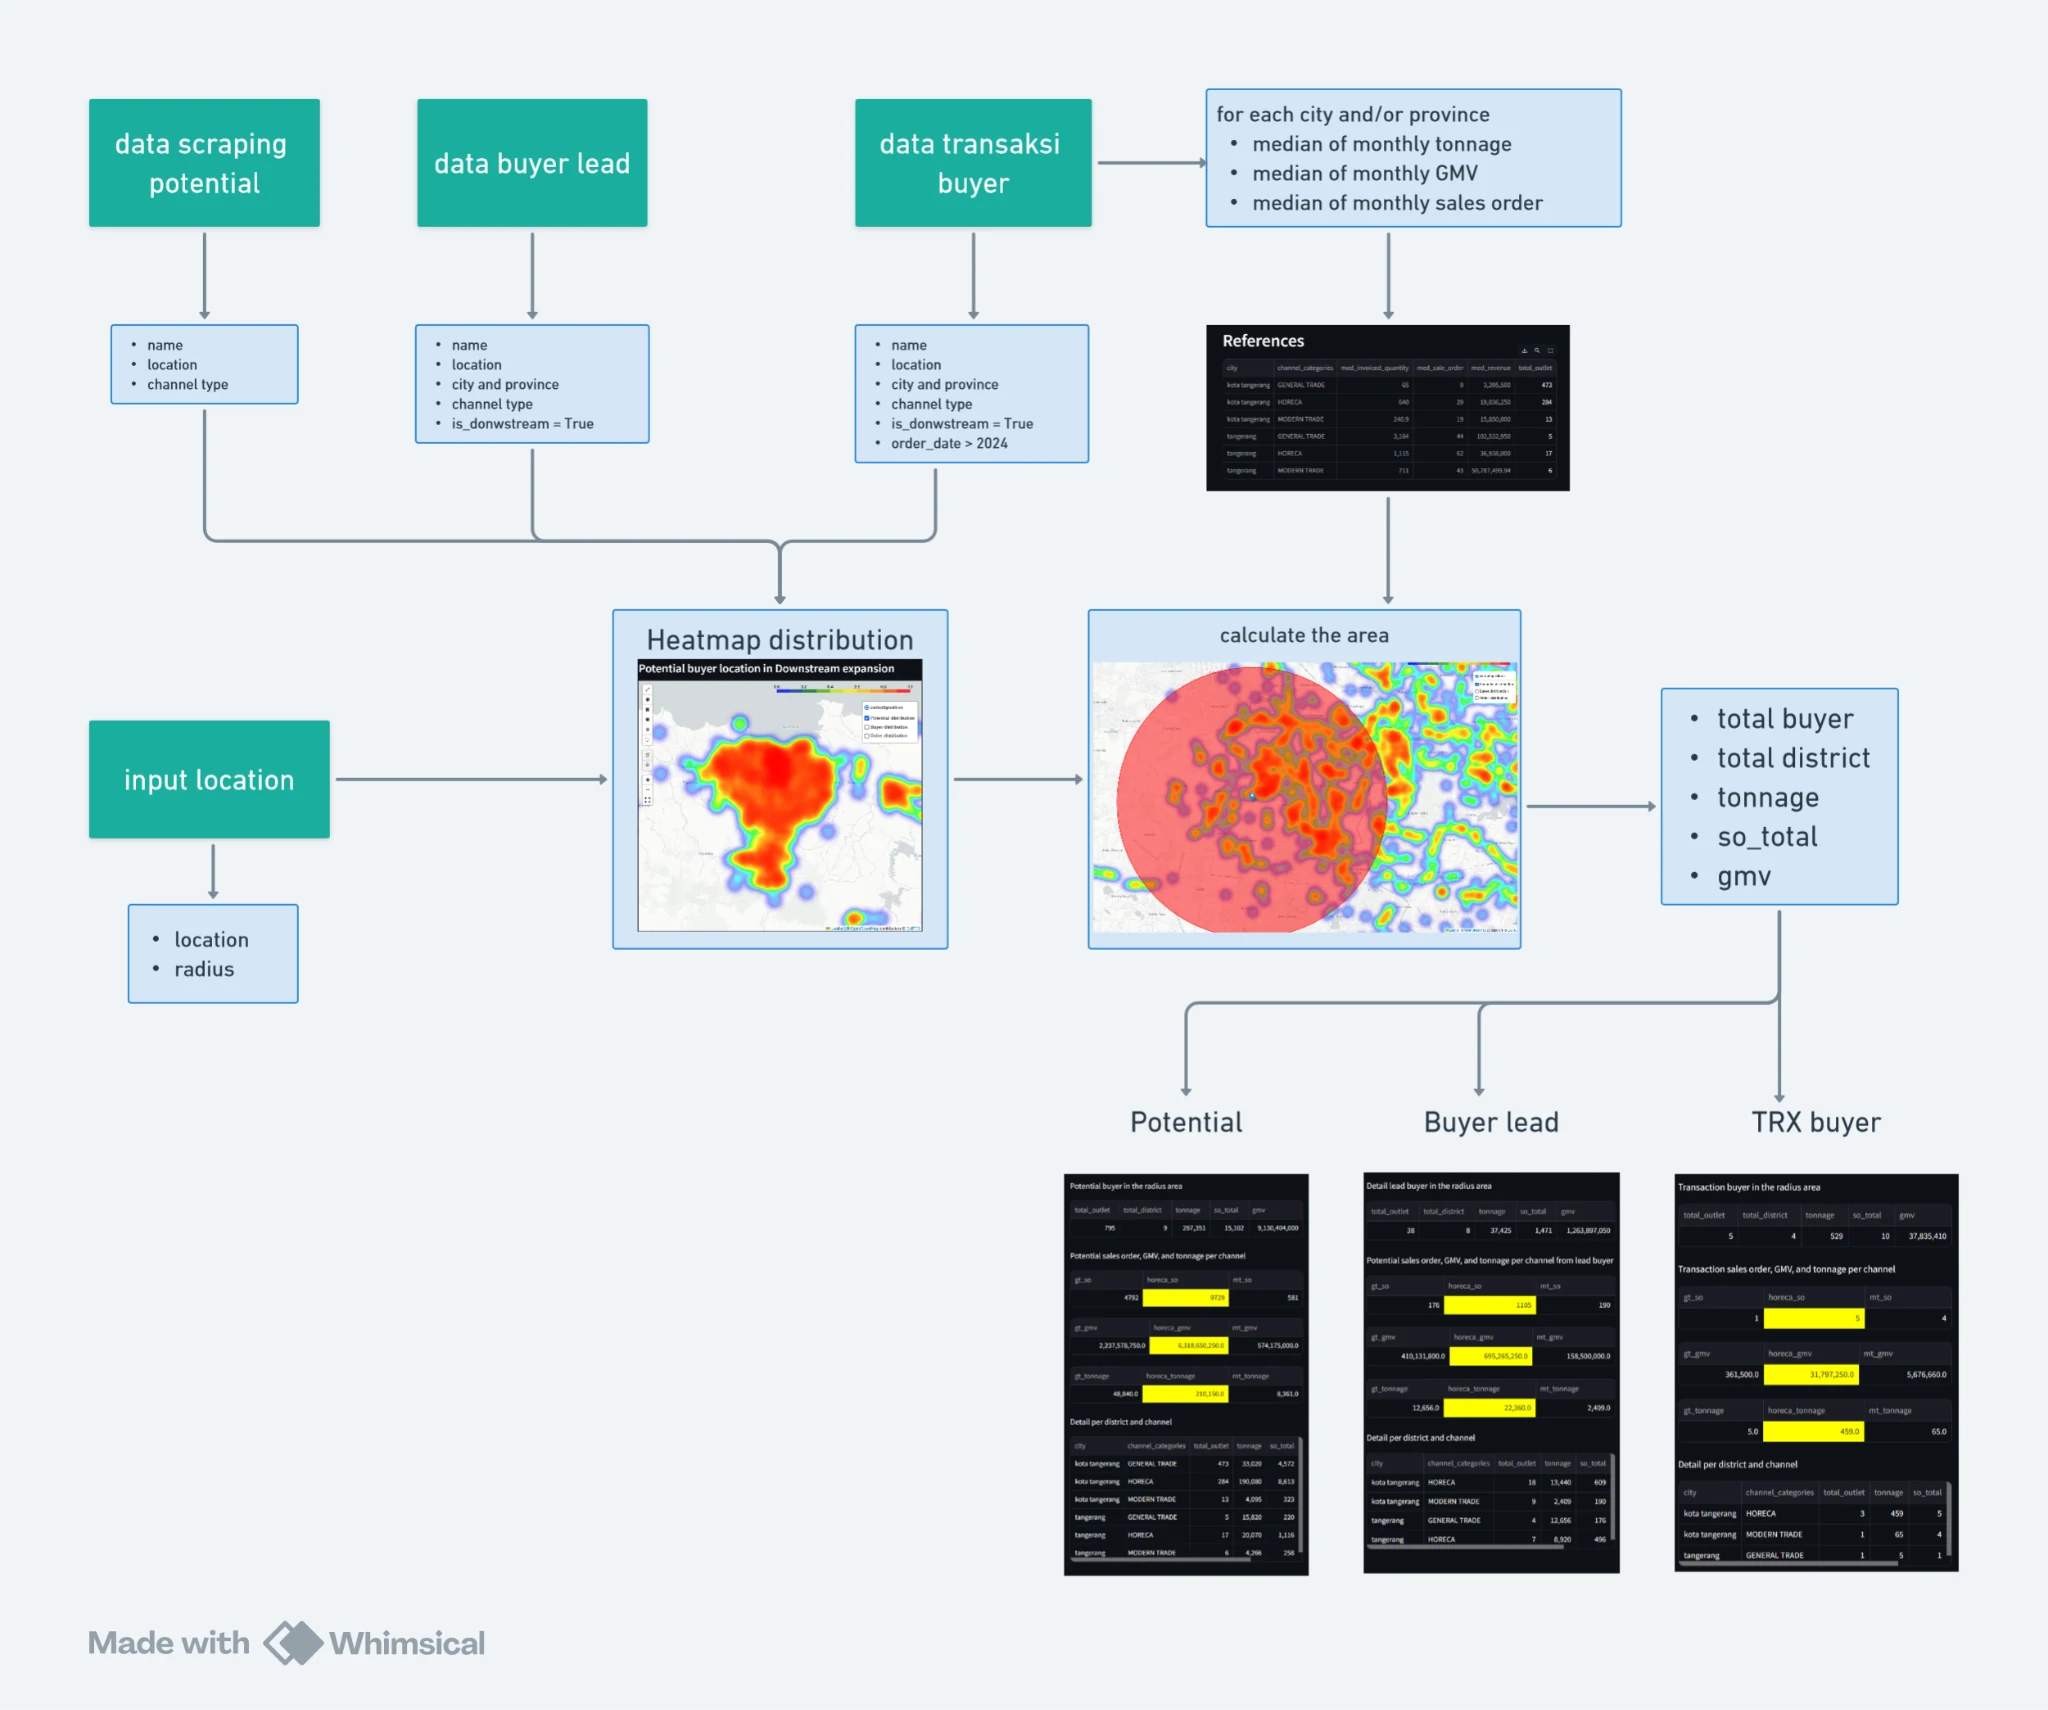
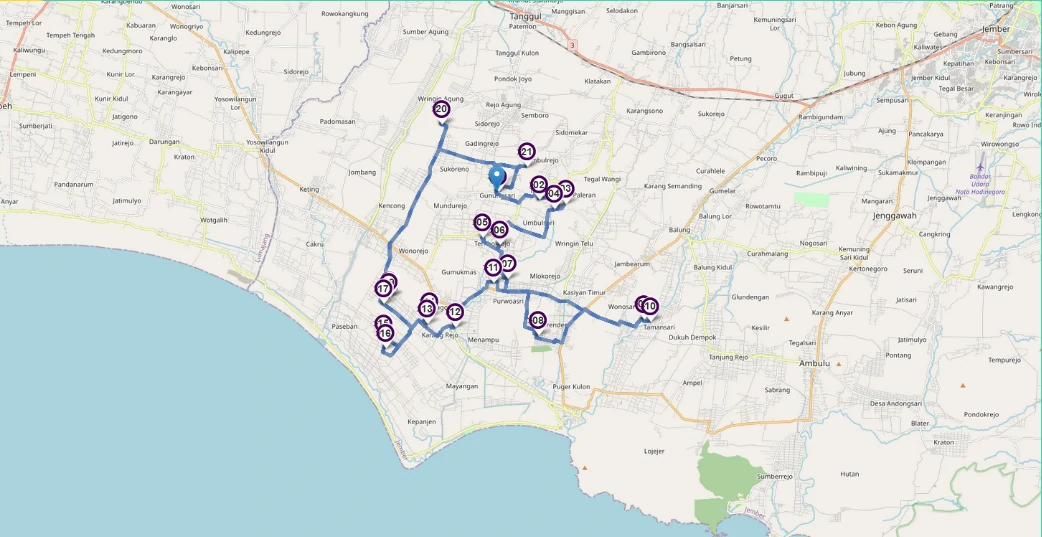
Spatial Development and Optimization
- Location Optimization Using Weighted Parameters
- Street network isochrones
- Population Density (35%)
- Accessibility weighted (25%)
- Coverage gaps (15%)
- Constain areas - Competitor and own-brand (25% if absence)
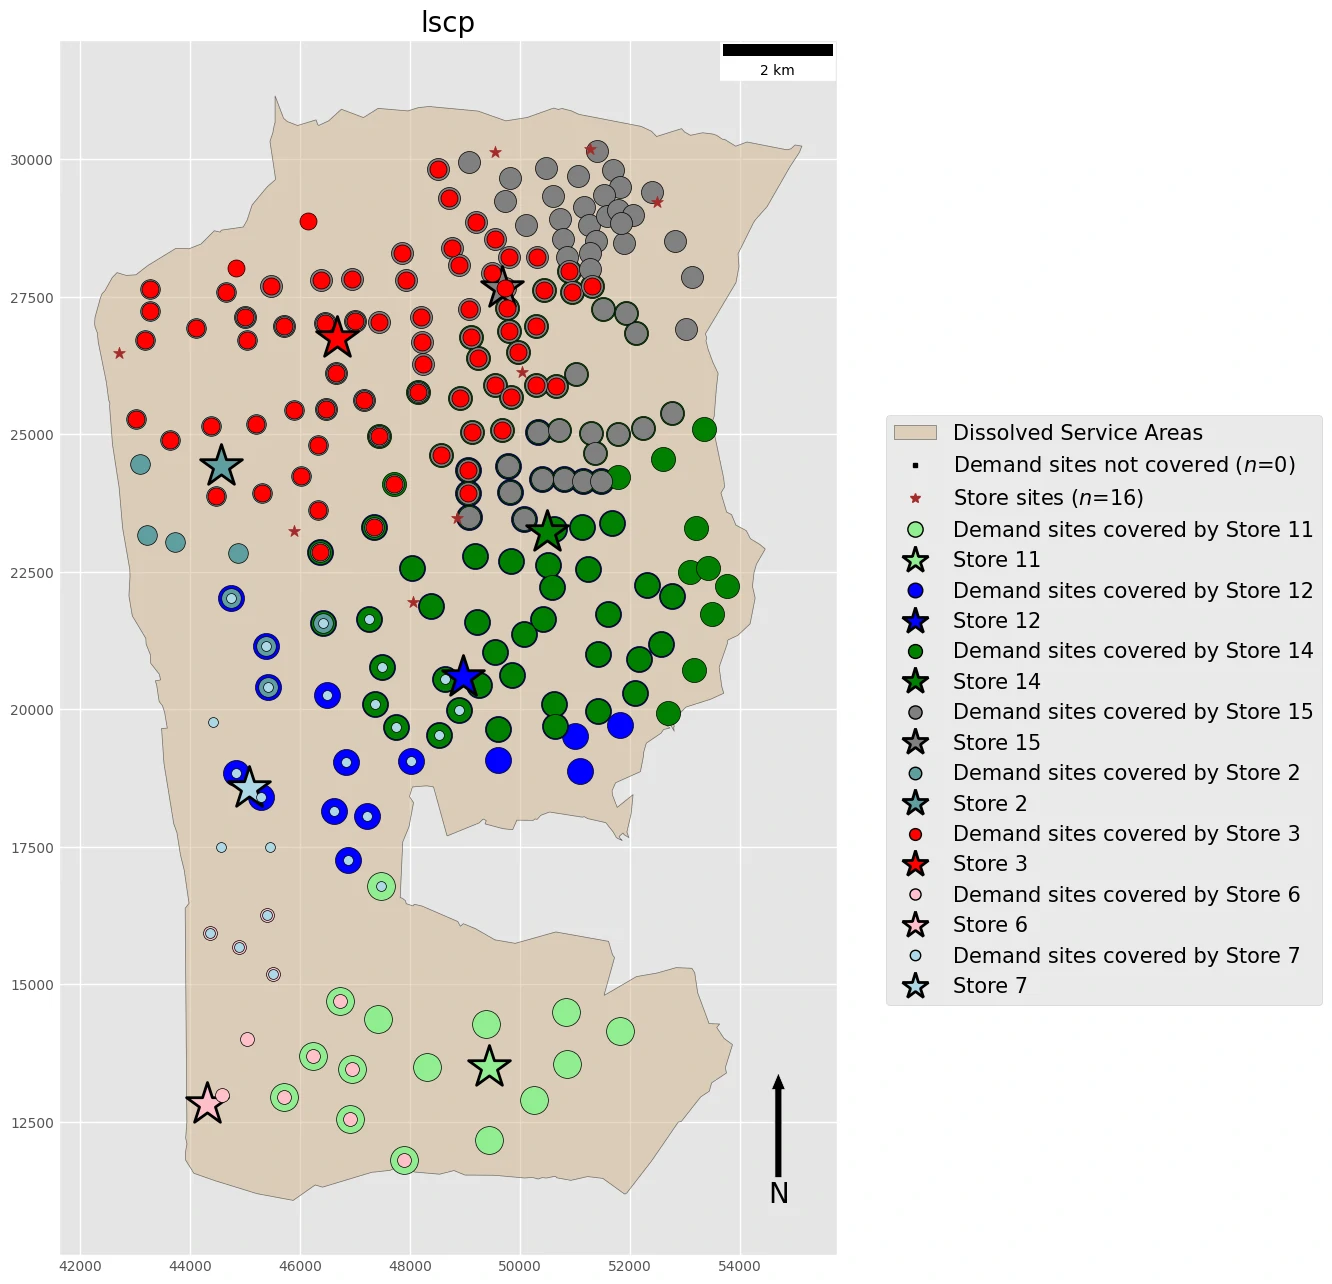
- Real World Facility Location Problem
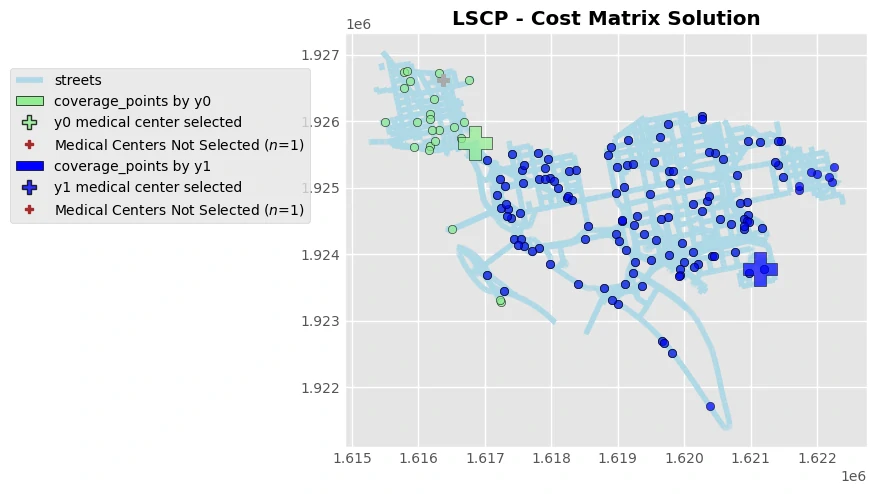
- Location Set Covering Problem (LSCP)
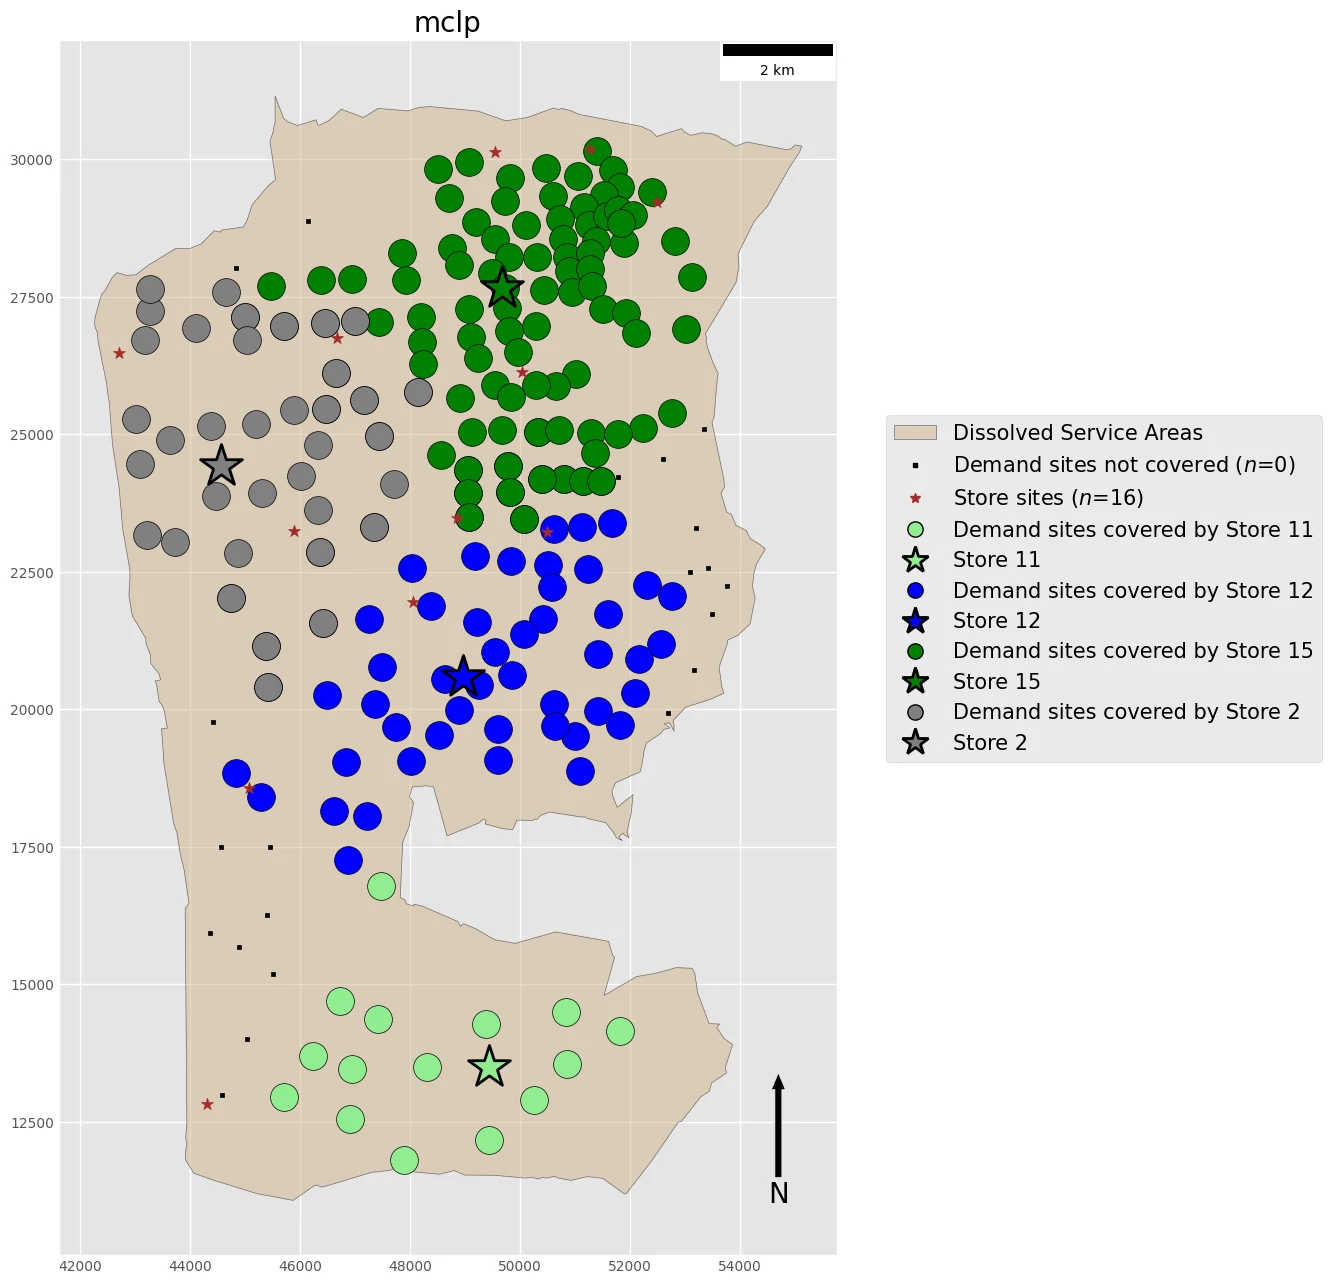
- Maximal Coverage Location Problem (MCLP)
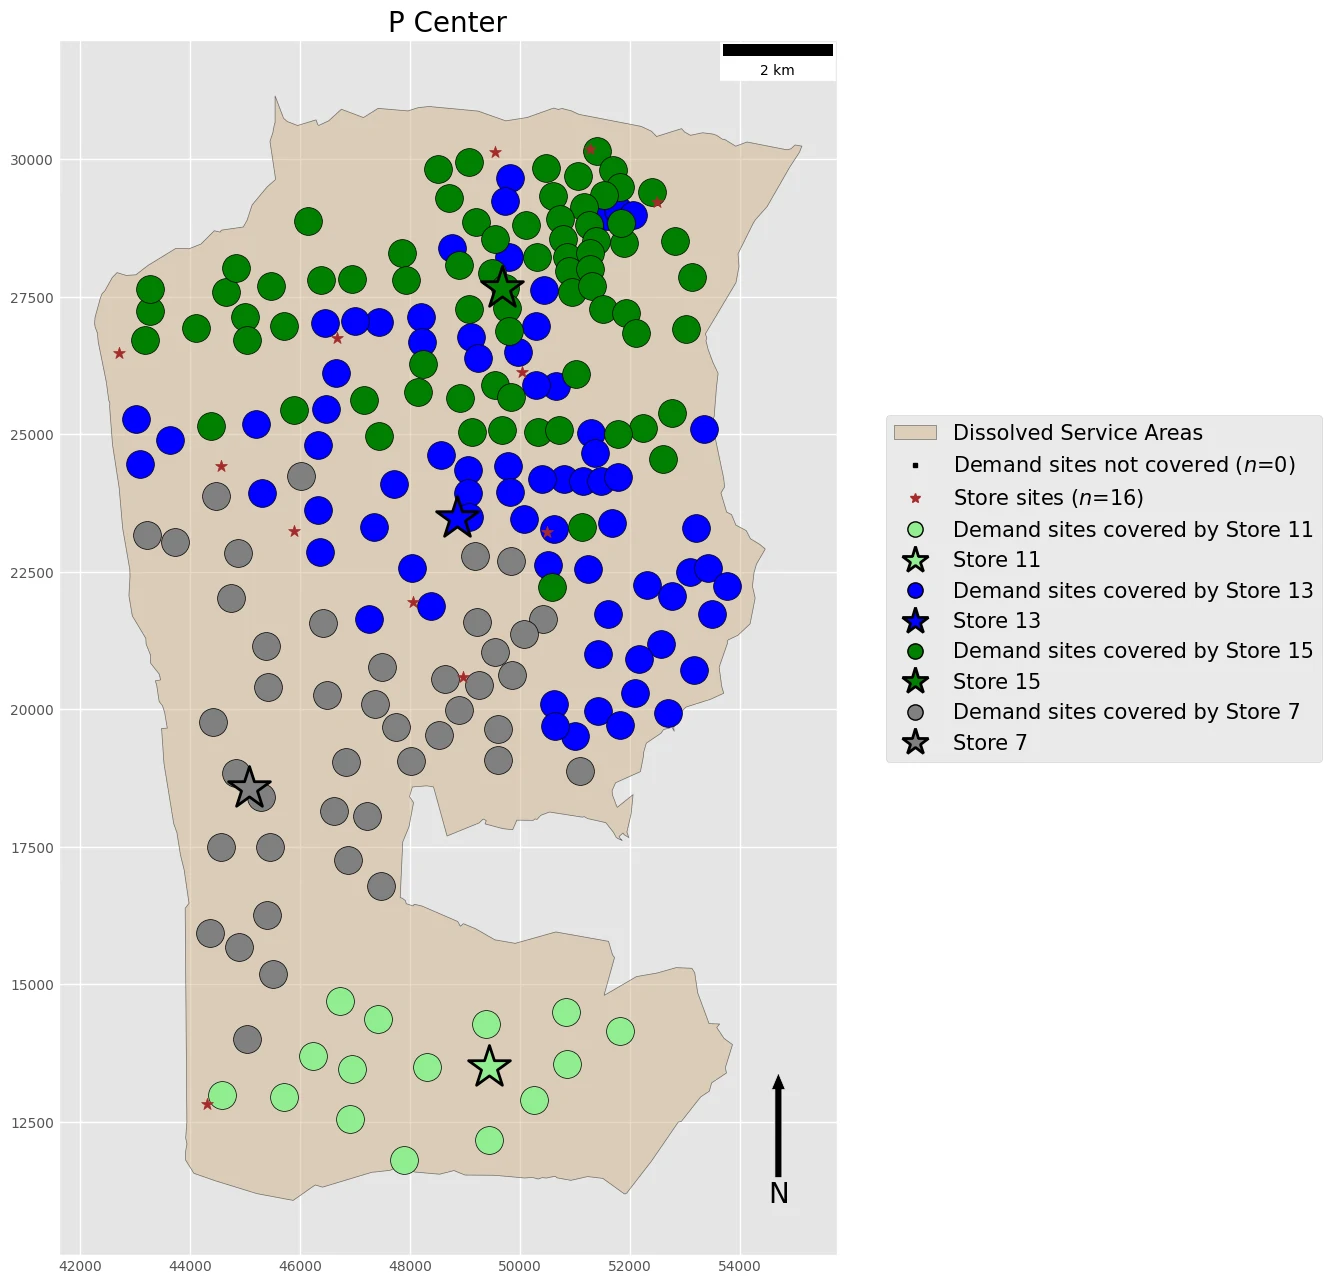
- P-Center Problem
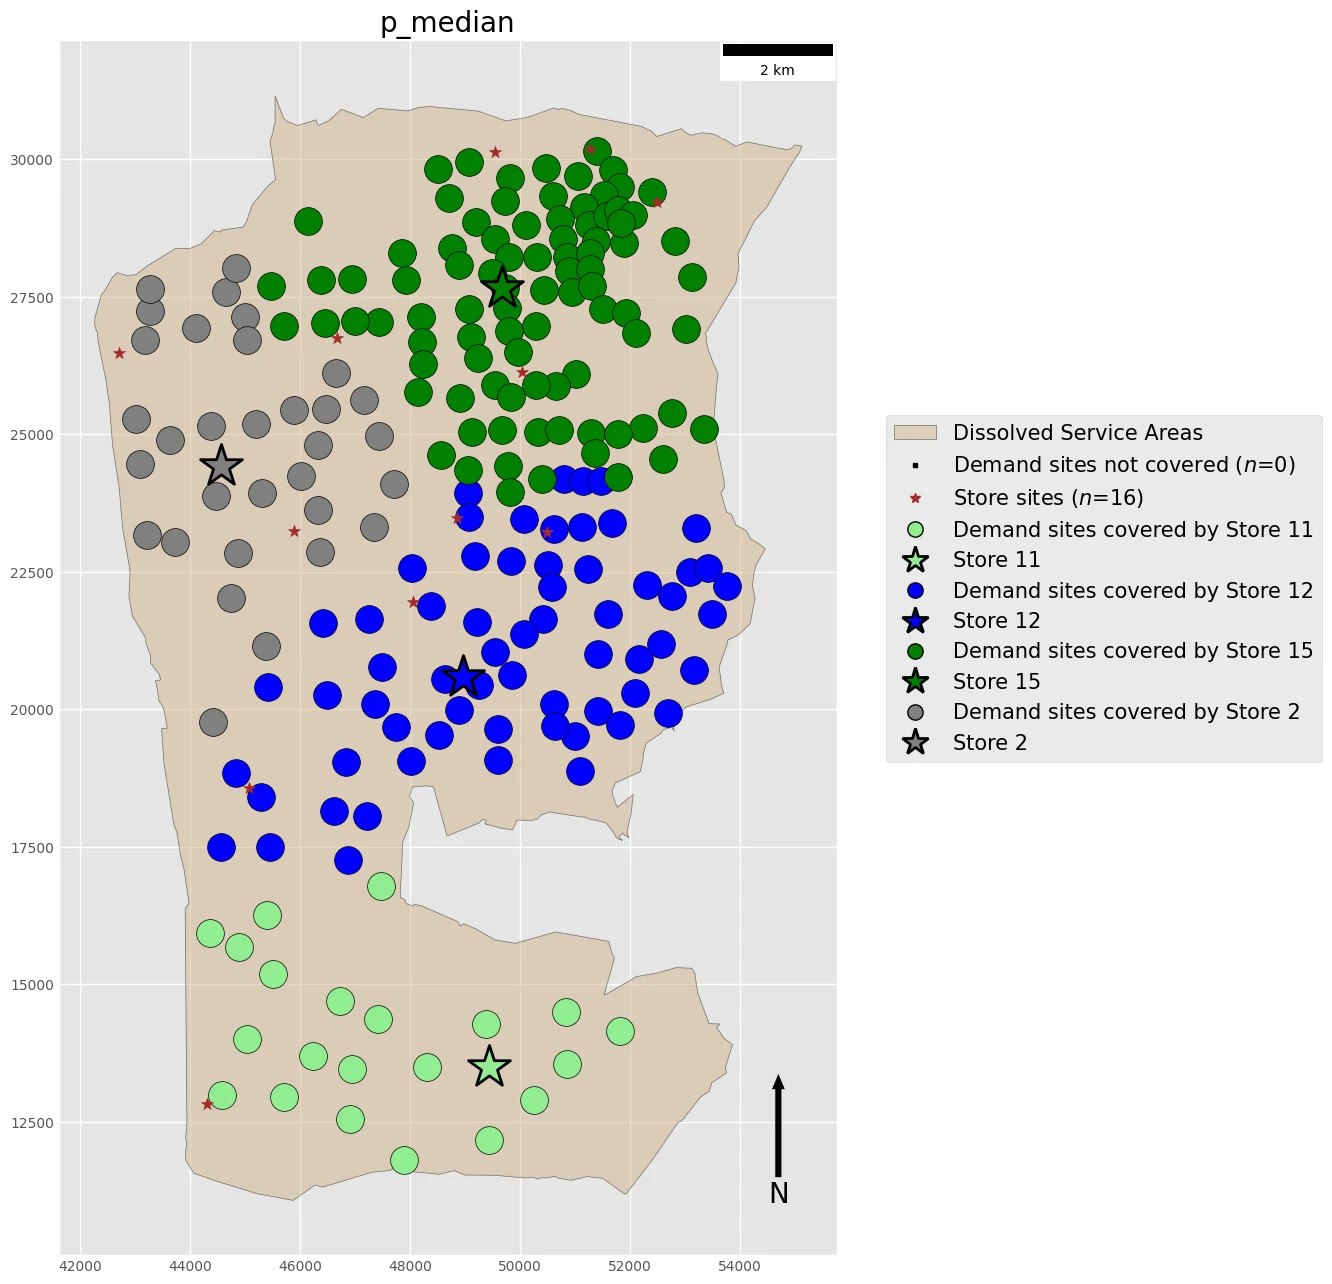
- P-Median Problem
- Location Set Covering Problem (LSCP)
- Asset Management and Optimizing Development
- Land and Infrastructure Management
- Slope Area
- Soil Categories
- Mapping ecosystems of mining sites
- Land and Infrastructure Development
- Lifetime Maintenance Assets
- Forecast Management
- Spatial-Temporal Development
- Digital Twin
- Weather and Environment Monitoring
- Monitoring of Sustainable Development
- Land and Infrastructure Management
- Fleet Management
- Movement
- Location
- Territory adherence
- Geofencing
- Incident detection and reporting
- Destiny, Capacity, Speed, Time estimation
- Safety management
- Realtime report
- Security and quality report and analysis
- Visual Management
- Worker Activity and Safety
- Routing Management
- Scheduling
- Safety
- Risk Management
- Disaster Management
- Realtime Feedback
- Impact Area
- Sustainability Management
- Recovery
- Revegetation
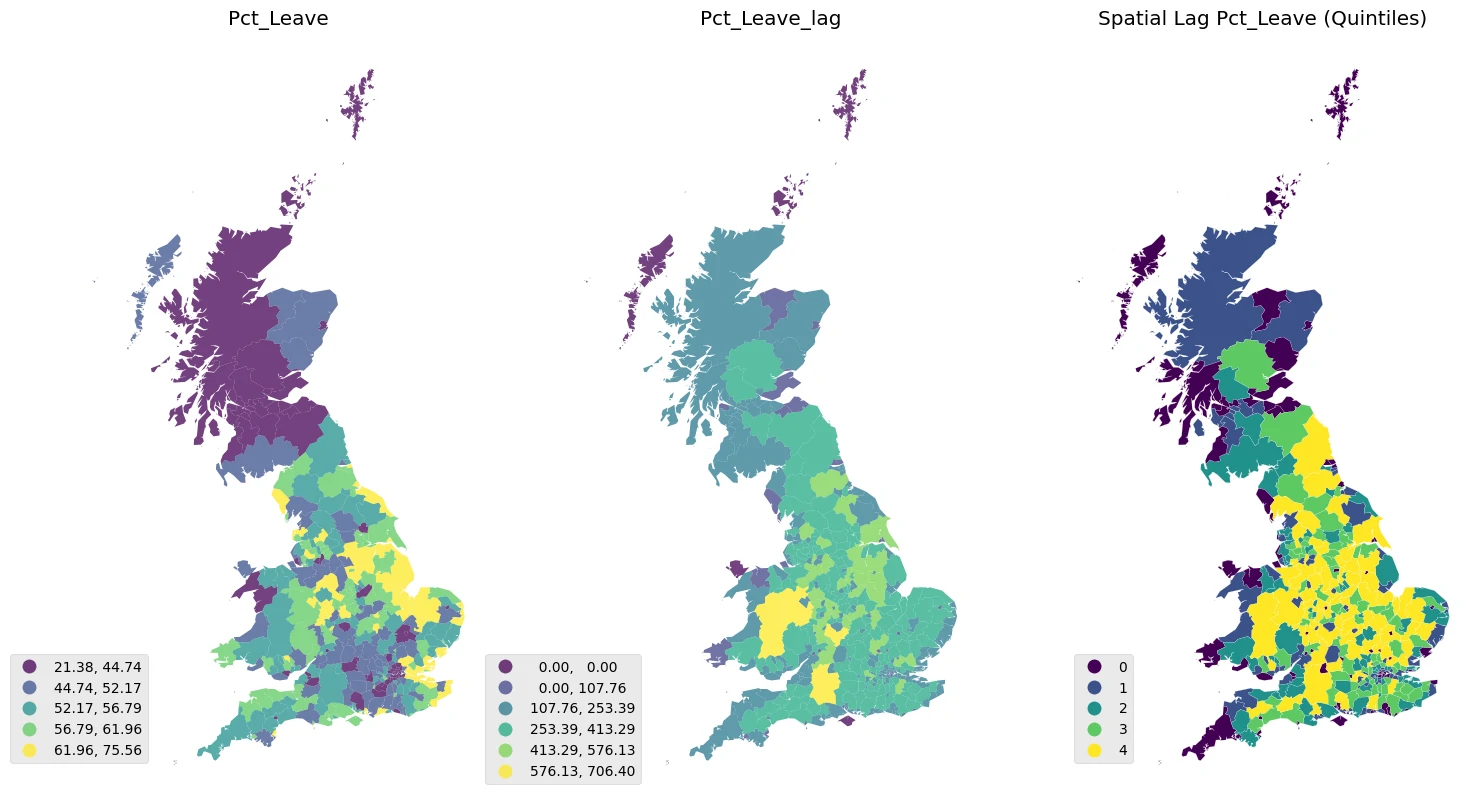
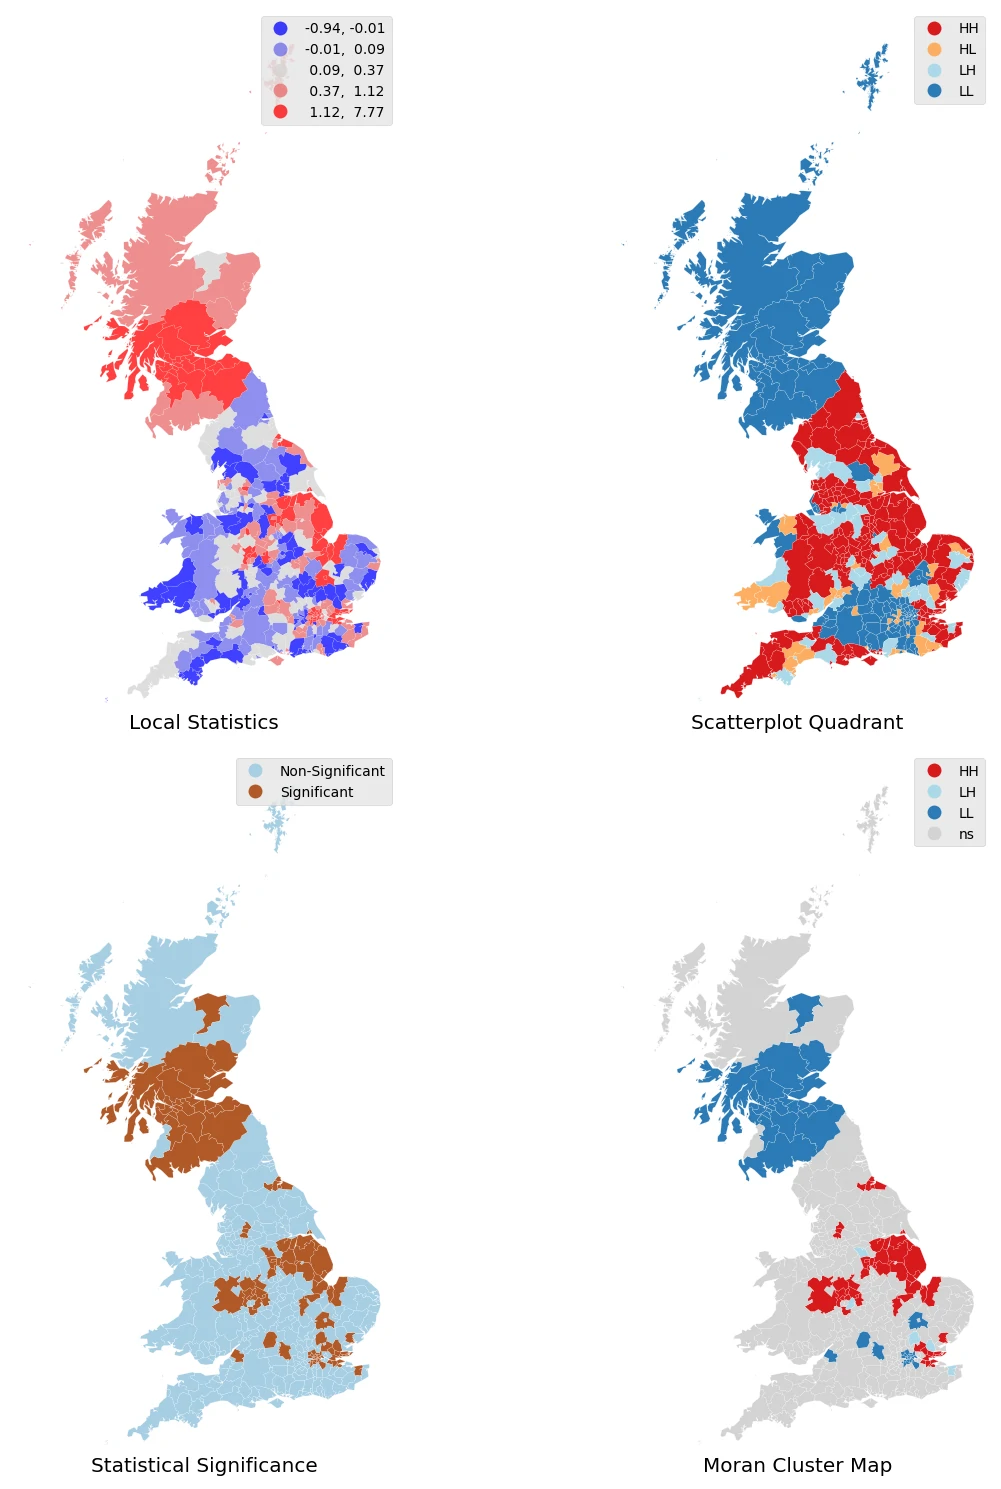
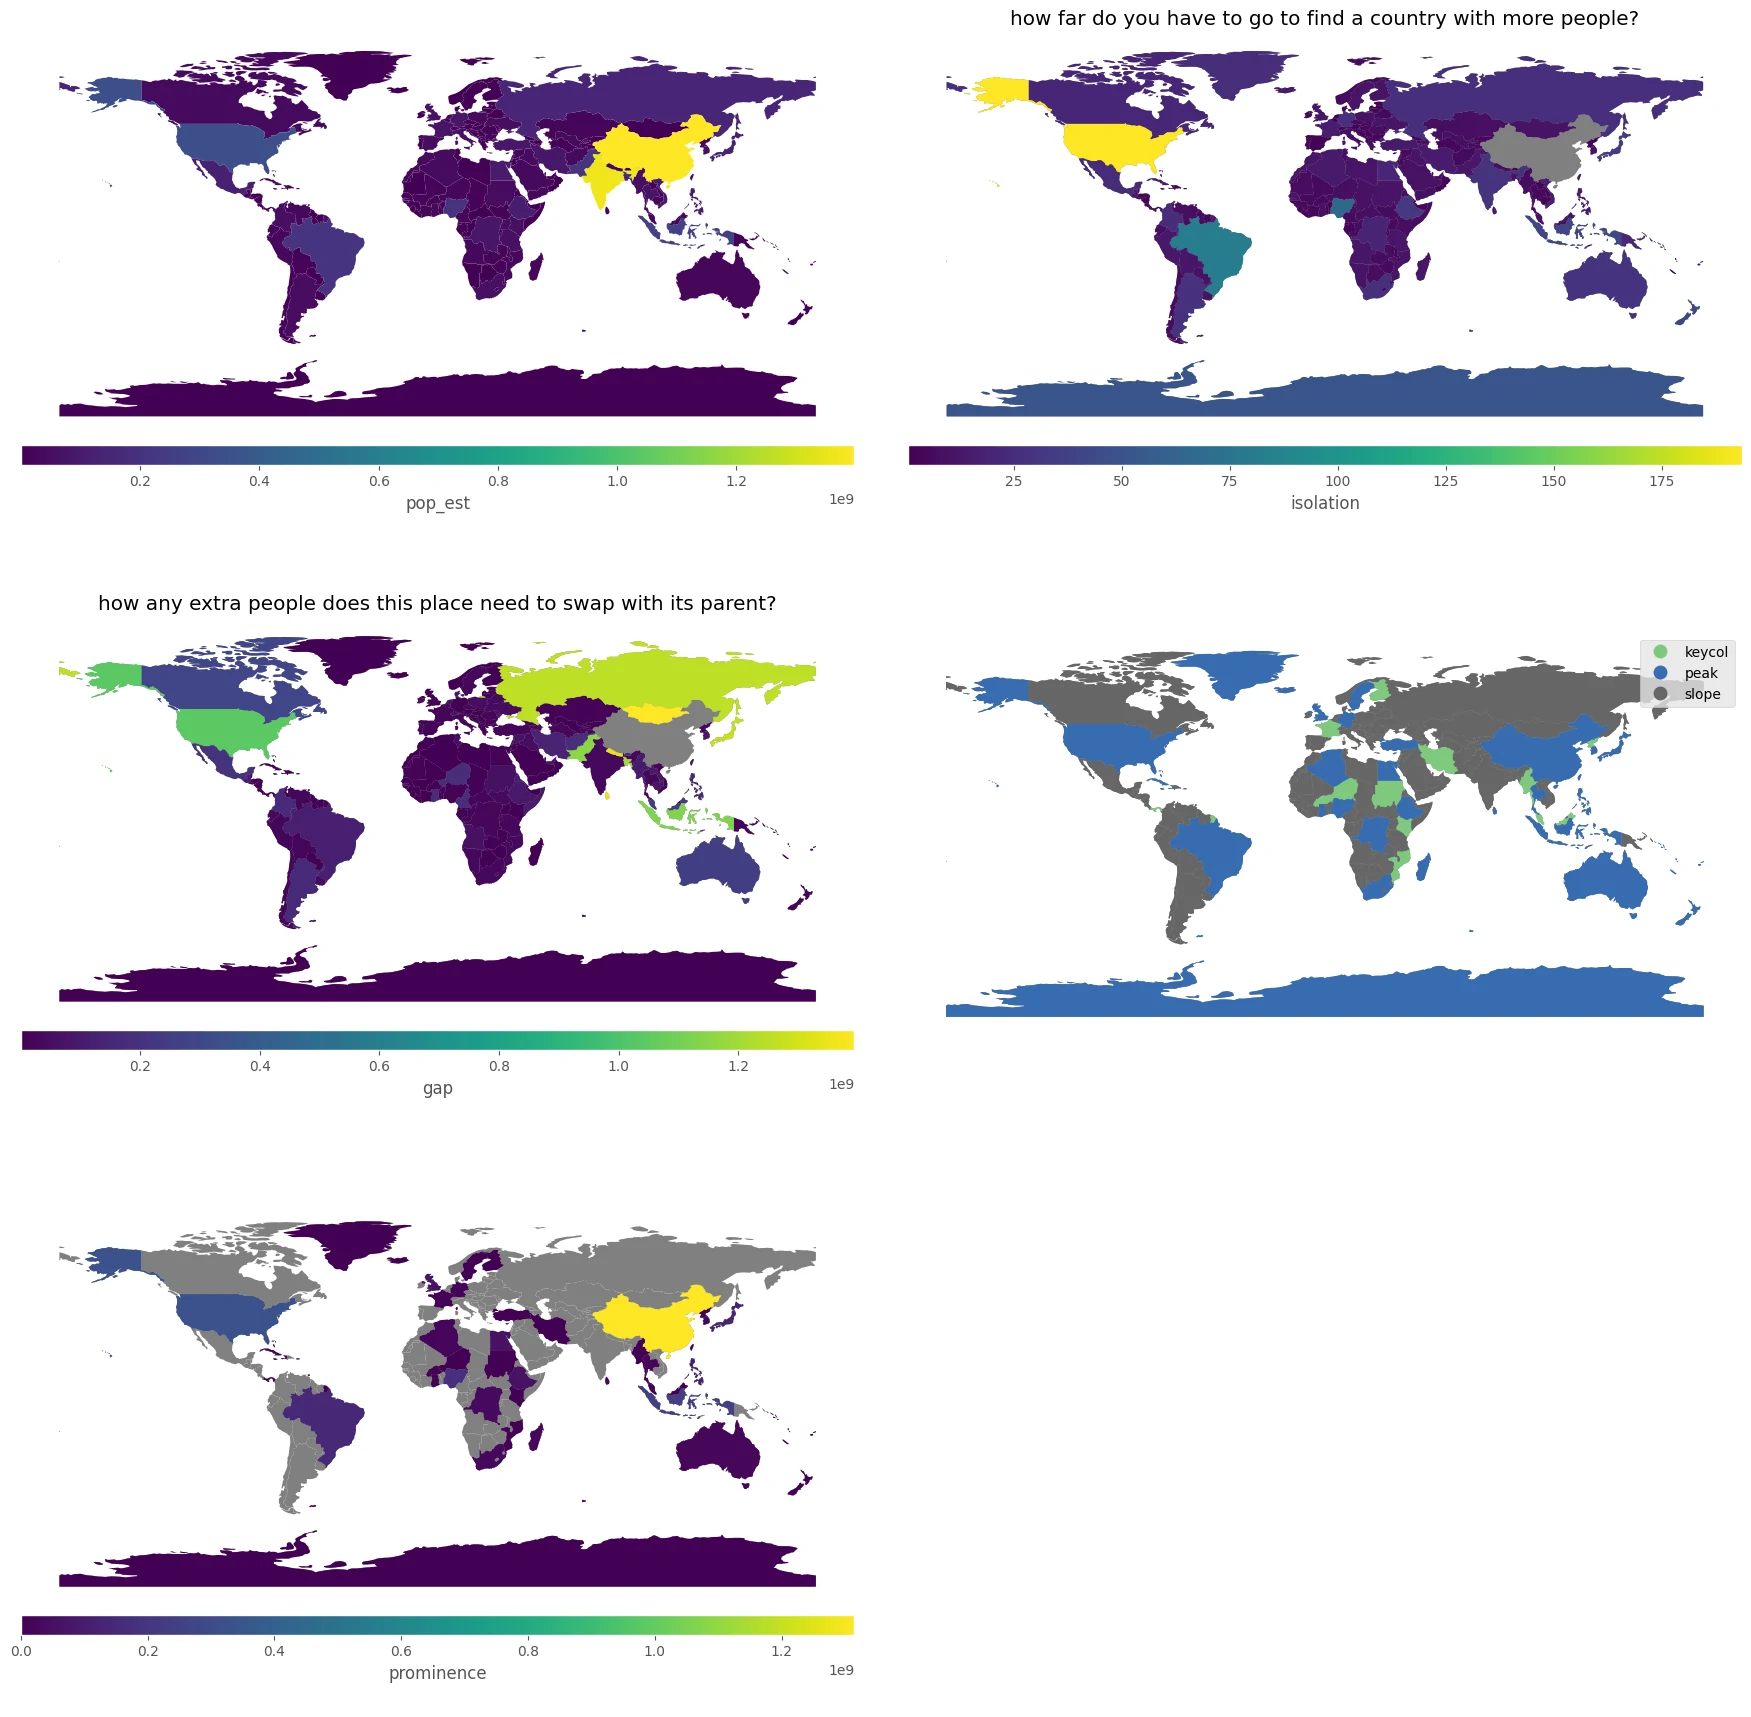
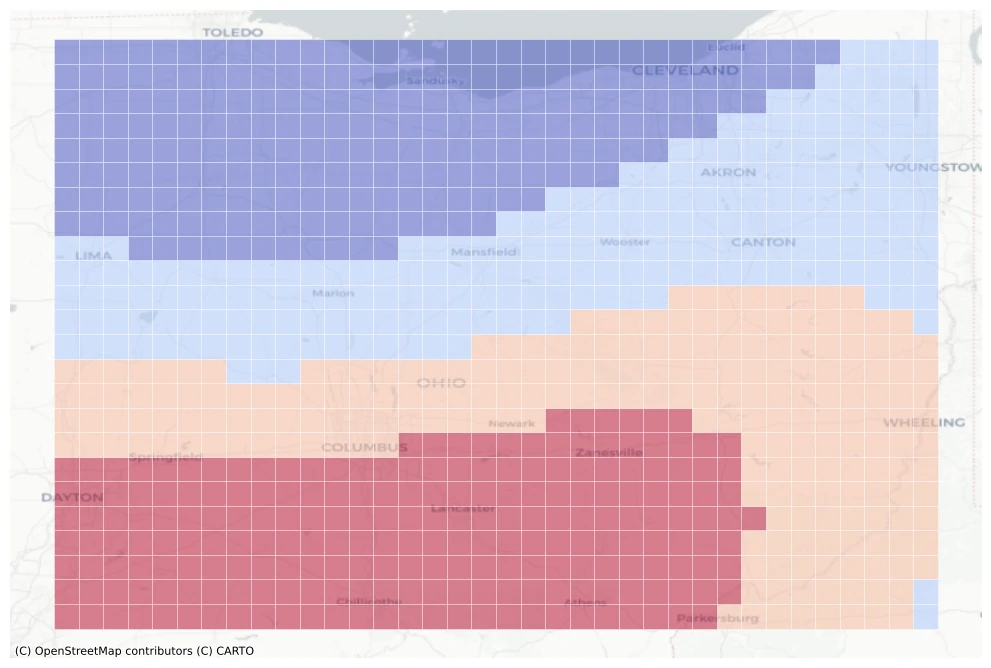
- Spatial hypotesis and autocorrelation Analysis
- Distribution and Density
- Heatmap Distribution
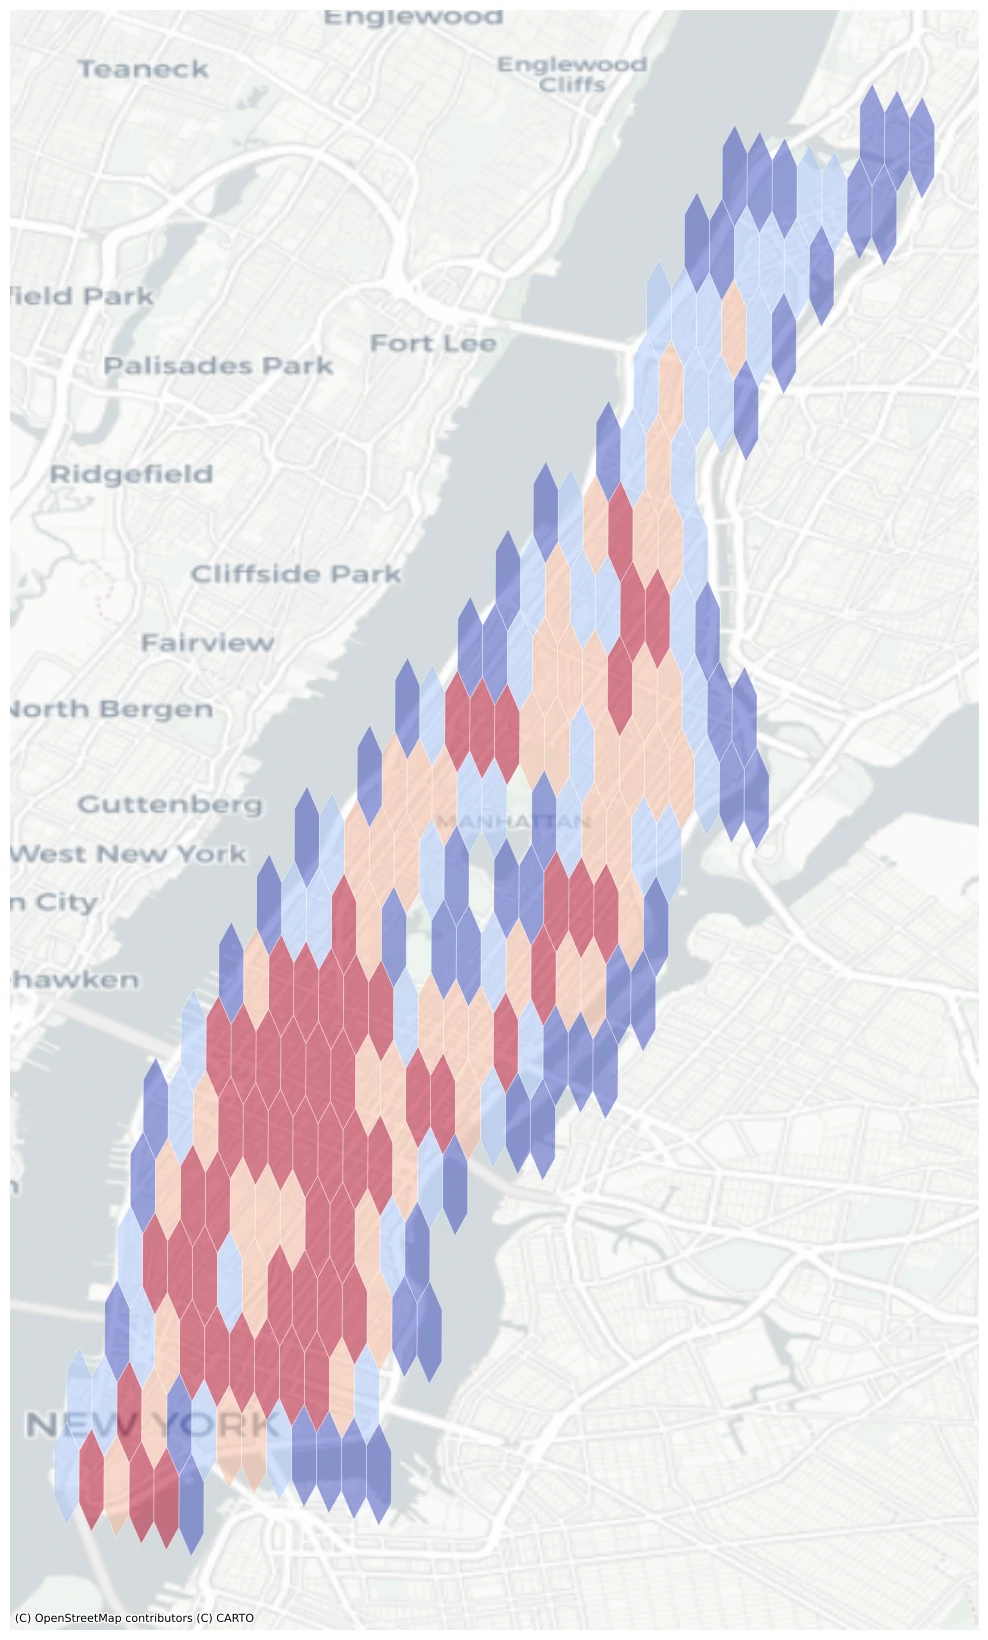
- H3 Spatial Index
- Topological Measures
- Heatmap Distribution
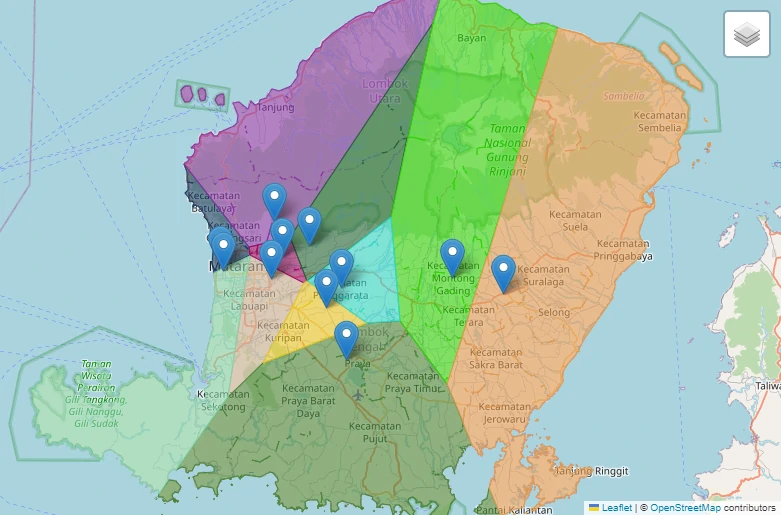
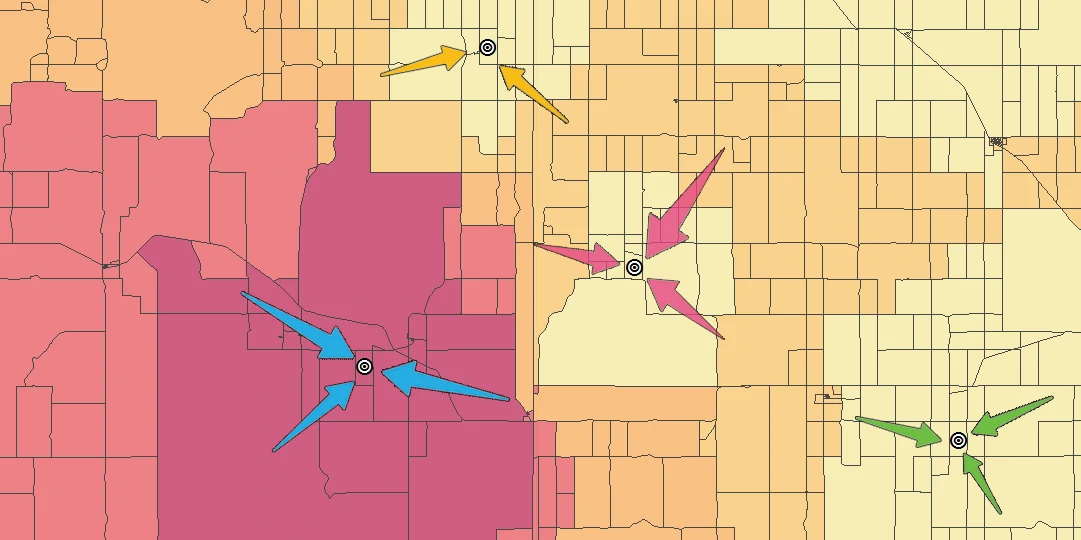
- Regionalization and Coverage Area
- Covering Radius Method
- Voronoi Diagram
- Clustering and Segmentation
- Isochrone
- Location Revenue Prediction
- Colopriming Analysis (visual diagnostic)
- Hexagon grid
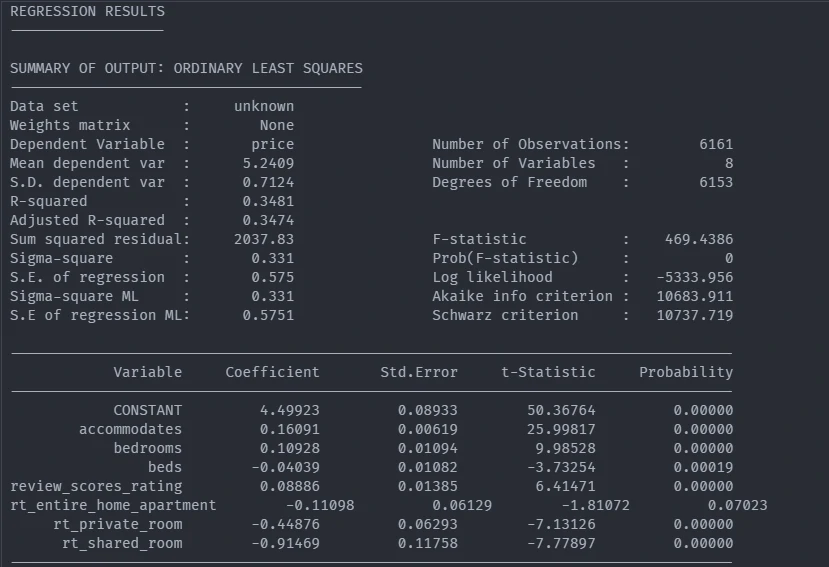
- Spatial Regression Prediction
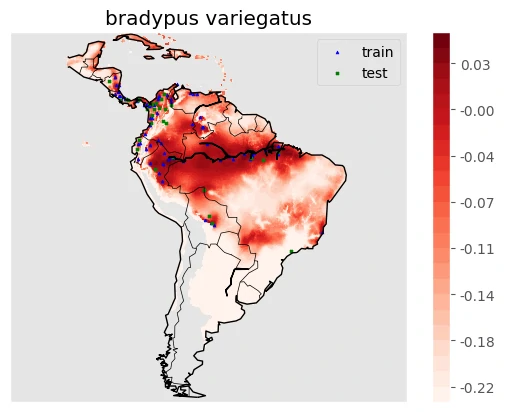
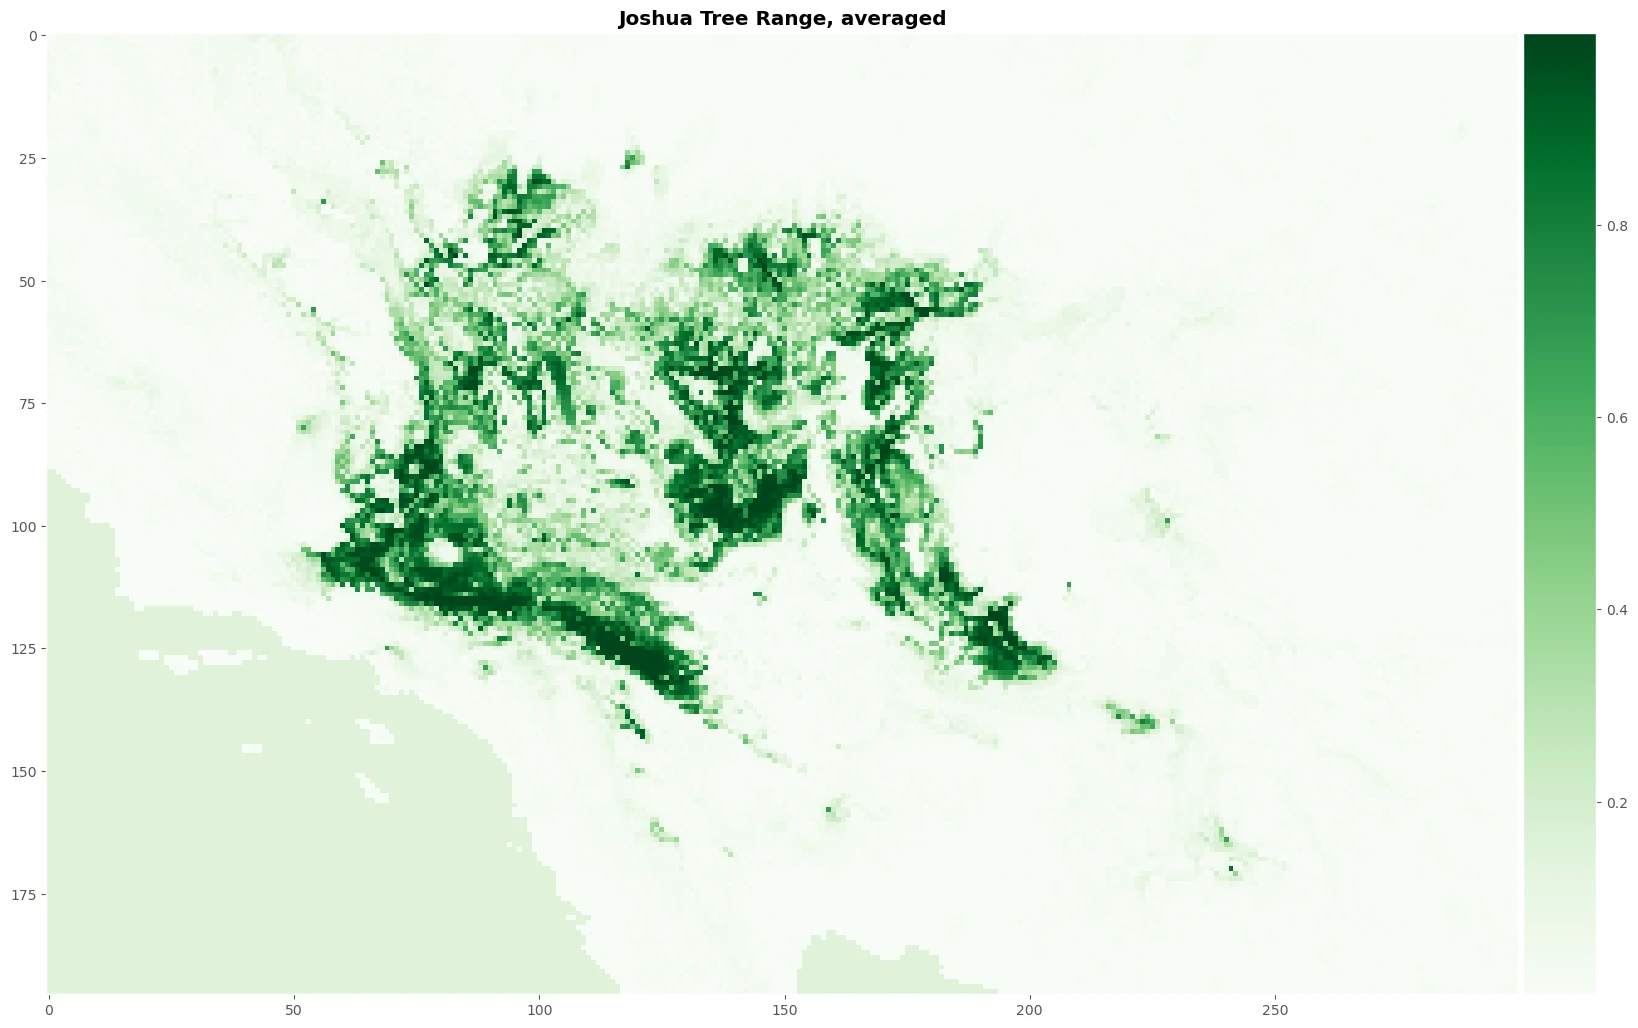
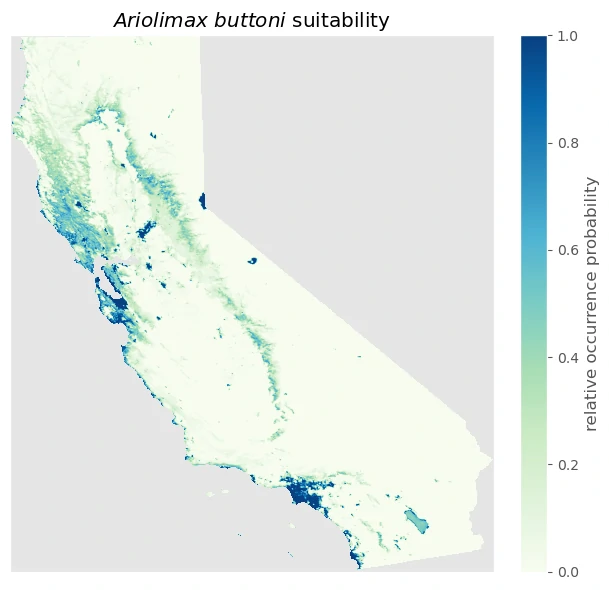
- Species Distribution Modeling (SDMs)
- Unsupervised Learning
- Supervised Learning
- Maxent Model
- Unsupervised Learning
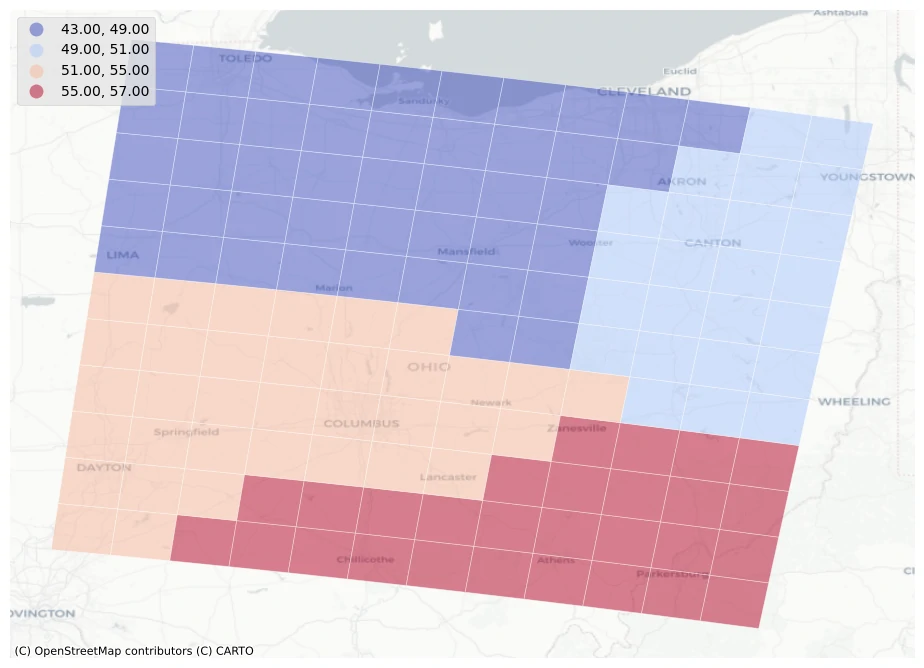
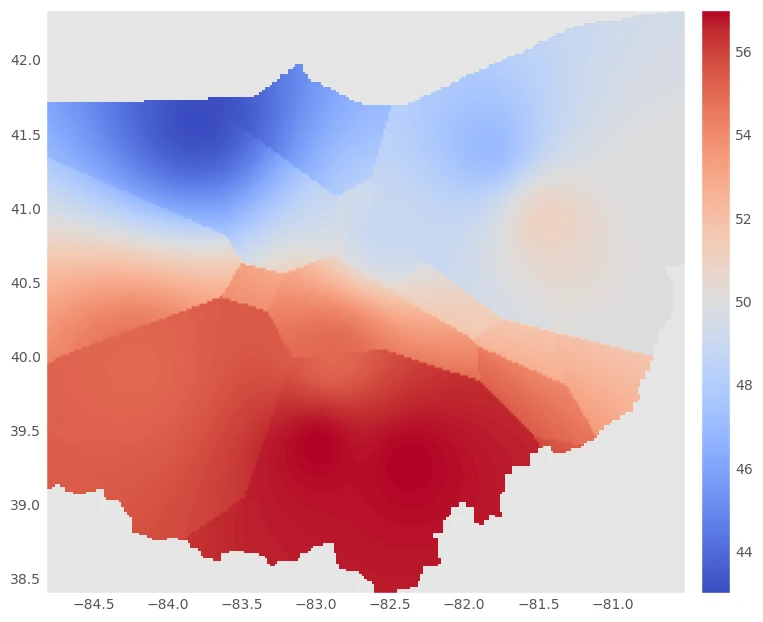
- Spatial Interpolation
- Nearest ND Interpolator
- Inverse Distance Weighted (IDW) interpolation
- Kriging-based interpolation
- Nearest ND Interpolator
- Geocoding
- Analyze Distance and Attractiveness
- Huff Model
- Huff Model
- Change Predition at Spatial and Temporal
- Cellular Automata-Markov Model
- Cellular Automata-Markov Model

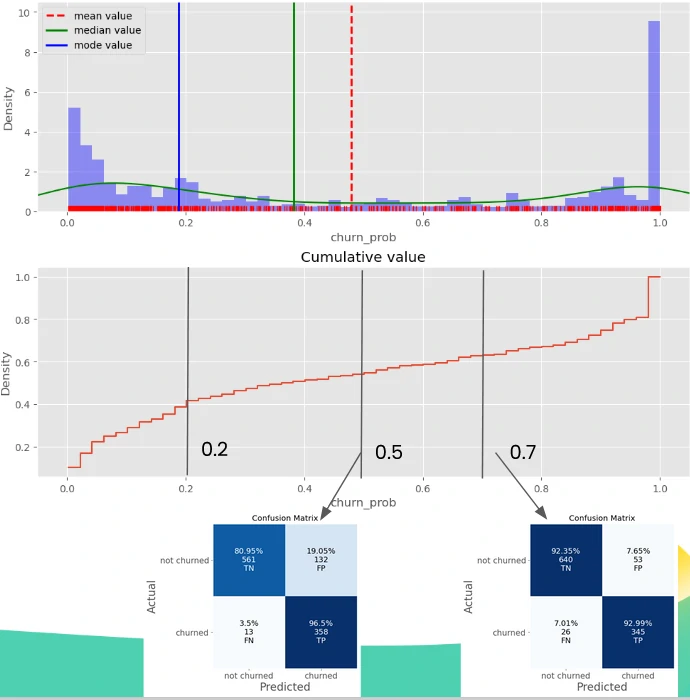
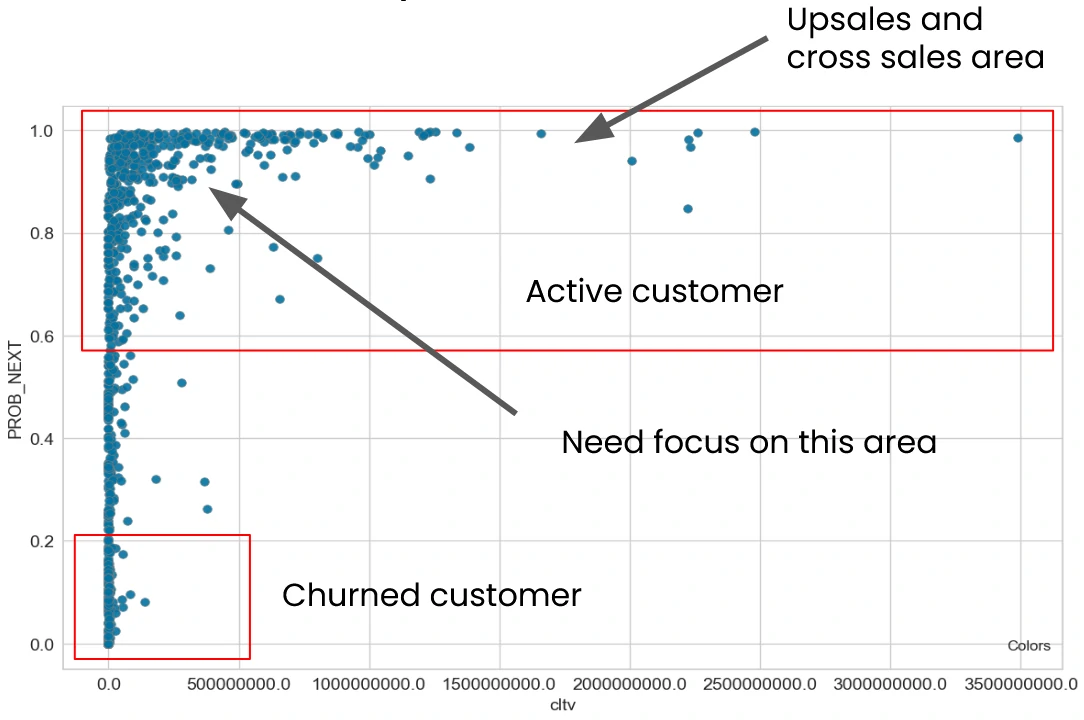
Propensity / Churn / CLTV
- Buy Till You Die (BTYD) Models
- Behavioral & Sequence-Based Models
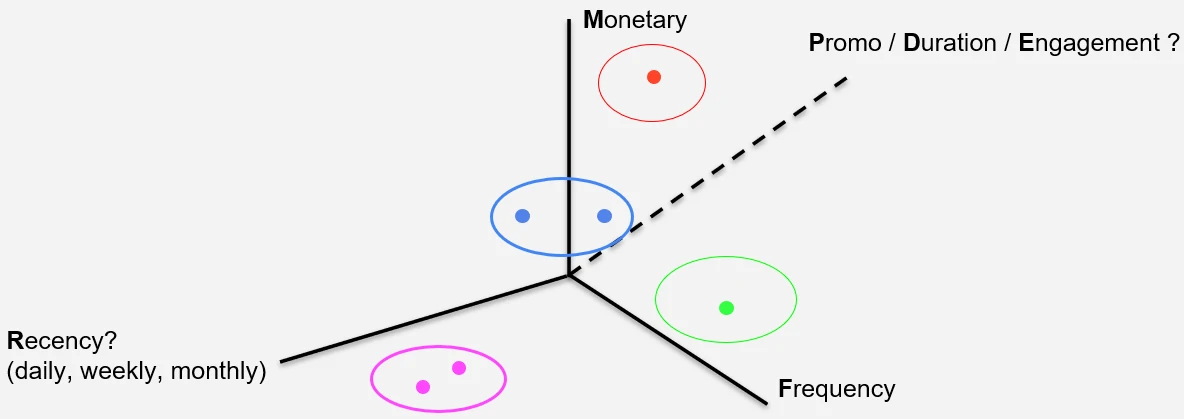
- RFM + ML classifier
- RFM scoring
- Survival Analysis
- Time-to-Event Models
- Hazard Models
- Machine Learning
- Deep Learning
- Hybrid & Business-Oriented Models
- Rule-Based + ML Hybrid
- Customer Scoring Systems
- Markov Chain Models
- Causal & Uplift Models
- Cross-sales Models
- Next-product-to-buy algorithms
Recommendation System
- Market Basket analysis
- APRIORI
- Eclat
- FP-Growth
- Classic algorithms
- Baseline
- NormalPredictor
- SVD and SVD++ algorithm
- Non-negative Matrix Factorization
- Stochastic Gradient Descent (SGD)
- Weighted Alternating Least Squares (WALS)
- SlopeOne algorithm
- WARP (Weighted Approximate-Rank Pairwise)
- BPR (Bayesian Personalized Ranking)
- Machine Learning
- Classification models
- Logistic regression
- Logistic matrix factorization
- SVM
- Tree based model
- Ensemble model
- LightGBM / XGBoost
- Clustering techniques
- K-means clustering
- Co-clustering
- Deep Learning
- Neural Collaborative Filtering
- Wide & Deep
- Two-Tower Models (User tower + Item tower)
- Transformer-based session models
- Graph-Recommendation Engine model
- Graph-based recommender
- Learning-to-Rank Models
- LambdaMART
- RankNet
- XGBoost ranking
- LightGBM ranking
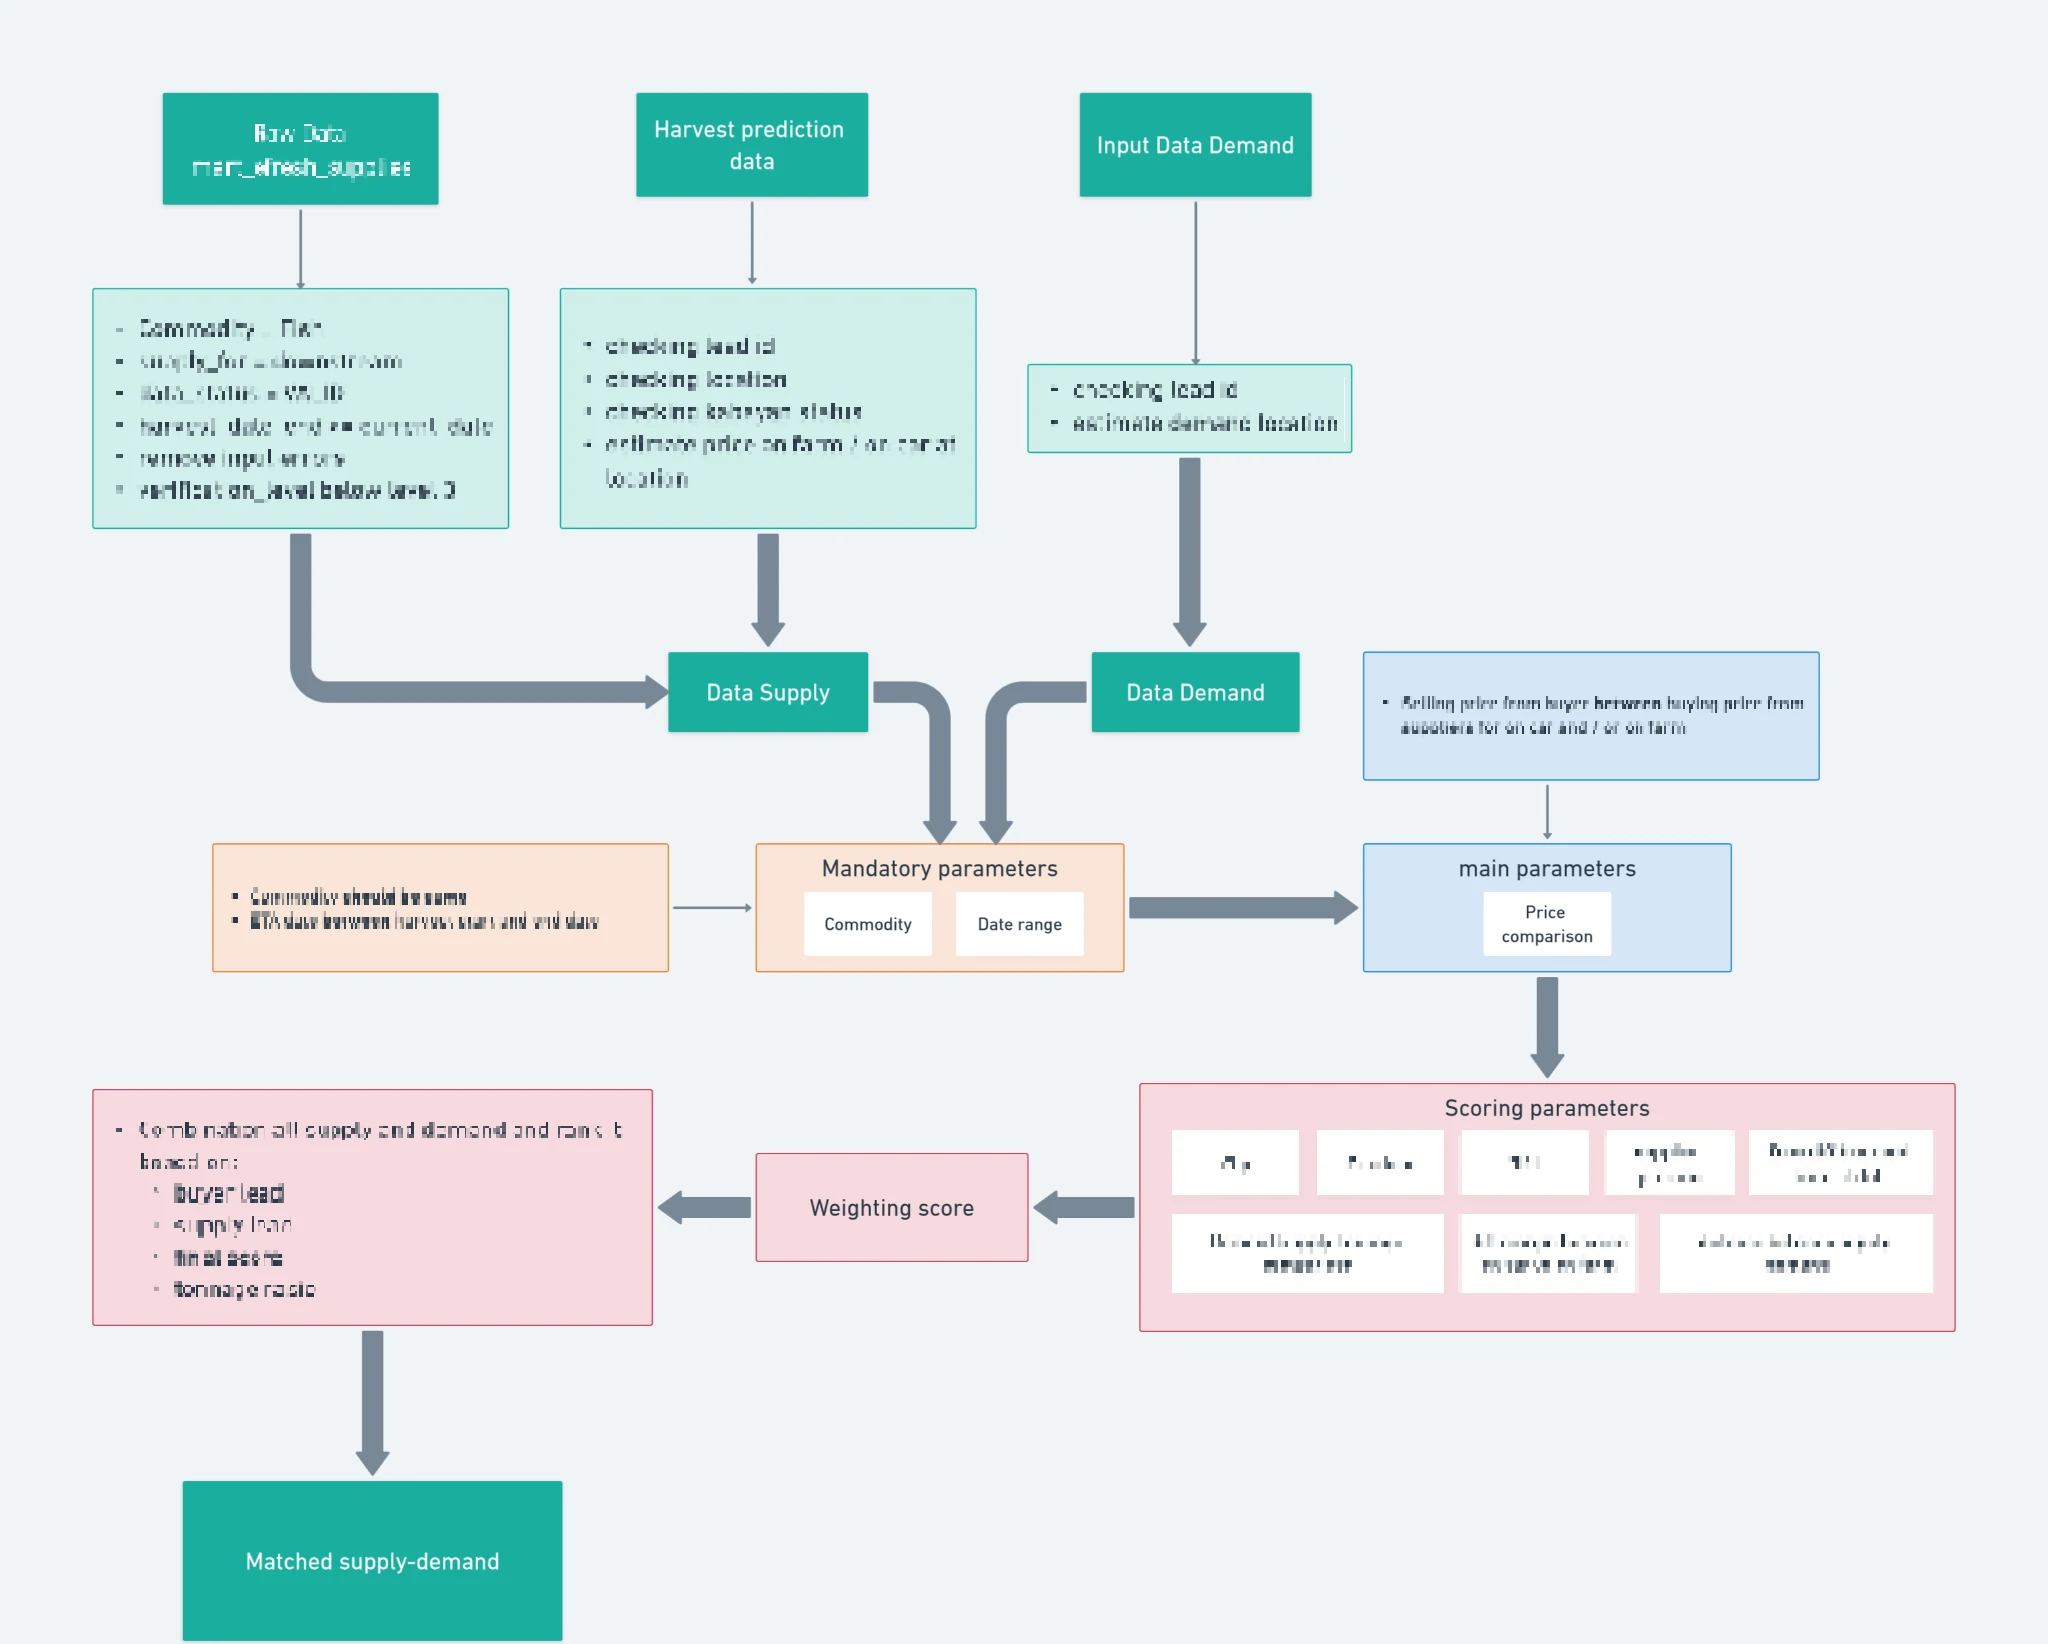
Demand-Supply (Supply Chain)
- Optimizing Supply and Demand Matchmaking (Weight Scoring)
- Optimization Problem
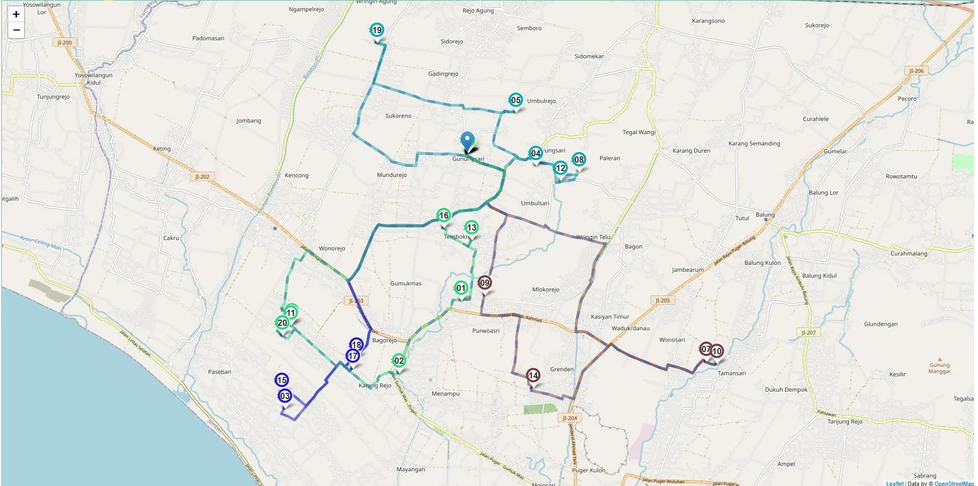
- Route-based combinatorial optimization problems
- TSP
- VSP
- Deep Reinforcement Learning
- Constrained sequential decision-making task and implementing policy-gradient methods (REINFORCE) for heterogeneous fleets with time window constraints.
- TSP
Inventory and Warehouse
- ABC analysis
Segmentation
- Clustering
- Centroid-Based
- K-means, K-means++, MK-means
- K-modes, K-medians, K-prototypes
- Clara, Clarans
- CentNN
- Mean Shift
- Graph-Based
- K-spanning Tree
- Shared Nearest Neighbor
- Betweenness Centrality Based
- Highly Connected Components
- Maximal CLique
- Spectral Co-clustering
- Spectral Bi-clustering
- Hierarchical Clustering
- Spectral Clustering
- Agglomerative Clustering
- Kernel-Based
- SOM and minisom
- Neural Gas
- Fuzzy C-means
- Probabilistic C-Means
- Grid-Based
- Wavecluster
- Sting
- CLIQUE
- VBSCAN
- Density-Based
- DBSCAN
- AD, FD, LD, OD, PD - DBSCAN
- OPTICS
- Denclue
- Connectivity-Based
- Birch
- UPGMA
- AGNES
- DIANA
- Chameleon
- BICO
- CURE
- Affinity Propagation
- Distribution-Based
- Gaussian Mixture
- EM
- DMM
- DBCLASD
- Hidden Markov Models (HMM)
- Fractal-Based
- FractStream
- FC
- Centroid-Based
- RFM (recency, frequency, monetary)
- Hyperpersonalized marketing campaigns
Marketing budget allocation
- Media Mix Modeling
Marketing strategic
- Online learning - Thompson Sampling
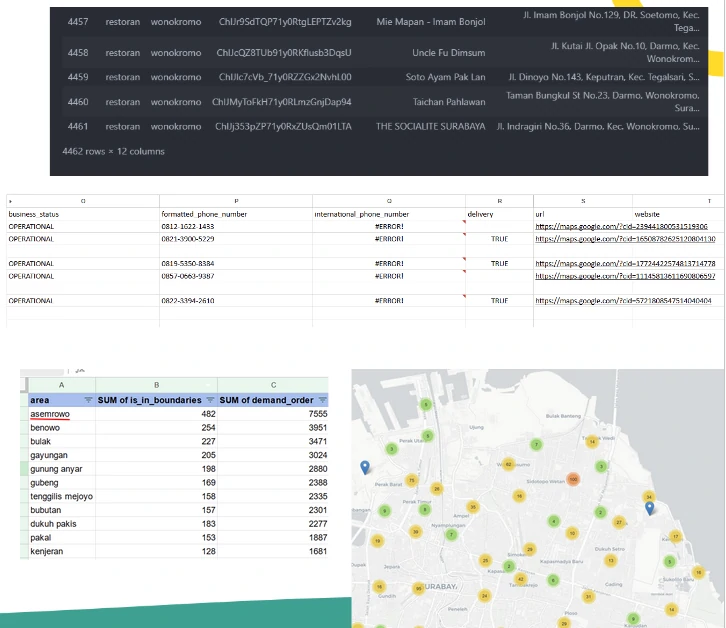
Market Research Analysis
- Crawling POI data
- Market sharing
- Market expansion and competition
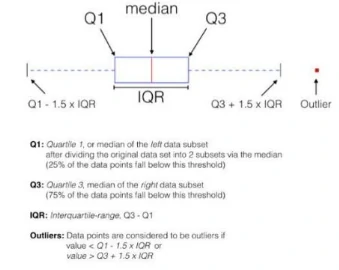
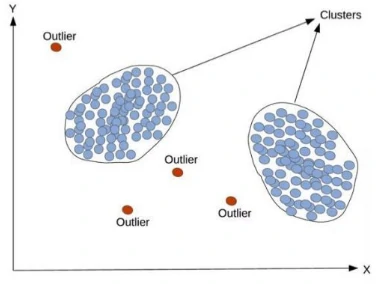
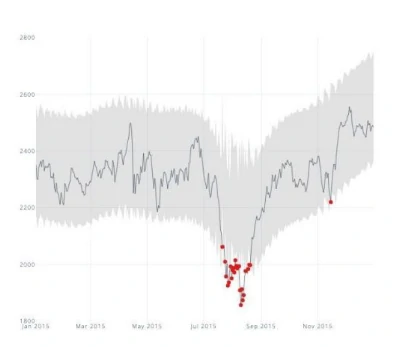
Anomaly and Fraud Detection
- Statistical Tests and Visualization
- Proximity and Clustering
- KNN
- KNN
- Time Series
- STL Decomposition
- STL Decomposition
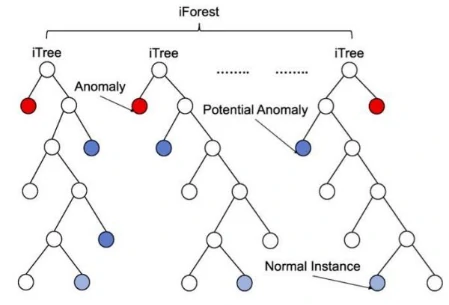
- Machine Learning
- Isolation Forest
- Isolation Forest
Behavioral Modeling
- Survival Analysis
- Applications: engagement retention, churn prediction, time-to-first-action
- Time-to-event modeling
- Kaplan-Meier estimators
- Cox proportional hazards
- Time Series
- Applications: temporal engagement patterns, lagged effects, sequence prediction
- ARIMA
- autocorrelation (ACF/PACF)
- Granger causality
- state-space models
- Causal Inference
- Applications: measure impact of interventions, A/B test analysis, policy evaluation
- Difference-in-differences
- propensity score matching
- instrumental variables
- regression discontinuity
- Network Analysis
- Applications: information spread, influencer identification, network effects
- Graph theory
- diffusion models
- centrality measures
- community detection
- Sequential/Longitudinal Modeling
- Applications: user journey modeling, state transitions, behavioral sequences
- Markov chains
- Hidden Markov Models
- panel data methods
- mixed effects models
Ifluential Features
- Feature Importance
- Machine Learning + Interpretable model
- Statistic Test
Scoring
- Linear Regression
- Beta weight
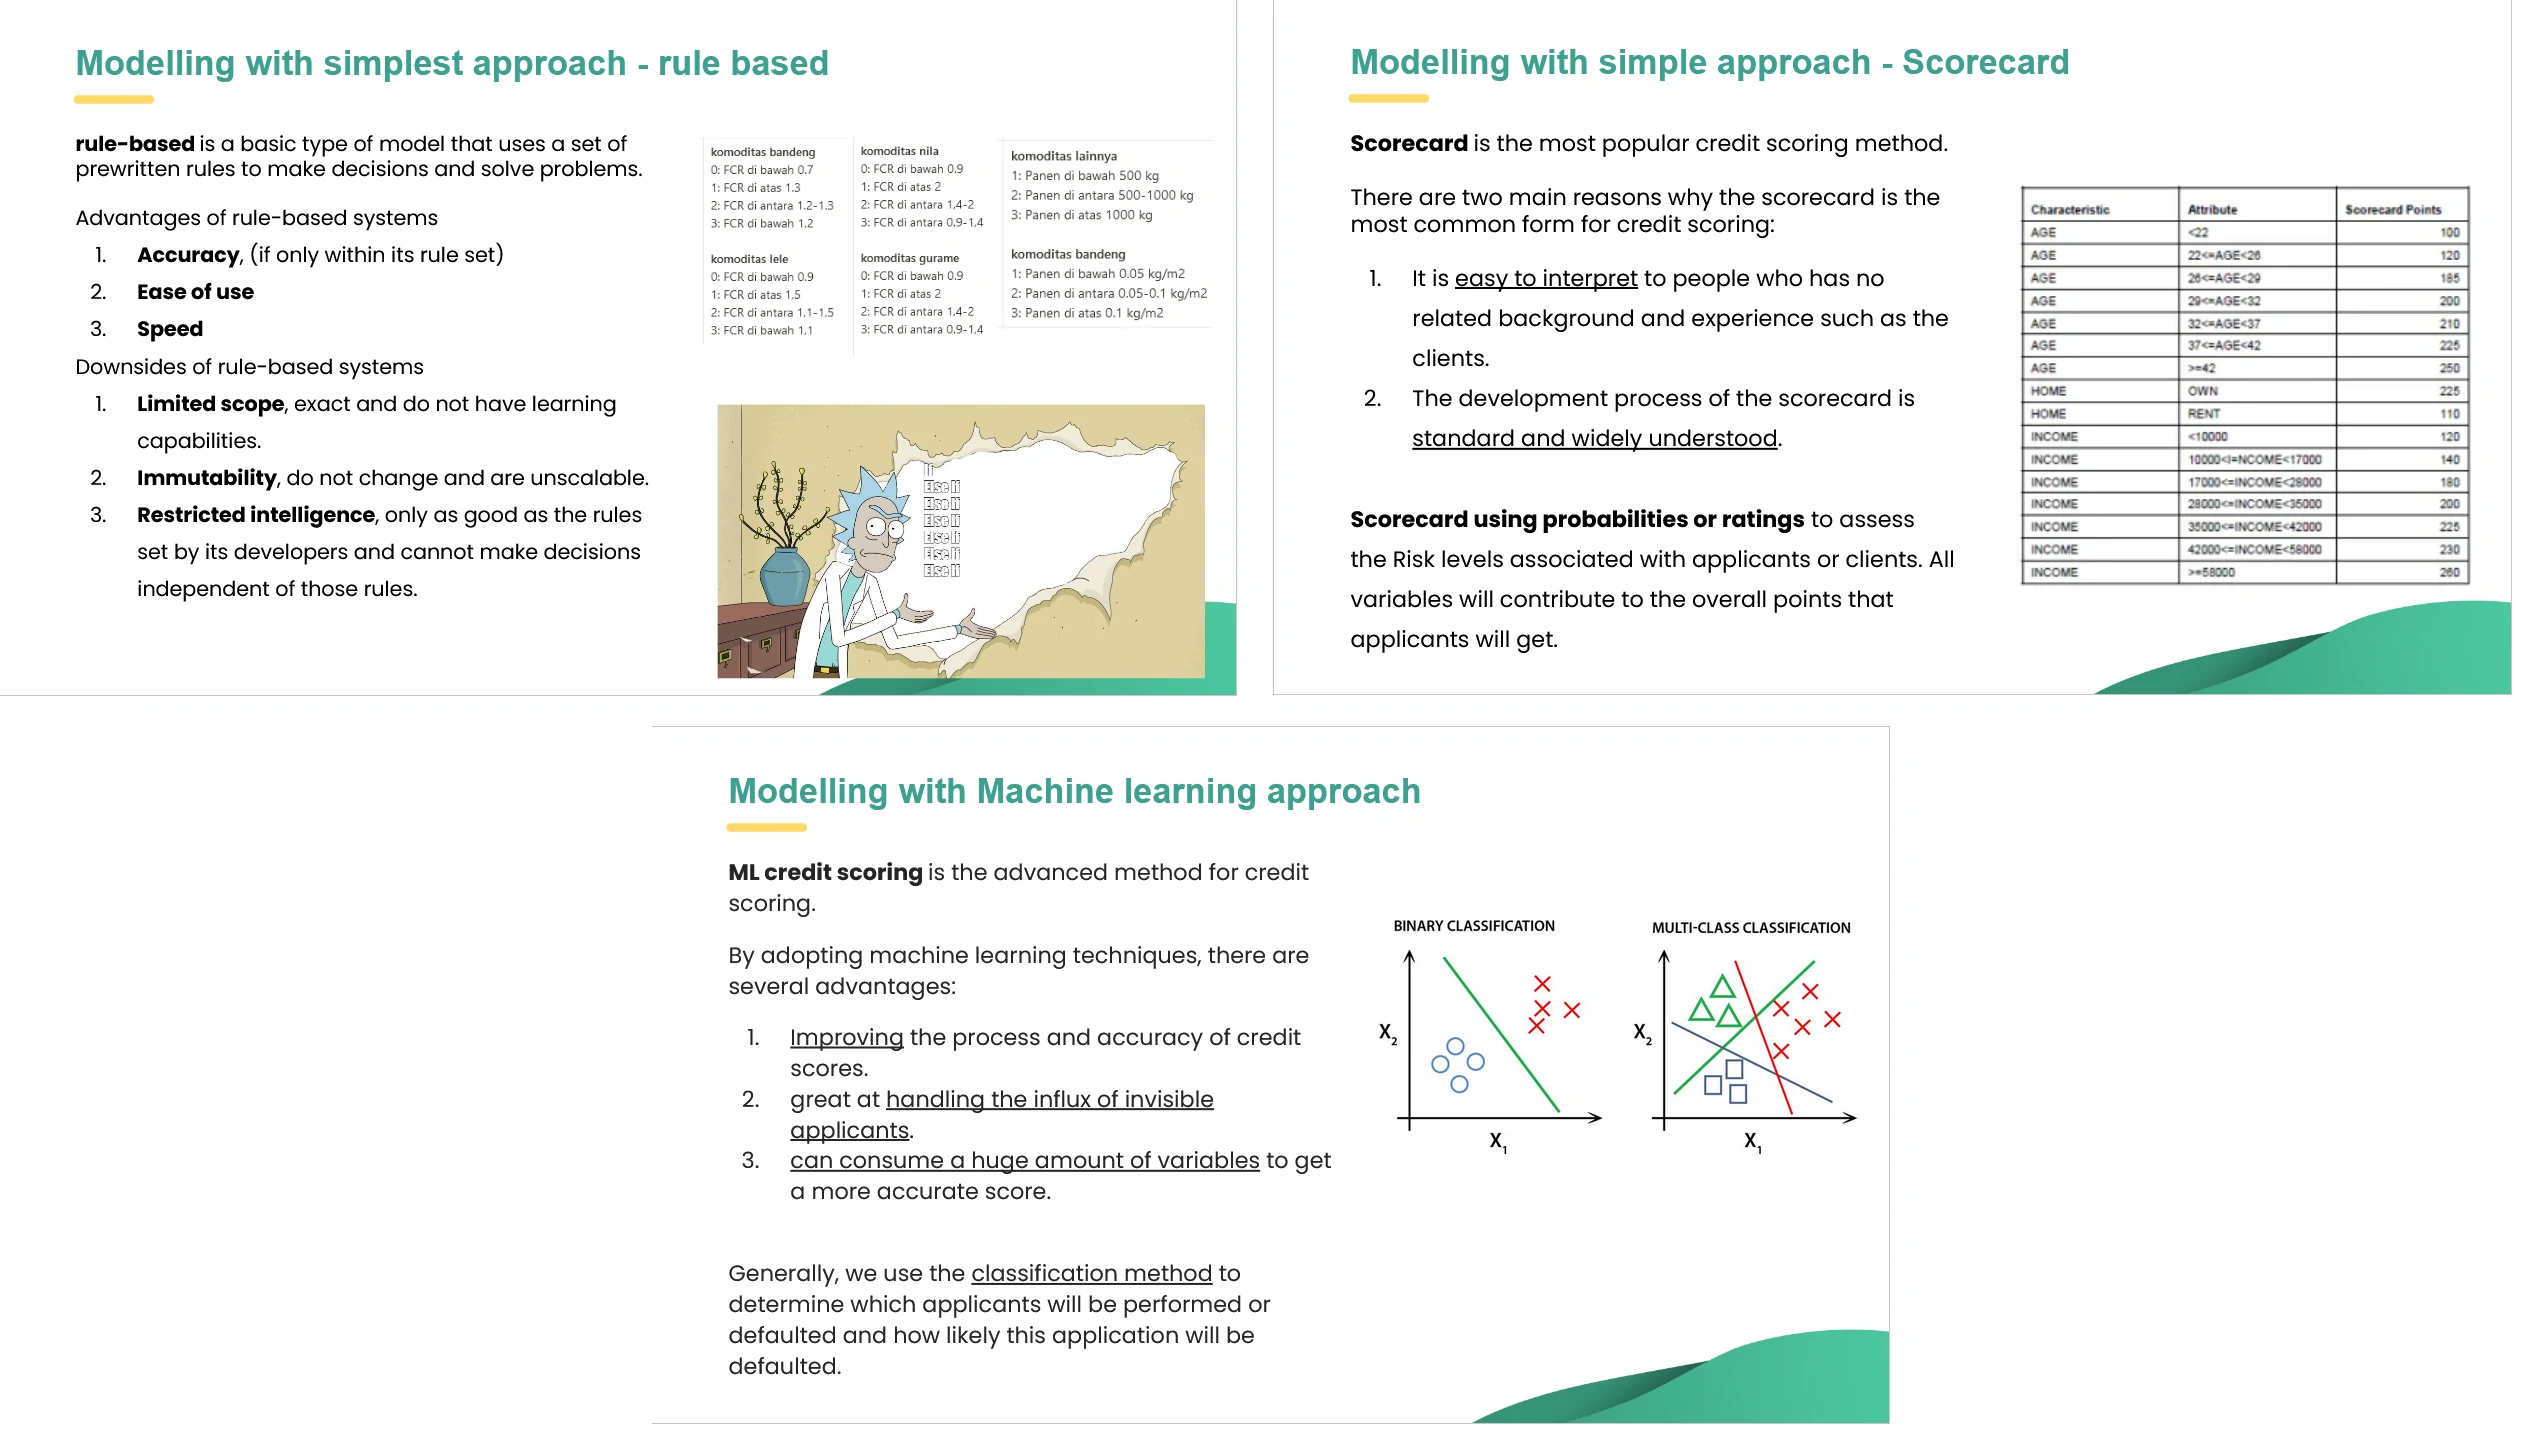
Credit Scoring
- Scoring type A
- Rule based
- Scorecard
- Machine learning
- Deep Learning
- Scoring type B
- Bayesian Approximation + custome scoring
Data collection
- Scraping data
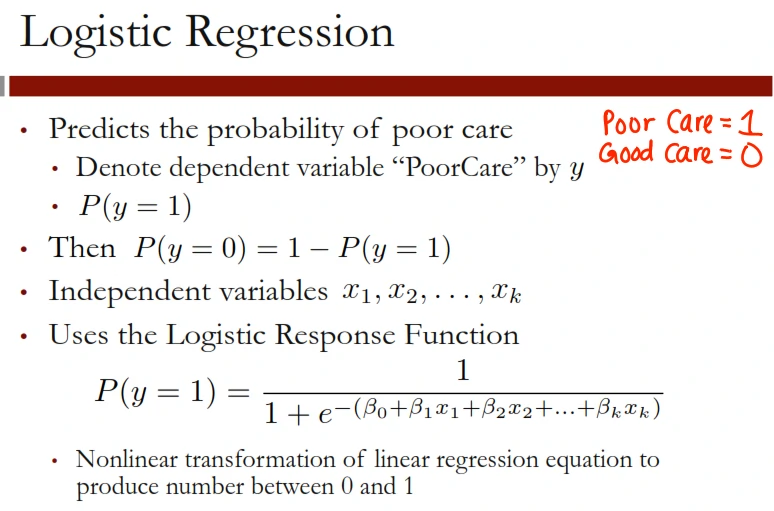
Prediction (binary or multiclass)
- Logistic Regression
Time Series Prediction
Distance Measurement
- Spatial Distance Metrics
- Manhattan Distance
- Euclidean Distance
- Chebyshev Distance
- Minkowski Distance
- Mahalanobis Distance
- Minimum-Maximum Coordinate Distance
- Centroid Distance
- Vector Similarity Metrics
- Cosine Similarity
- Jaccard Similarity
- Sorensen-Dice Coefficient
- Levenshtein Distance (Edit Distance)
- Hamming Distance
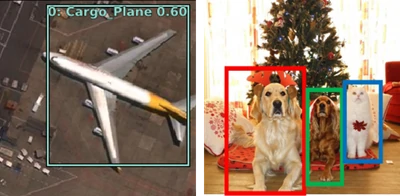
Computer Vision
- Image Classification
- Object Detection
- Object Counting
- Object Tracking
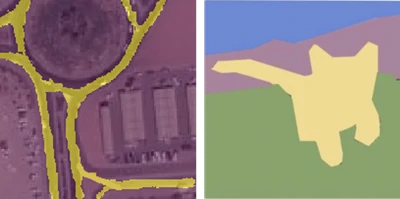
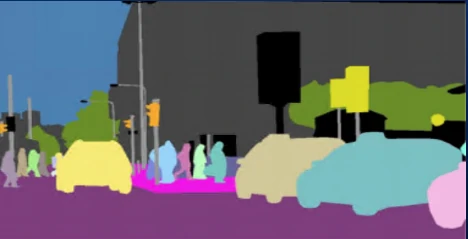
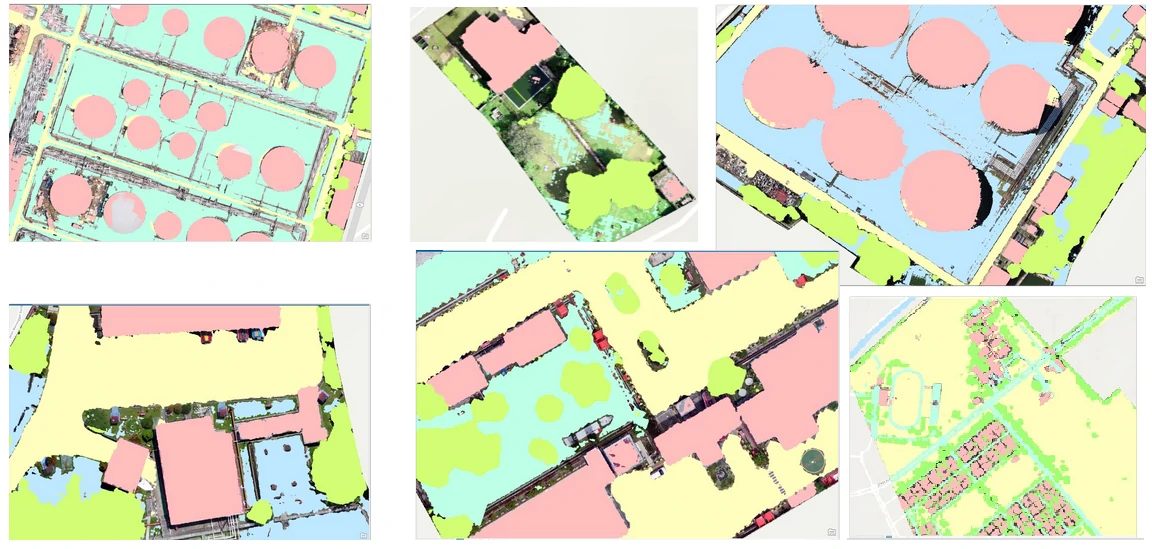
- Semantic Segmentation / Pixel Classification
- Object Measurement
- Instance Segmentation / Object Segmentation
- Panoptic Segmentation
- Change Detection
- Image Translation
- Object Tracker
- Image Captioning
- Pose Estimation
- Face Detection
- Facial Recognition
- Emotion Detection
- Anomaly Detection
- Optical Character Recognition (OCR)


GeoAI
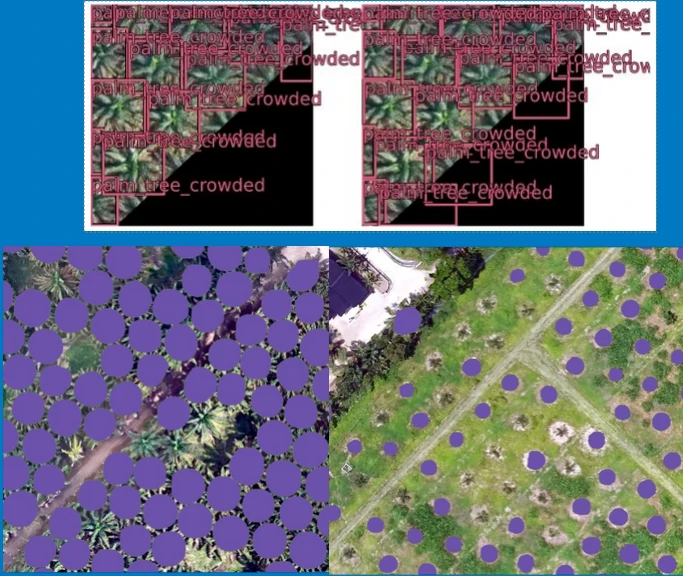
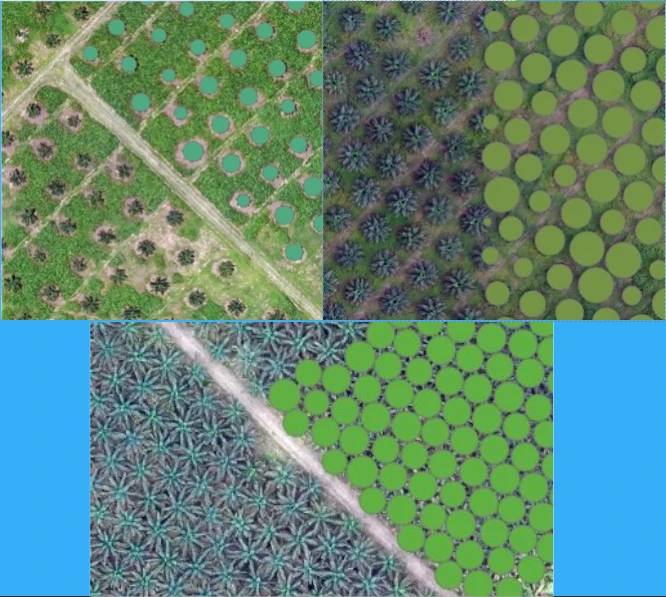
- Vegetation and Natural Environment
- Object Detection - Counting
- Segmentation - cover area
- Distribution and Density
- Forest Canopy Density -
AVI + SSI + BI = Vegetation Density
- Forest Canopy Density -
- Forcasting Area
- Sustainability
- Indexs
- Estimating flashflood likelihood
- Species Distribution Modeling (SDMs)
- Change Predition at Spatial and Temporal
- Deforestation monitoring
- Vegetation phenology variation study
- Coastal and Ecosystem monitoring
- Predicting Vegetation Dynamics
- Object Detection - Counting
- Urban, Bussiness and Building
- Object Detection - Counting
- Segmentation - cover area
- Distribution and Density
- Accessibility
- Spatial-Temporal Development
- Encroachment - Change Detection
- Zoning and Regulatory Mapping
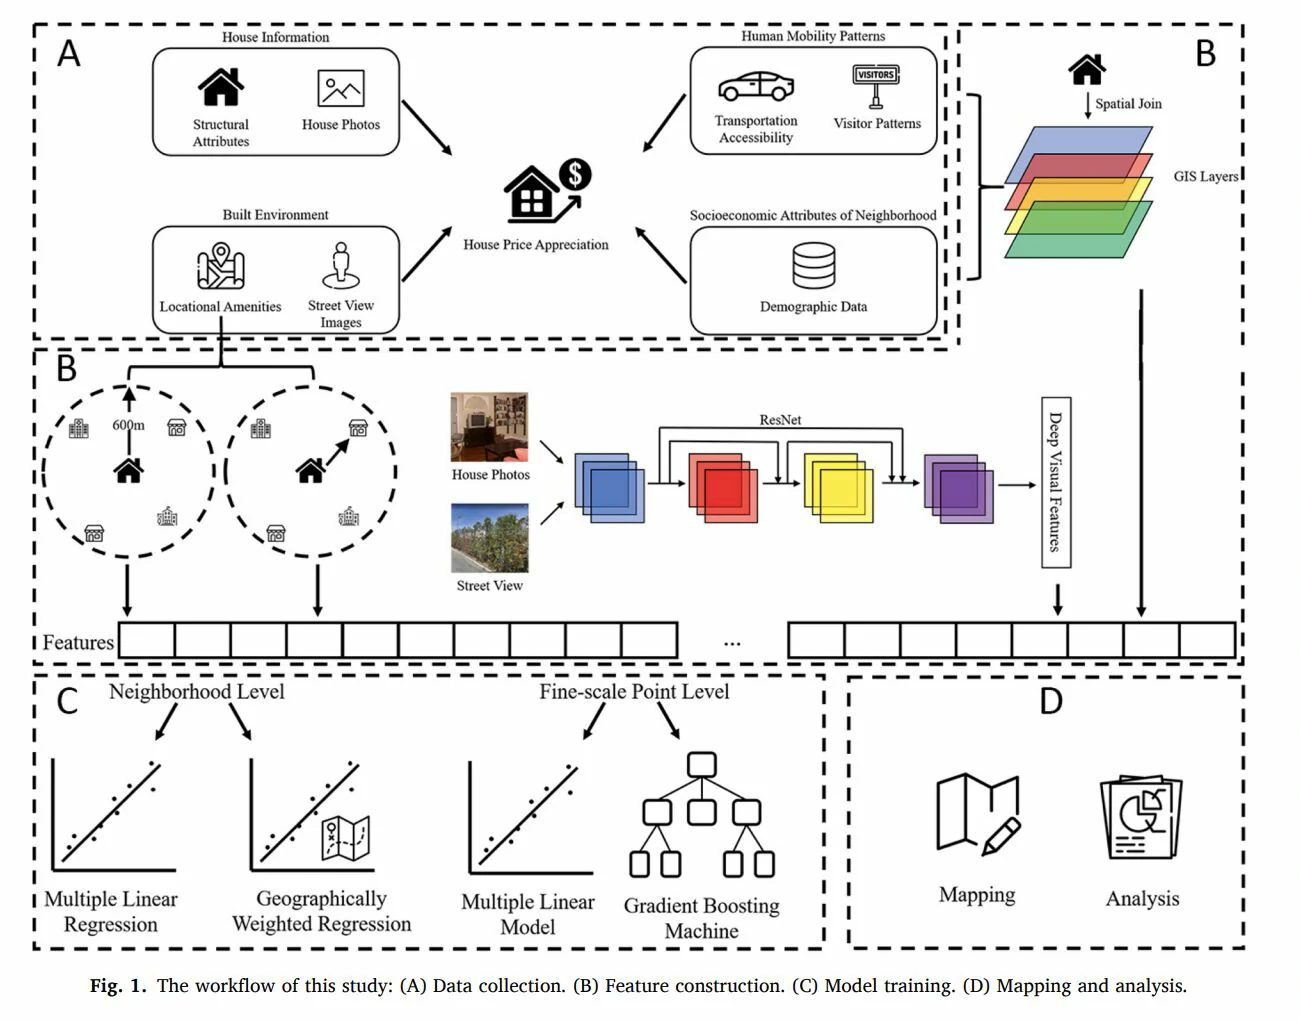
- Property Value Mapping (Predict House Price)
- House photos (interior/exterior visuals)
- Street view images (neighborhood context)
- Human mobility patterns (visitor foot traffic and travel times)
- Socioeconomic indicators (census level demographics)
- Spatial location and proximity to POIs
- POI Prediction for Business Opportunity Mapping
- Service Area Optimization
- Geotagged social media activity
- Indexs
- Demographic and Economic Index
- Market Expansion Index
- Market Sharing Index
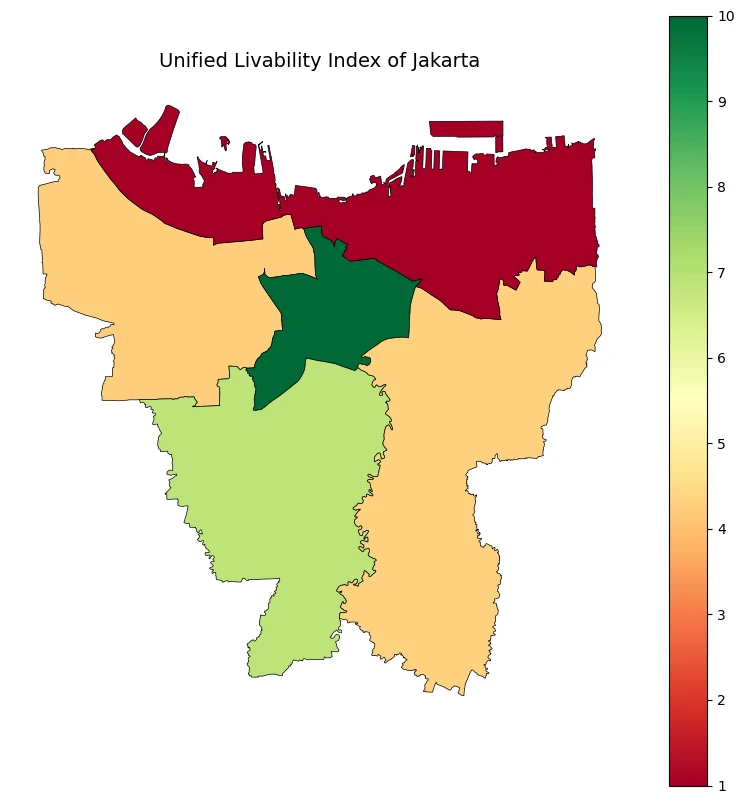
- Livability Index
- Hyperscale Infrastructure Intelligence Index
- Electricity resources accessibility
- High-voltage transmission adjacency
- Substation and generation proximity
- Land-use and protected areas
- Urban or Human Settlement
- Water area
- Forest area
- Terrain and topography
- Climate exposure and cooling risk
- Electricity resources accessibility
- Spatial Regression Prediction
- Monitoring of Sustainable Development
- Species Distribution Modeling (SDMs)
- Analyze Distance and Attractiveness
- Change Detection and Predition at Spatial and Temporal
- Urban Sprawl
- ML / DL + Cellular Automata
- Post-disaster event (damage assessment)
- Urban Sprawl
- Mining
- Detection and Segmentation mining pits and tailing dams
- Interactive querying data
- LLM
- Mineral Detection
- Lineament analysis
- Automated spectral mapping system using ASTER data on Google Earth Engine (GEE)
- Machine Learning
- Lithological and Structural Mapping
- Iron Oxide and Clay Mapping
- Alteration Zone Mapping
- Mixture-Tuned Matched Filtering (MTMF)
- Spectral Angle Mapper (SAM)
- Geochemical Anomaly Detection
- Improvements
- Automated cloud and shadow mask segmentation
- Measurement distance to specific object or area - create grids
LLM and Gen AI
- Telecomunication
- Voice identification for prioritization
- Chatbot for Q&A
- Autonomous assistants
- Predict network issues
- Cloud management
- Network Anamolies Resolution
- Reduce manual effort
- Speed up fault detection
- Improve network reliability
- Real-time recommendations
- Address problems before they escalate
- Ensuring a more stable and efficient network
- Network Optimization
- Capacity Management
- Real-time Issue Detection
- Marketing
- Targeted offers and recommendations (hyper-Personalization)
- Generates personalized messages
- Automated Content Creation
- RAG
- Knowledge Management
- Customer Support (FAQs, User Manuals and troubleshooting guides)
- Research Assistance
- Content Curation
- Summarisation
- Language Translation