Churn and Propensity Analysis (Part 2)
Churn Analysis
CLTV
propensity
Buy Till You Die (BTYD)
What its mean?
A class of probabilistic models, is designed to capture the behavioral characteristics of non-contractual customers, or when the company is not able to directly observe when a customer stops being a customer of a brand. This model used a distribution model to fit and predict customer churned.
ELI5 process?
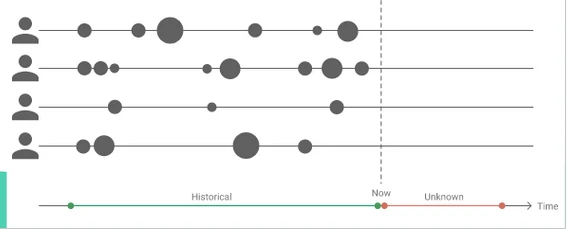
BTYD models all jointly model two processes:
- a repeat purchase process, that explains how frequently customers make purchases while they are still “alive”.
- a dropout process, which models how likely a customer is to churn in any given time period.
Why this model useful?
- Easy to implement, explaining and using only essential features (i.e. transaction data).
- More robust, accurate and interpretable.
- Can continued to calculate the CLTV value (CLTV is a measurement of how valuable a customer is to the product.)
BYTD model can answers these kind of questions:
- How many customers are active?
- How many customers will be active one year from now?
- Which customers have churned?
- How valuable will any customer be to the company in the future?
- How is the health of our business based on the next estimated transaction?
Model Output
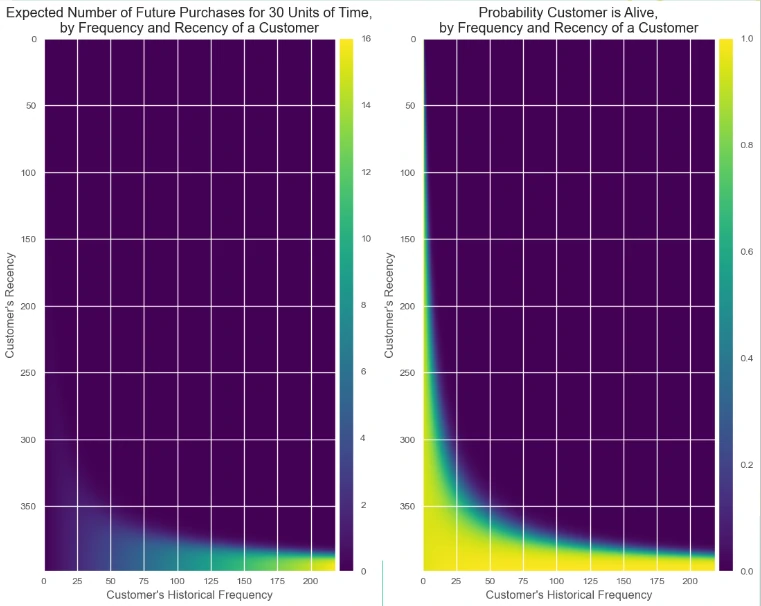
One of the key outputs of the model is the Frequency–Recency Matrix. This matrix helps explain how recent activity and transaction frequency relate to future behavior. It gives a forward-looking view of how likely customers are to stay active.
Customers with high frequency and long active history stand out clearly. Those with frequency above 50 and recency above 350 days are expected to make more than four transactions in the next month. This indicates a strong and stable customer segment.
The probability of a customer being “alive” also follows a clear pattern. Customers with recency above 50 days already show a probability above 0.5. This probability increases further when both recency and frequency are high.
In contrast, customers with low recency and low frequency show weaker signals. They are less likely to return. Overall, only customers with strong engagement, either through frequent transactions or sustained activity, have a high probability of staying active.
What the insights from the BTYD model?
The BTYD model provides a probabilistic view of customer churn. It does not rely only on fixed rules. Instead, it estimates the likelihood of a customer still being active based on behavior patterns.
-
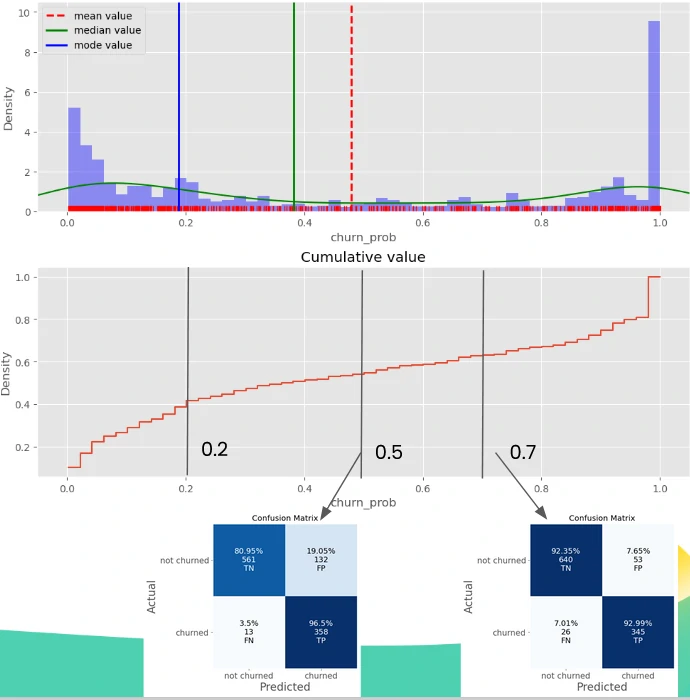
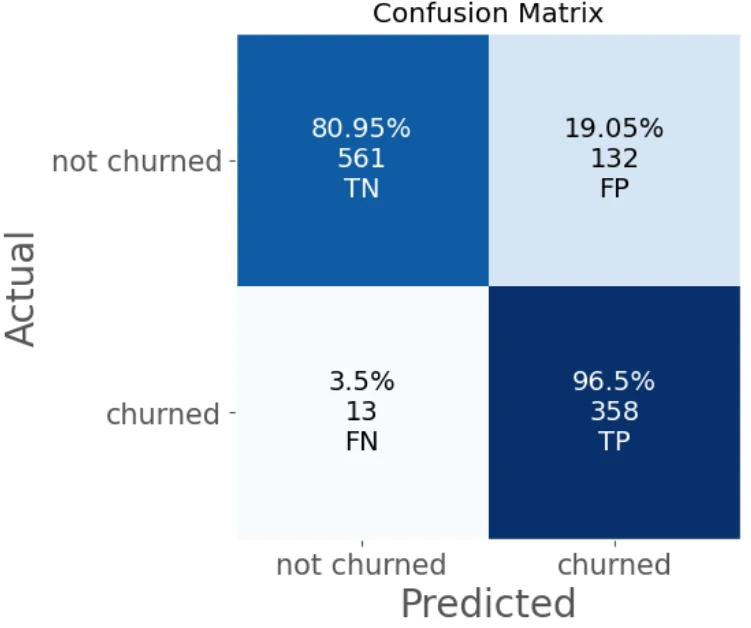
In this case, we compare the model with a business rule. The rule defines churn as no transactions for at least three months. The model uses a probability threshold of 0.5 to classify churn. Overall, the alignment is very high. About 96.5% of the results are consistent between the model and the rule.
-
However, some differences are worth noting. Around 19.05% of customers are flagged as churned by the model earlier than the rule. This suggests the model can detect early signs of disengagement. It captures behavioral decline before the 3-month cutoff is reached.
-
On the other hand, about 3.5% of customers are still considered active by the model, even though they meet the churn definition. This indicates that some customers may still show potential to return, despite being inactive for a while.
-
These differences highlight the need for segmented strategies. Customers in the early churn (FP) group may need proactive engagement. Meanwhile, those in the delayed churn (FN) group may still hold recovery potential.
-
Overall, the model adds nuance to the churn definition. It helps move from a rigid rule to a more dynamic, behavior-based understanding.
-
The model uses a simple rule. Customers with probability above 0.5 are labeled as churned. This creates a binary segment. However, it also leads to a relatively high false positive rate.
-
Instead of relying only on a single cutoff, the probability distribution can be used more effectively. Customers can be grouped into multiple risk segments. This makes the output more actionable for the business. For example, customers with probability between 0.5 and 0.7 are in a moderate-risk group. They may need lighter interventions. Customers with probability between 0.2 and 0.5 are lower risk. They may only passive engagement. This allows better control of promotion costs.
-
For binary segment, the model shows that an optimal threshold is around 0.7. At this point, it achieves an accuracy of about 0.92. This threshold can serve as a strong reference. It helps define more precise and cost-efficient churn segments.
-
The churn model can do more than just flag risky customers. It can also help estimate how much we should spend to retain them. This turns churn prediction into a direct business decision tool.
For example, consider a customer with a 50% churn probability and an annual value of 100,000,000. The expected value for the next year is 50,000,000. This reflects the uncertainty of whether the customer will stay or leave. If an intervention can reduce the churn probability to 45%, the expected value increases. It becomes 55,000,000. That means there is a gain of 5,000,000.
This value can be used as a benchmark. Any retention effort should cost less than or equal to this gain. In this case, 5,000,000 becomes the maximum reasonable benefit cost. It ensures that retention strategies remain economically efficient.