CLTV Analysis (Part 3)
Churn Analysis
CLTV
propensity
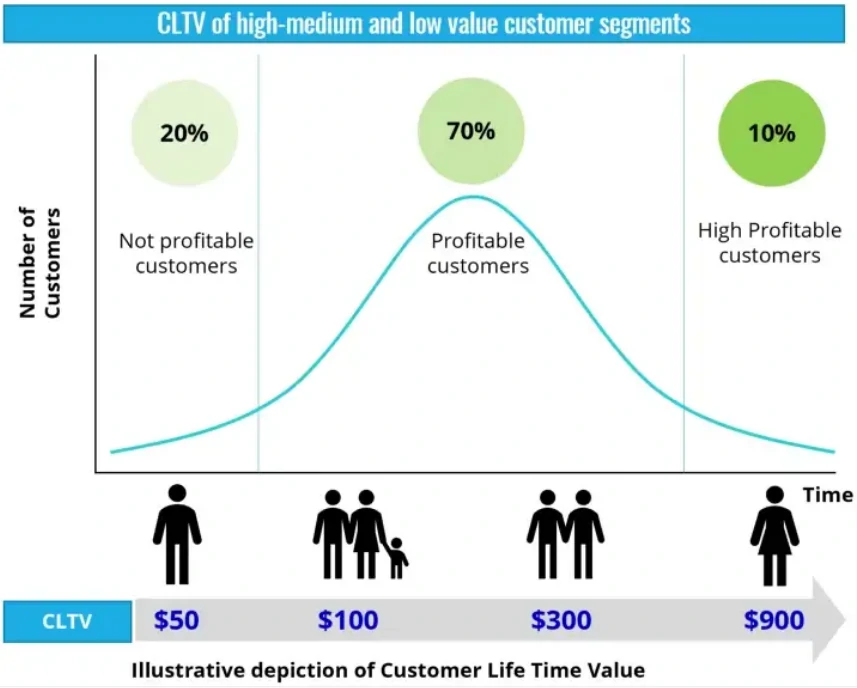
Customer lifetime value (CLTV) prediction
What its mean?
Customer lifetime value (CLTV) It is the monetary value that a customer will bring to this company during the relationship/communication/interaction with a company. Customer lifetime value prediction is a probabilistic estimate of lifetime value with time as input.
ELI5 process?
CLTV models all jointly model two processes:
- Conditional Expected Number of Transaction, The customer’s predicted number of transactions within the period of time.
- Conditional Expected Average Profit, The predicted value of each purchase within the period of time.
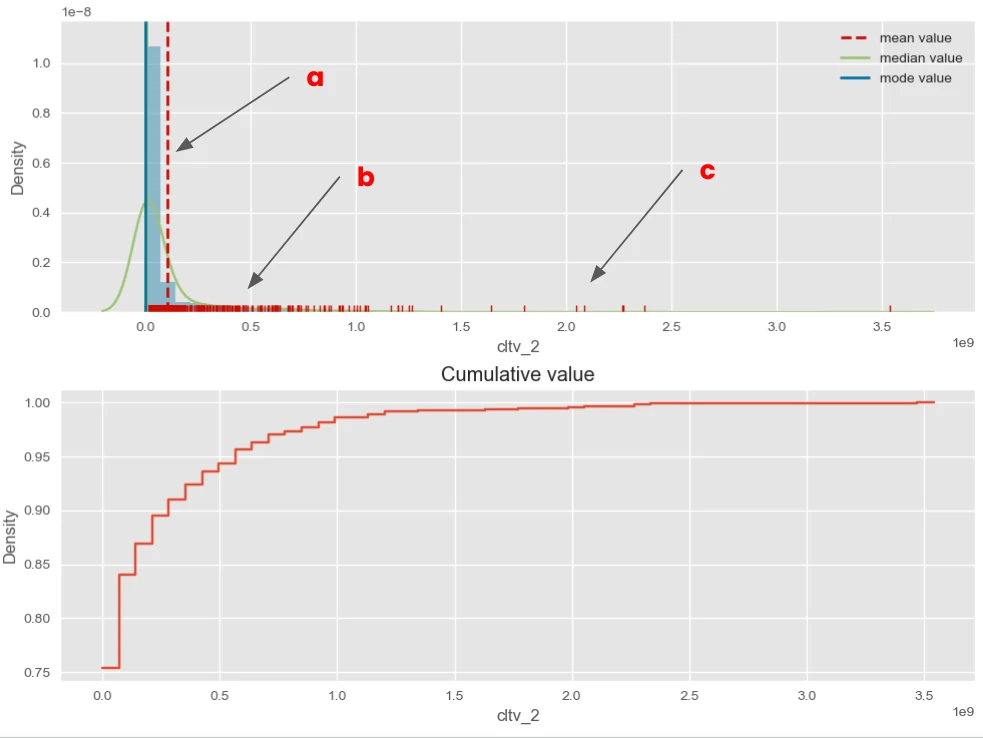
What the insights from the CLTV model?
The CLTV prediction reveals three key segments. Each reflects a different level of customer value and risk.
-
Point
acontains the majority of customers. Around 90% fall below a CLTV of 250 million. This group includes many low-value customers. It also includes those with a higher risk of churning. -
Point
brepresents a smaller but important segment. About 5% of customers have a CLTV above 500 million. These customers contribute significant value. They may require more focused retention strategies. -
Point
chighlights the top-tier customers. Their CLTV exceeds 1.5 billion. This is a very small group but highly valuable. Losing even one customer in this segment can have a large impact.
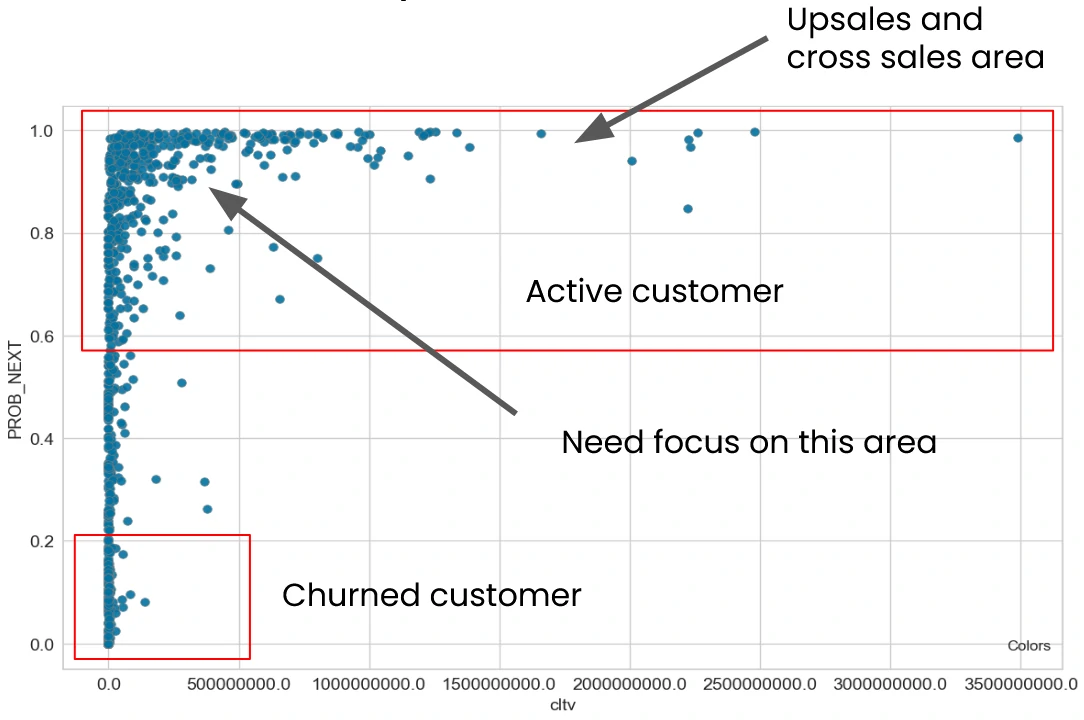
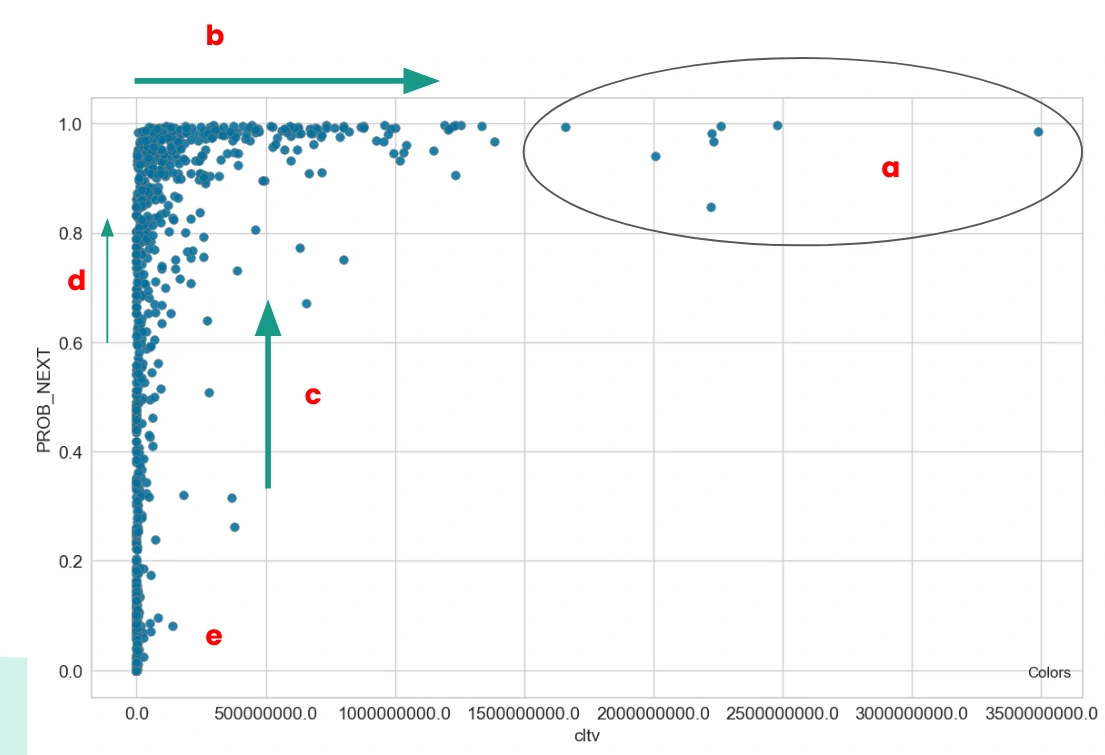
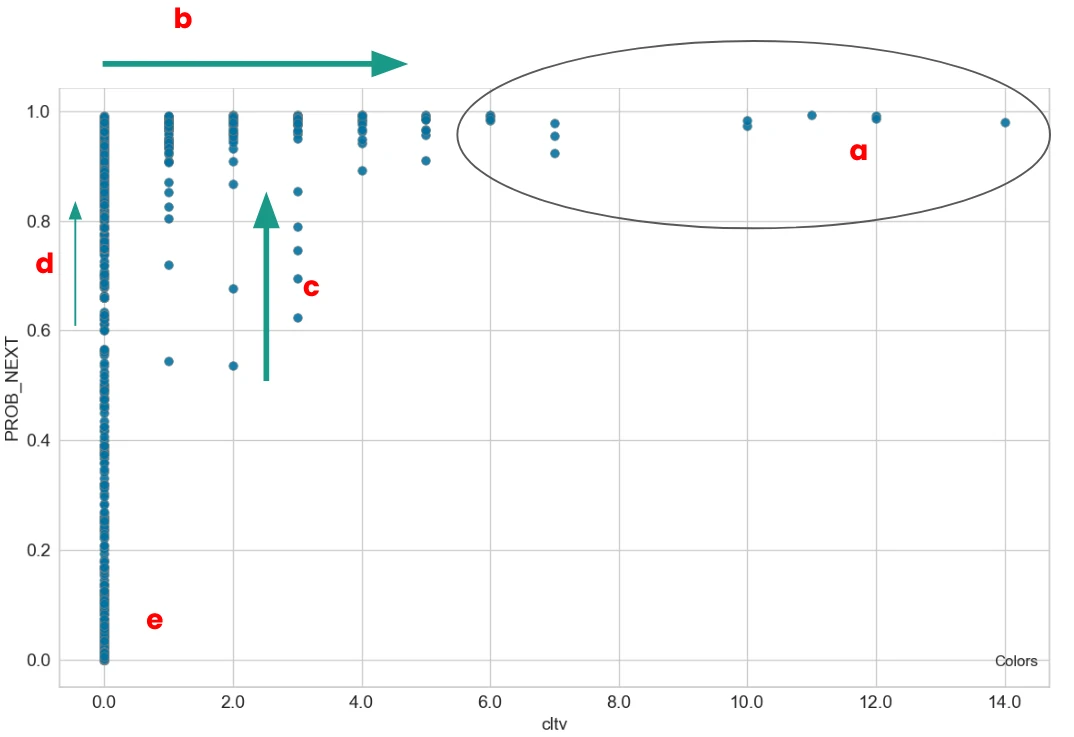
CLTV vs probability next transaction
The graph shows the relationship between predicted CLTV and transaction probability. A clear pattern emerges. Many customers have a high probability of transacting, but their CLTV remains relatively low.
-
Point
arepresents the core customer base. These customers are highly active and contribute a large share of revenue. Even if their individual CLTV is not very high, their volume makes them critical. They need to be retained and kept engaged consistently. -
Point
bshows customers with strong transaction probability but lower long-term value. This suggests untapped potential. They are already engaged, but not spending enough or not scaling over time.
The focus here should be on value expansion. Increase transaction size, frequency, or product adoption. At the same time, maintain their current engagement level to avoid drop-off.
-
Point
crepresents high-value customers with declining engagement. Their CLTV is high, but transaction probability is dropping from 0.8 to 0.3. This suggests they were once very active but have started to disengage. The priority here is reactivation. We need to understand what caused the decline and bring them back with targeted incentives or personalized outreach. -
Point
dincludes customers with moderate transaction probability but low CLTV. These customers are still somewhat active, but their value is limited. The focus should be on increasing their engagement first. More frequent transactions can help prevent them from slipping into churn. -
Point
econsists of customers already in the churned segment. Their behavior needs deeper evaluation. A one-size-fits-all approach may not work. Further analysis is required to decide whether to win them back or let them go.
Conclutions
- How many customers are active? -> Active customer
- Which customers have churned? -> Churned customer
- How valuable will any customer be to the company in the future? -> look at their CLTV prediction
- Which or how many customers should we focus on for which monetary value are calculated? -> at high prob_next_trx with low to medium CLTV
- We want to create the formulation of customer acquisition and retention strategies, can you help us? -> Framework
- We want to know which or how many customers that can be upsales or cross sale among our products? -> at high prob_next_trx with medium to high CLTV
- We want to give a reward to our best customer, with an increasing limit, Which or how many customers are there?-> at high prob_next_trx with medium to high CLTV