EDA Churn Analysis (Part 1)
Churn Analysis
CLTV
propensity
Introduction
Building a solid acquisition and retention strategy isn’t just about collecting more data, it’s about structuring the right data in a way that reflects how customers actually behave. On the acquisition side, comprehensive KYC data provides the foundation for understanding who the customers are: their demographics, preferences, and onboarding patterns. Meanwhile, retention depends heavily on transaction data; how often customers engage, how much they spend, and how their activity evolves over time. Treating these two domains as separate analytical tracks is critical. When acquisition and retention signals are blended too early, it often leads to diluted insights and unfocused strategies. By isolating them, teams can run sharper hypothesis testing, clearer segmentation, and more targeted experimentation.
To operationalize this, a structured framework becomes essential, not just as documentation, but as a thinking tool. It defines the flow from raw data to insight generation, ensuring that each stage (data preparation, feature engineering, exploratory analysis, and interpretation) is aligned with a specific business objective. Within this deck, the focus narrows into one of the most impactful retention levers: churn analysis. Rather than treating churn as a single metric, we break it down into a set of analytical questions, what constitutes churn in a transactional context, what behavioral patterns precede it, and how to quantify its financial impact. By approaching churn this way, the goal is not only to identify lost customers, but to uncover early warning signals and design interventions that can proactively reduce attrition.
What kind of issue do we want to solve?
- How many customers are active?
- Which customers have churned?
- How valuable will any customer be to the company in the future?
- Which or how many customers should we focus on for which monetary value are calculated?
- We want to create the formulation of customer acquisition and retention strategies, can you help us?
- We want to know which or how many customers that can be upsale or cross sale among our products?
- We want to give a reward to our best customer, with an increasing limit, Which or how many customers are there?
The definition
What is Churn?
A customer is considered churn-ing if they are actively returning to the store. Whereas a churn-ed customer is one that is no longer coming back for more.
Why customer becoming churned?
- Event based: Some customers choose not to use our products or services because of something unusual or beyond our control.
- Late Payment
- Internal Fraud
-
Behavioral based: Some customers choose not to use our products or services because of our values, competitors, something changing, an external factor, etc. but we can still exert some control over it.
- Try and run customer
- Unaligned values between customer and our products
Churned customer may well be an unhappy customer. Beyond the loss of their spending, you could be on the receiving end of negative word-of-mouth, bad reviews, and a detriment to your overall brand value.
Matrices
| Params | Description |
|---|---|
| churn-ing | A customer is considered churn-ing if they are actively returning to a transaction. |
| Churned | churned customer is one that is no longer coming back for more. (i.e. had no transactions in the last 3 months) |
| Customer Churn Risk | is the probability that a customer will disengage with the business. |
| Churn Risk | 1 - Probability of transaction over a determined period |
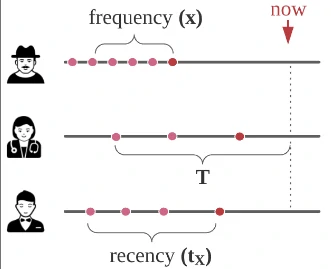
| Recency (Active age time) | The time between the first transaction and the last transaction. How long the customers are still active in their age time. |
| Frequency | The number of transaction beyond the initial one. This exclude first time transaction to avoiding new customer into our model. |
| T (age time) | The time between the first transaction and the end of the calibration period (i.e. now) |
| Lag time | The time between 2 transaction. |
| Sleep time | The time between the last transaction and the end of the calibration period (i.e. now) |
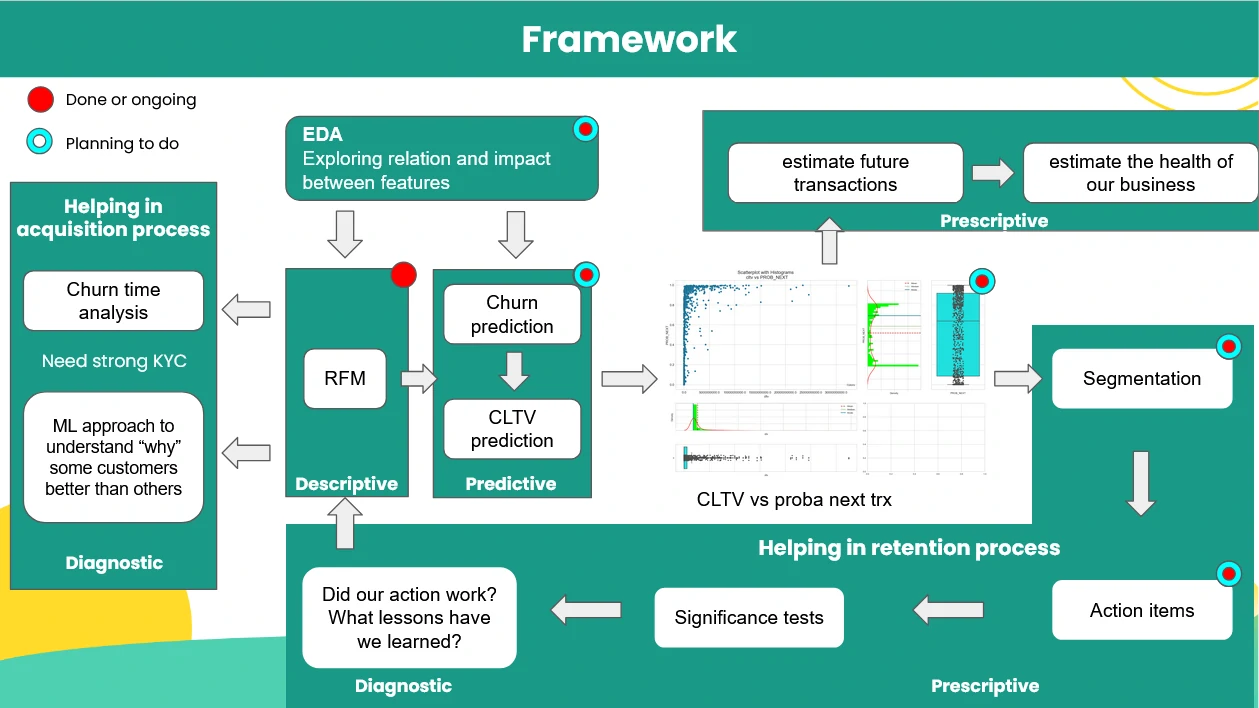
Framework
Data Criteria
The data used for this analysis comes from collection data with the following criteria:
- Transaction Data
- Support data
- Customers data
- Product data
EDA (Exploring relation and impact between features)
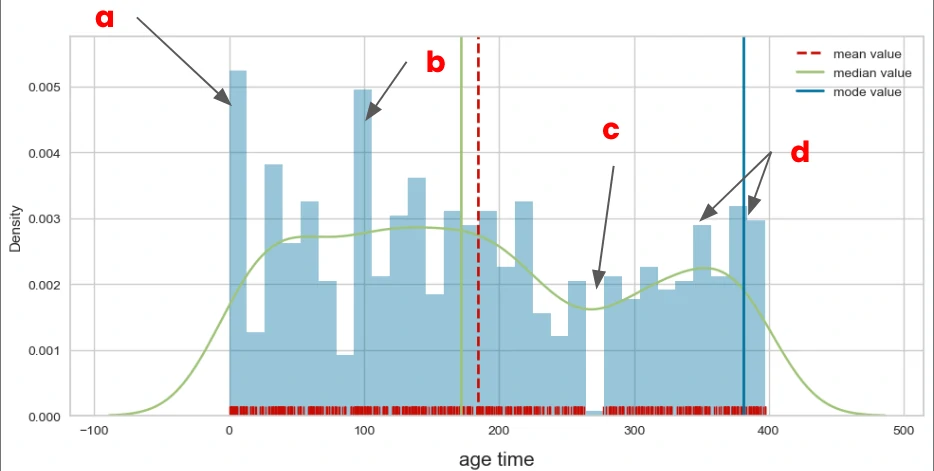
Age Time
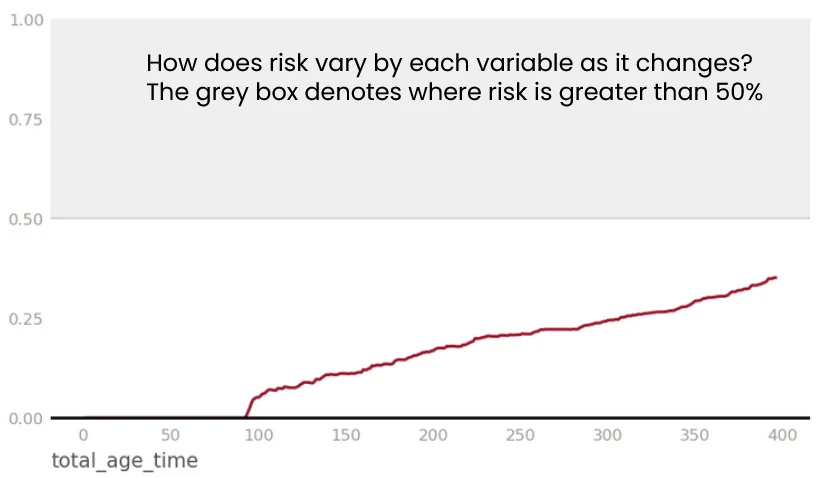
The age-time distribution of the customers shows a few clear patterns. There are strong peaks at points a and b. These indicate where customer activity is concentrated. In contrast, point c shows a noticeable gap. This suggests a drop in engagement or a break in the customer journey.
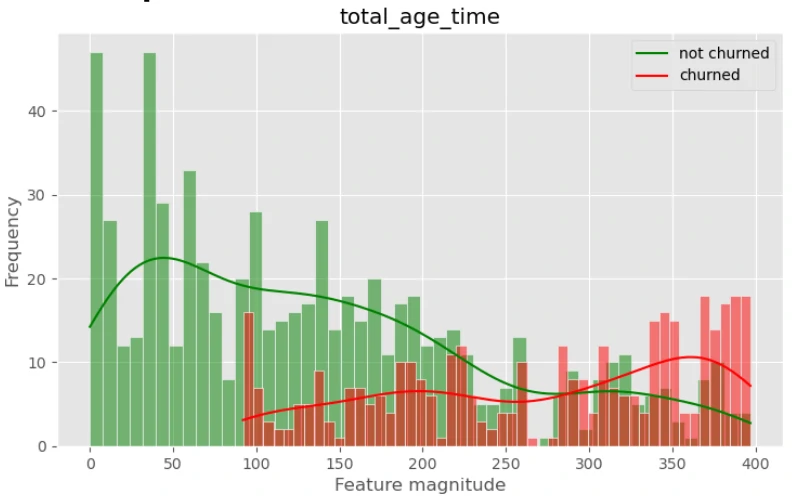
When we segment the data by churn label, a trend becomes visible. Customers with higher age-time tend to churn more. However, the risk level stays below 50%. This means the churn signal is gradual, not extreme. It reflects slow disengagement rather than sudden drop-off.
Lag time
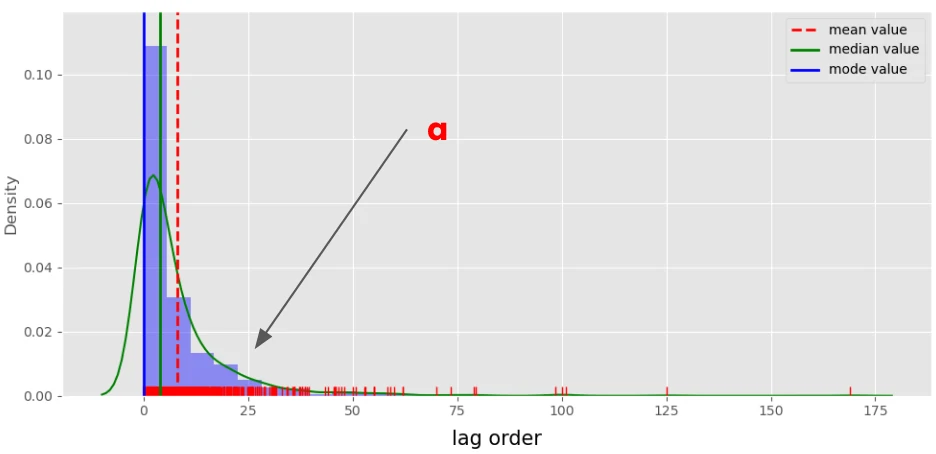
The lag time distribution of the customers shows a consistent transaction pattern. Most customers return within a short interval. On average, the lag time between transactions is under 25 days.
The highest concentration is in the 0–7 day range. This indicates frequent and regular engagement. Customers tend to come back quickly after their last transaction.
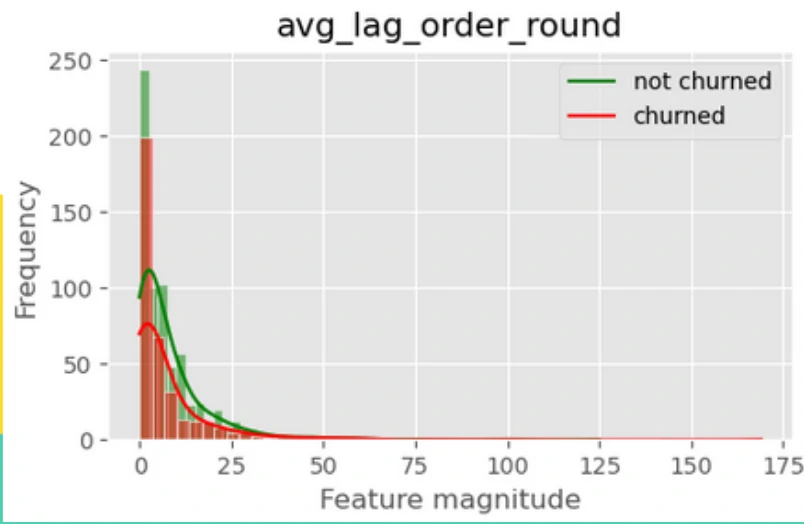
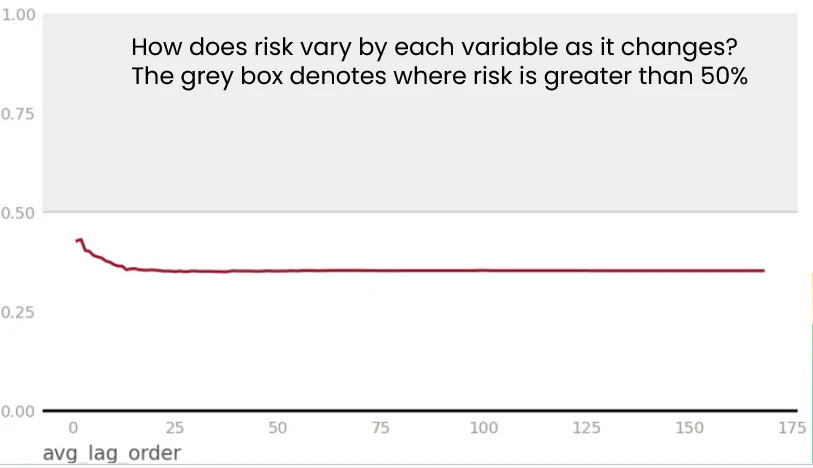
When we compare churned and non-churned customers, the pattern remains similar. There are no clear differences between the two groups. Lag time alone does not strongly explain churn behavior in this segment.
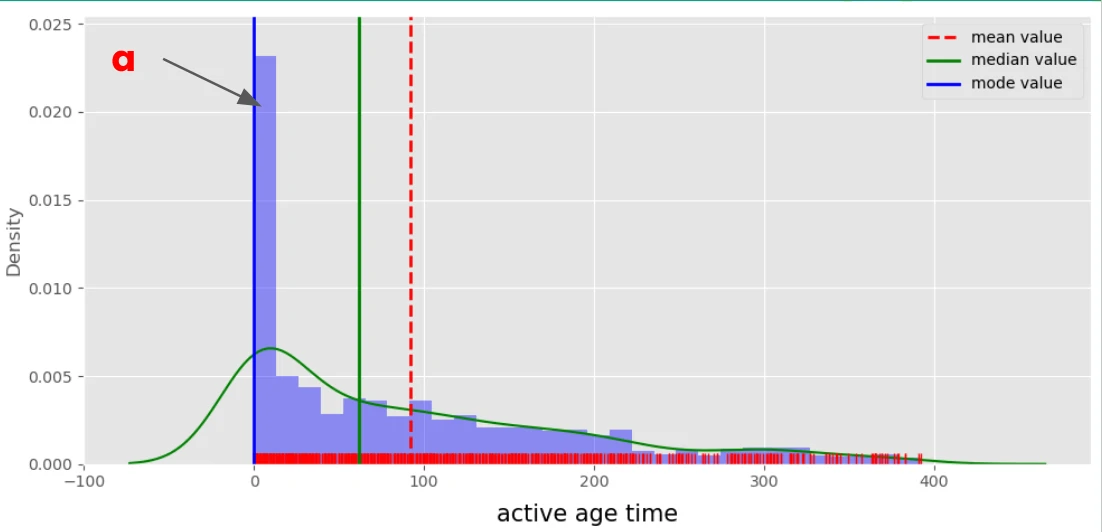
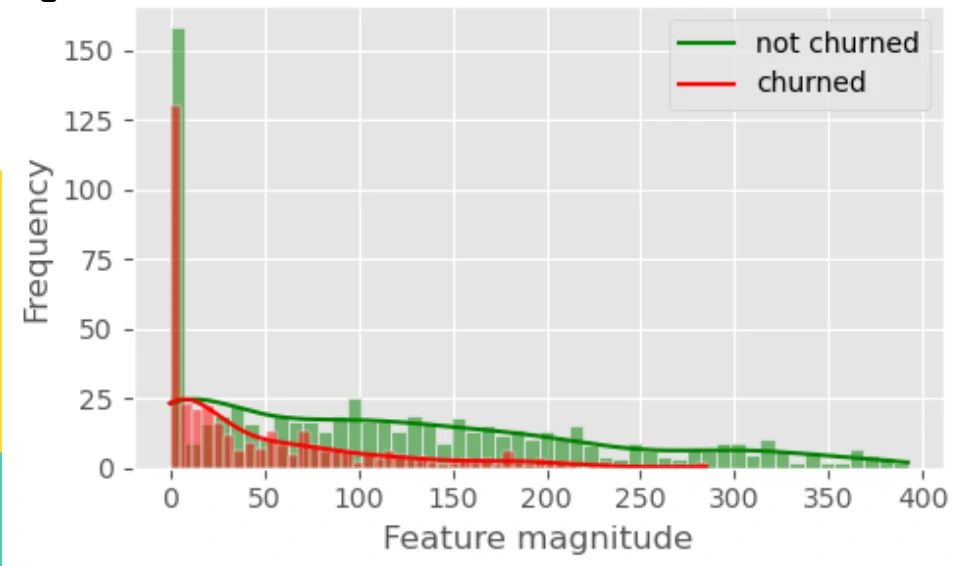
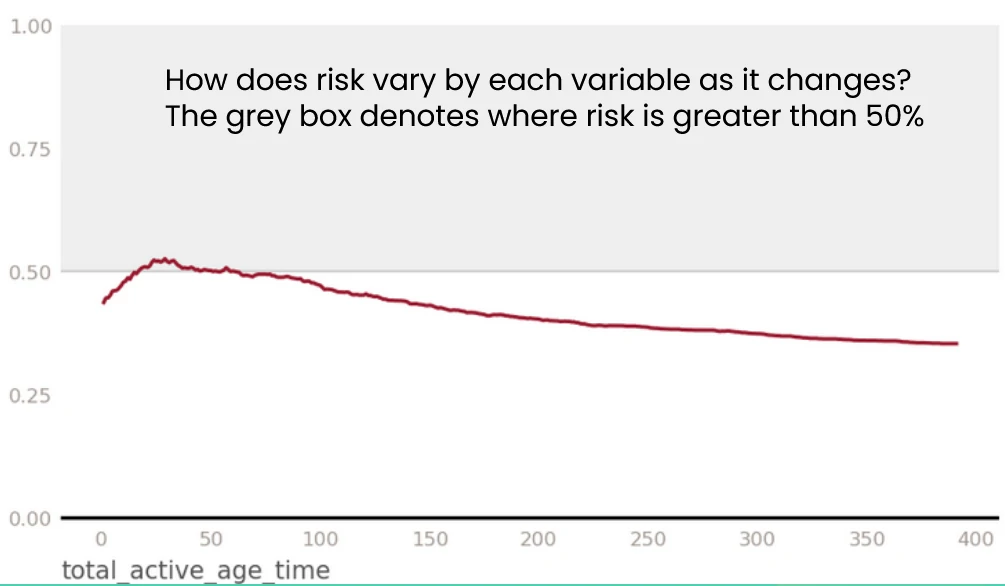
Active age time
The distribution of active age and time for the customers is skewed toward the early stage. Many customers have a short active age. This includes both newly acquired users and those who churn quickly after onboarding.
As active age increases, the number of customers declines. Fewer customers stay engaged over a longer period. This suggests a natural drop-off as time goes on.
When we split the data by churn label, the risk becomes clearer. Customers with low active age show a churn risk above 50%. This indicates a critical early-stage vulnerability. The first phase of the customer lifecycle is where retention efforts matter most.
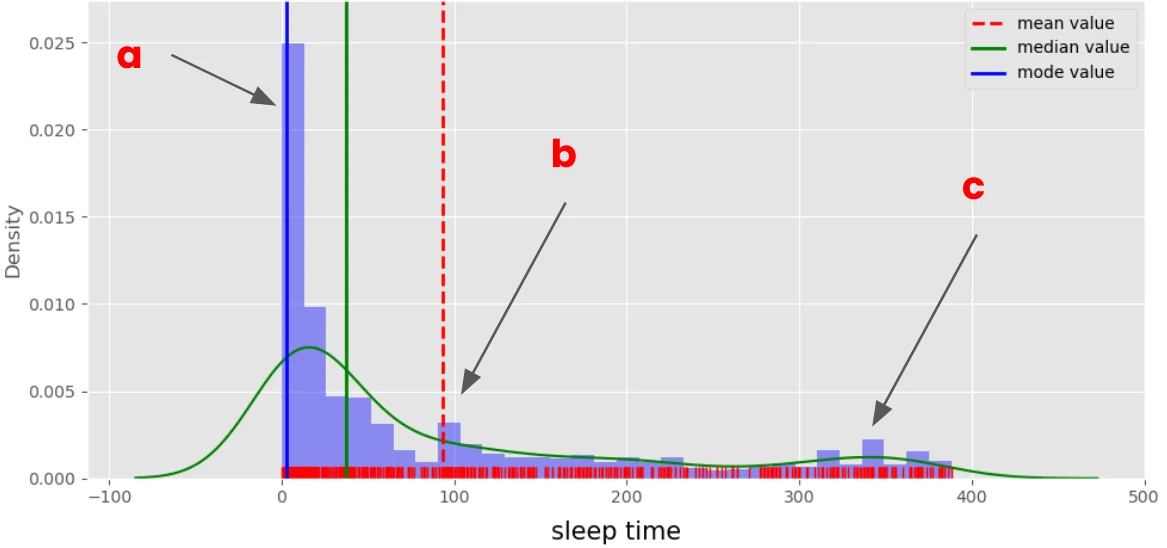
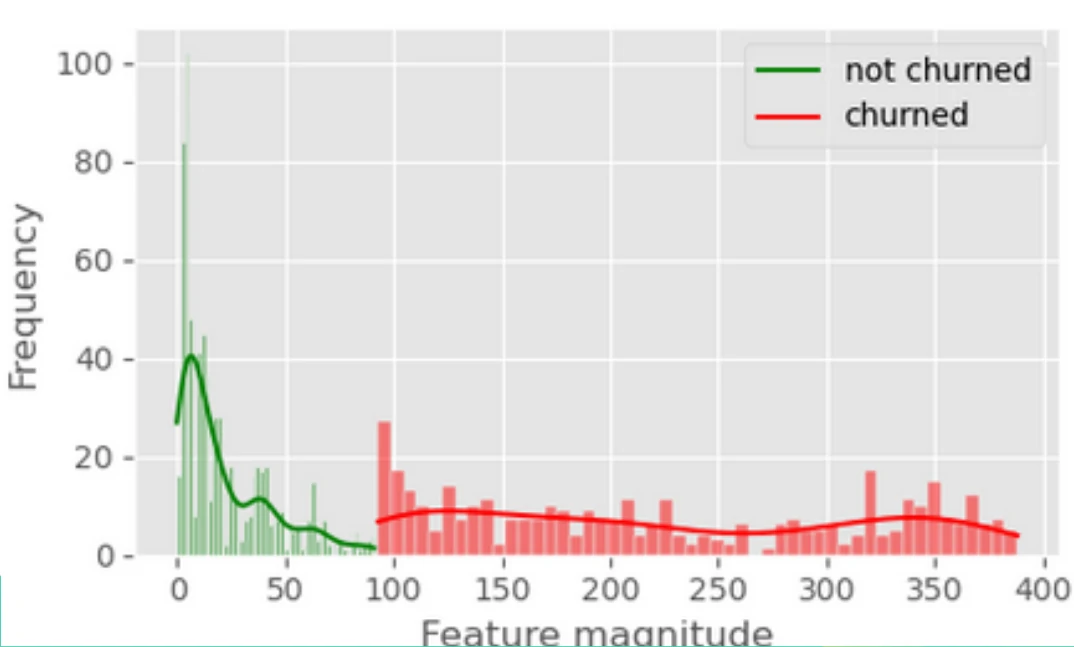
Sleep time
The sleep-time distribution of the customers highlights three key points. Each reflects a different stage of customer behavior.
- Point a represents active customers. They have very low sleep time. This means they are consistently engaged and transacting.
- Point b is the borderline between churned and non-churned customers. It shows a peak at sleep time above 90 days. This suggests many customers are at risk but not fully lost yet.
- Point c represents long-inactive customers. These users have been asleep since early 2022. They indicate a deeper level of disengagement.
These patterns raise important questions.
- How can we reactivate customers at point b before they churn?
- What triggers caused customers at point c to drop off so early?
Each group requires a different strategy. Point b needs timely reactivation efforts. Point c may require deeper analysis of onboarding and early experience.
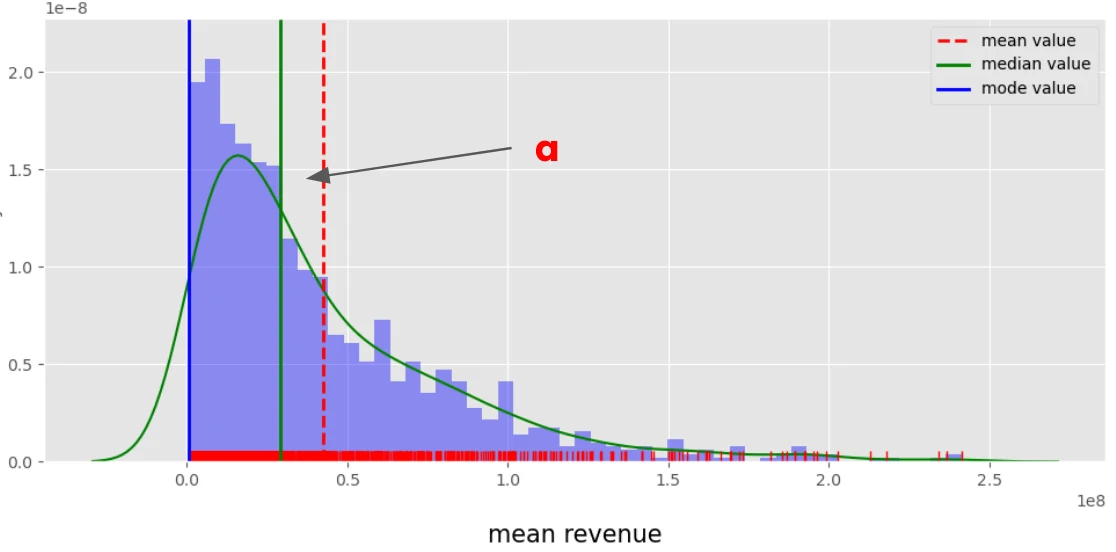
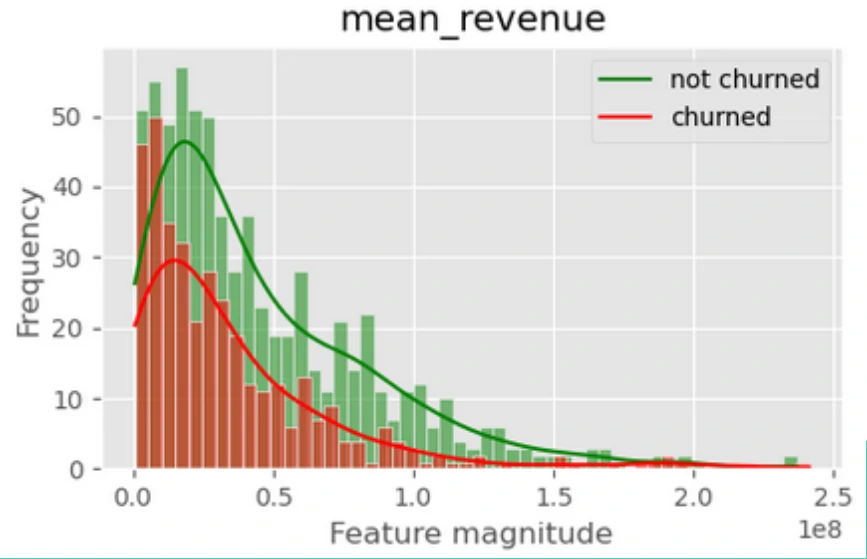
Monetary
The average revenue distribution of the customers is heavily concentrated at the lower end. Most customers generate less than 50,000,000 in value. As the revenue increases, the number of customers drops significantly.
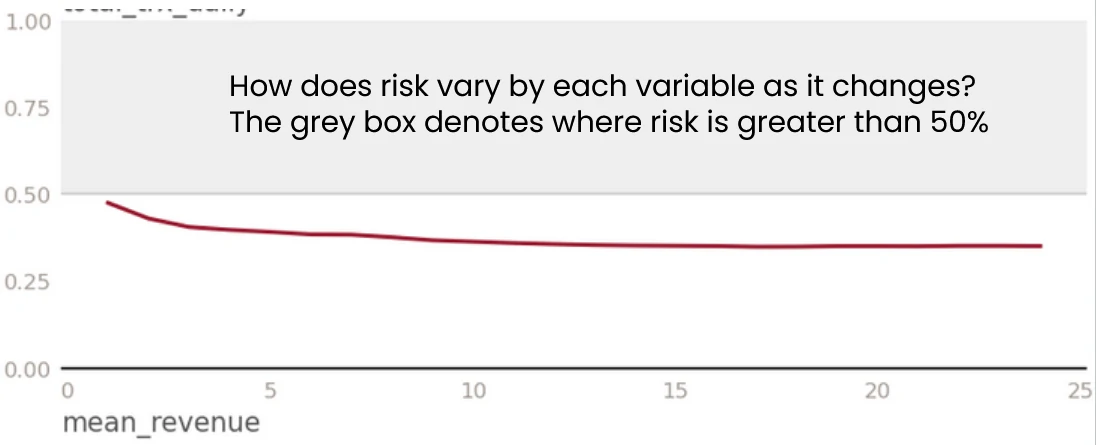
When we segment by churn label, a clear pattern appears. Customers with lower average revenue show a higher risk of churning. The risk approaches 50% in this segment.
As revenue increases, the churn risk stabilizes. It plateaus at around 35%. This suggests higher-value customers are relatively more stable. Low-value customers, on the other hand, are more vulnerable to churn.
Correlation
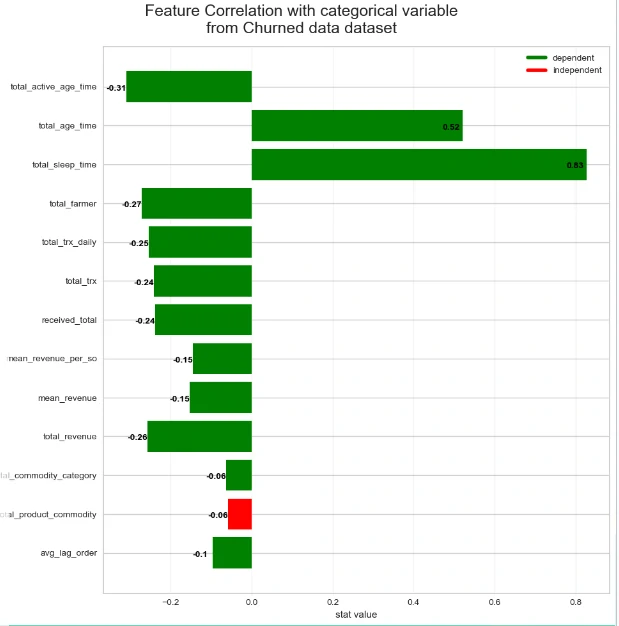
The correlation analysis of churned the customers reveals several useful signals. These customers are defined as having no transactions for more than three months. Some variables show moderate relationships, while others are weaker but still meaningful.
- There is a medium positive correlation with total age time. This suggests that customers who have been around longer are slightly more likely to churn.
- A similar pattern appears with total sleep time. This is expected, since churn is directly tied to long inactivity.
- Active age time shows a low negative correlation. Customers who stay active for longer periods are less likely to churn. This highlights the importance of sustained engagement.
- Other variables, such as total farmers and total revenue, also show negative correlations. While the relationship is not strong, it indicates that higher engagement and value tend to reduce churn risk.
Conclusions
- The age-time distribution shows a clear acquisition spike in early 2023.
- There was also a peak in customer inflow around 100 days ago.
- At the same time, older customers show a higher tendency to churn. This is consistent with the positive correlation between age-time and churn.
- From the lag-time perspective, customer behavior is relatively frequent. Most transactions happen within 1 to 25 days.
- The highest concentration is in the 0–7 day range. This indicates that active customers tend to return quickly.
- Looking at active age, the risk becomes more critical. Customers with low active age show a churn risk above 50%. This highlights a fragile early lifecycle phase. Many customers drop off before building long-term engagement.
- Sleep time adds another layer of concern. There are two key peaks.
- One is customers inactive for more than 90 days.
- The other is customers who have been inactive since early 2022. Both groups require different recovery strategies.
- From a revenue perspective, most customers fall below 50,000,000. Lower-value customers are more likely to churn, with risk approaching 50%. As revenue increases, the risk stabilizes around 35%.
- Overall, the pattern is consistent. Customers with higher age tend to churn more. Meanwhile, customers with longer active periods, higher farmer counts, and higher revenue are more stable and less likely to churn.