Create Aggregate Data
descriptive analytics
Introduction
When working with large datasets in Python, aggregating data is a crucial step for summarizing and extracting meaningful insights. Aggregation involves operations like summing, averaging, counting, or finding the minimum and maximum values across different groups of data.
This is especially useful in business analytics, finance, and data science, where understanding trends and patterns is essential. Python provides powerful tools like Pandas, which makes aggregation straightforward with functions like .groupby(), .agg(), and .pivot_table(). Whether you’re analyzing sales performance, customer behavior, or supply chain metrics, mastering data aggregation helps transform raw data into actionable insights efficiently.
Dataset
Load dataset
we use simple and common titanic dataset from seaborn library.
df = sns.load_dataset("titanic")
| survived | pclass | sex | age | sibsp | parch | fare | embarked | class | who | adult_male | deck | embark_town | alive | alone | |
|---|---|---|---|---|---|---|---|---|---|---|---|---|---|---|---|
| 0 | 0 | 3 | male | 22 | 1 | 0 | 7.25 | S | Third | man | True | nan | Southampton | no | False |
| 1 | 1 | 1 | female | 38 | 1 | 0 | 71.2833 | C | First | woman | False | C | Cherbourg | yes | False |
| 2 | 1 | 3 | female | 26 | 0 | 0 | 7.925 | S | Third | woman | False | nan | Southampton | yes | True |
| 3 | 1 | 1 | female | 35 | 1 | 0 | 53.1 | S | First | woman | False | C | Southampton | yes | False |
| 4 | 0 | 3 | male | 35 | 0 | 0 | 8.05 | S | Third | man | True | nan | Southampton | no | True |
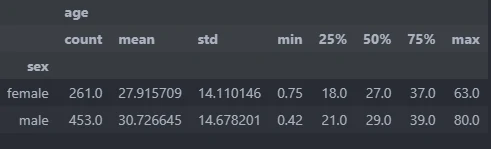
Group numerical description
By calling, describe.group_describe we can generate numerical description from selected columns compare to specific category.
describe.group_describe(main_data,col)
This function requires the following parameters:
- main_data (
dataframe): Data Input - col (
list): column name
The result
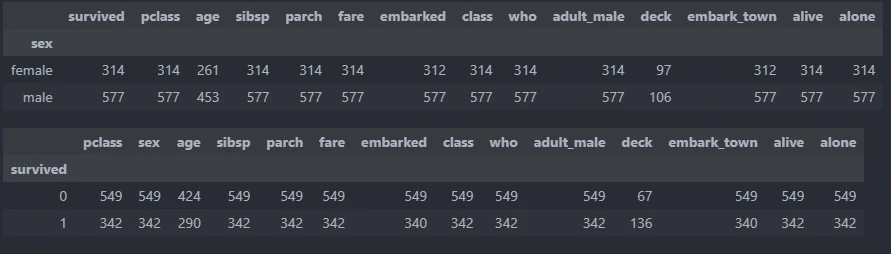
Group count description for specific columns
By calling, describe.group_describe_all we can generate count value for each colums compare to specific categories.
describe.group_describe_all(main_data,columns,n)
This function requires the following parameters:
- main_data (
dataframe): Data Input - columns (
list): column name - n (
int): threshold of category in each column
The result
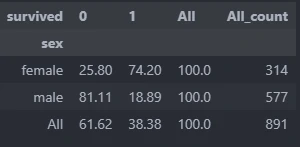
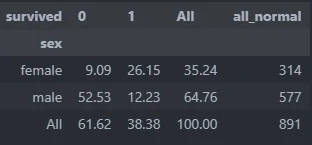
Cross aggregate
By calling, describe.crosstab we can generate aggregate value from multiple columns. This code will provide 3 calculate values, i.e.: count value, percentage from categories value, percentage from all value.
describe.crosstab(main_data,target_list=[],types='normal',margins=True,heatmap=False,footnote=None)
This function requires the following parameters:
- main_data (
dataframe): Data Input - target_list (
list): column name - types (
string): type of calculation["normal","percent","percent_all"] - margins (
boolean): give margin - heatmap (
boolean): generate heatmap - footnote (
string): footmap text
The result

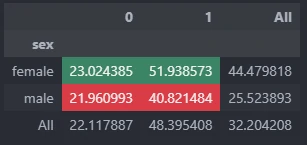
More Extensive Cross aggregate
By calling, describe.pivot we can generate more extensive aggregate value from multiple columns by define what aggregation that we want to do with the data. This code will provide 3 calculate values, i.e.: count value, percentage from categories value, percentage from all value.
describe.pivot(main_data,val,col_list=[],aggfunc=None,fv=None,types='normal',col_name=True,color=True,margin=True,footnote=None)
This function requires the following parameters:
- main_data (
dataframe): Data Input - col_list (
list): column name - types (
string): type of calculation["normal","percent","percent_all"] - val (
boolean): targeted column - aggfunc (
boolean): aggregate function"sum", "count", lambda x: len(x.unique()), len, np.sum - fv (
string): Value to replace missing values with - col_name (
boolean): give margin - color (
boolean): give color - margin (
string): special All columns and rows will be added with partial group aggregates across the categories on the rows and columns. - footnote (
string): footmap text
The result