Create Description From Dataframe
descriptive analytics
Dataset
Load dataset
we use simple and common sales dataset from internet and select 6 columns specific for this project.
sales = pd.read_csv(
  r"..\dataset\sales_data_with_stores.csv",
   usecols = ["store", "product_group", "product_code", "cost",
              "price", "last_week_sales"]
)
| store | product_group | product_code | cost | price | last_week_sales | |
|---|---|---|---|---|---|---|
| 0 | Violet | PG2 | 4187 | 420.76 | 569.91 | 13 |
| 1 | Rose | PG2 | 4195 | 545.64 | 712.41 | 16 |
| 2 | Violet | PG2 | 4204 | 640.42 | 854.91 | 22 |
| 3 | Daisy | PG2 | 4219 | 869.69 | 1034.55 | 14 |
| 4 | Daisy | PG2 | 4718 | 12.54 | 26.59 | 50 |
The Code
By using, import ursar_sidepandas we can remodel pandas dataframe into more easier to create description analysis. Each dataframe will be add a module that can be used by .stb function after dataframe variable.
import ursar_sidepandas

df.stb.
First Example
How to answer this questions from our dataset above?
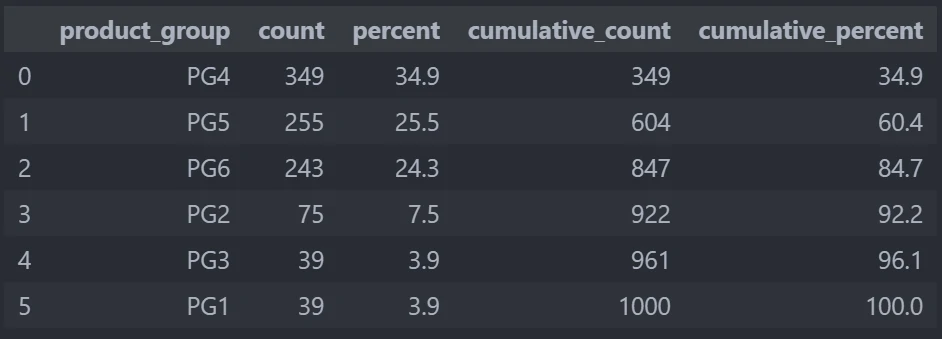
- How many product groups exist?
- What is the size of each product group in terms of the number of products they contain?
- What is the cumulative coverage of the entire portfolio?
by calling sales.stb.freq and define which column that we want to calculate, we can count how much categories in that columns, how much in total, its percentage, its cumulative and cumulative percent.
sales.stb.freq(["product_group"])
The result
Second Example
How to answer this questions from our dataset above?
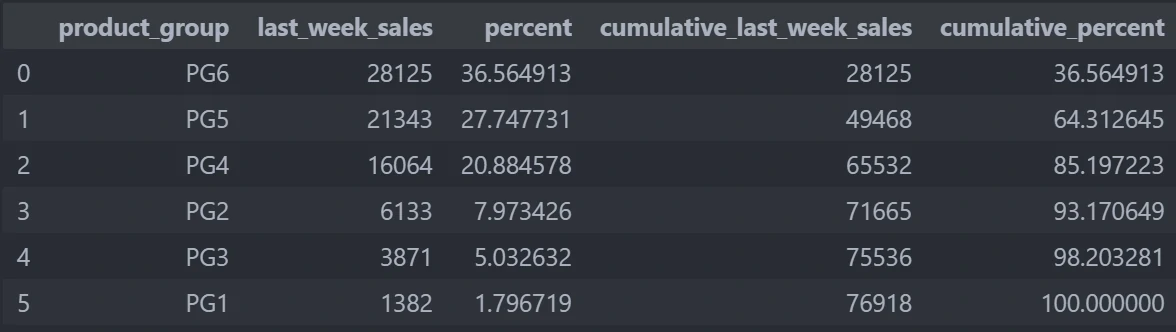
- to see the distribution with regards to sales
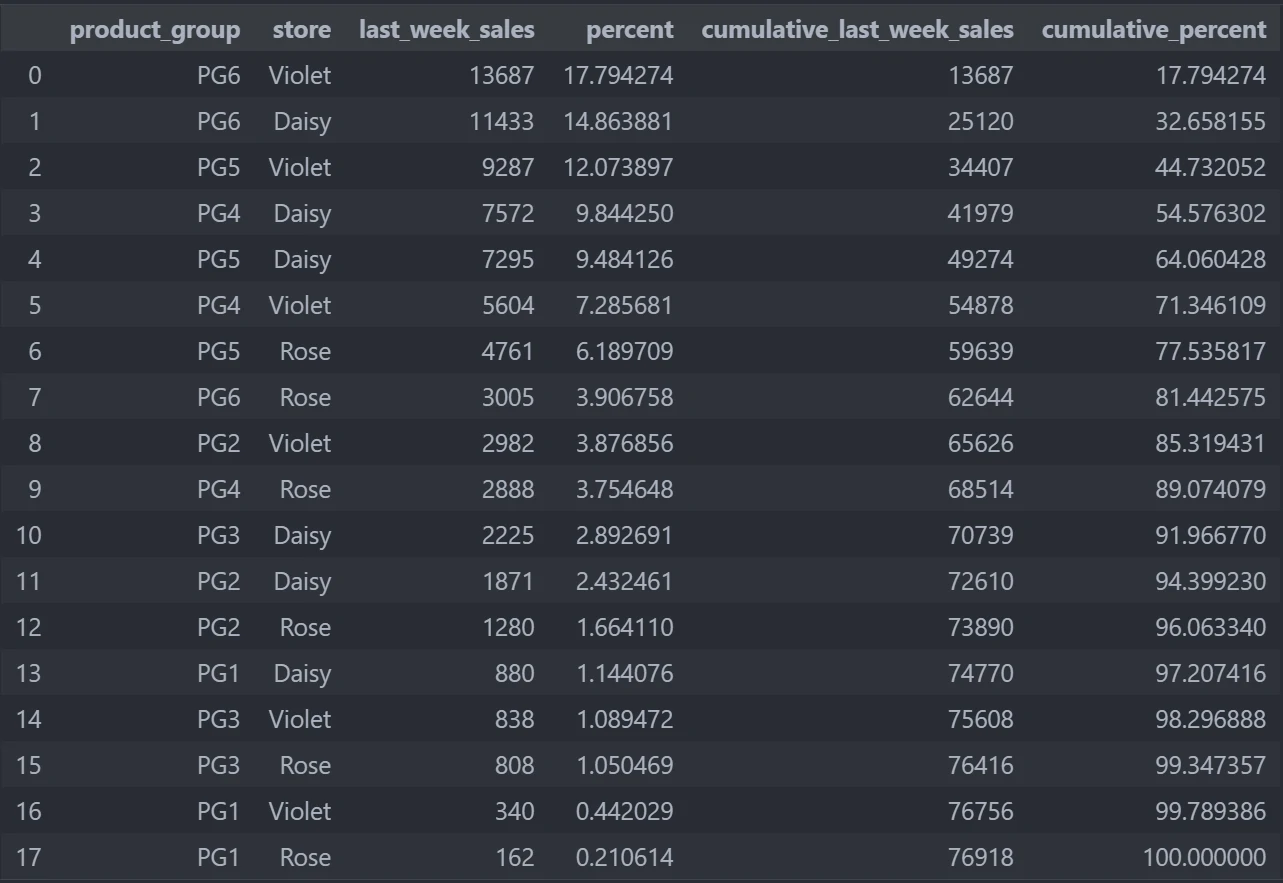
by calling sales.stb.freq and define which column and which value that we want to calculate, we can create more deep analysis about categorical and numerical data
sales.stb.freq(["product_group"], value="last_week_sales")

sales.stb.freq(["product_group", "store"], value="last_week_sales")
The result
Third Example
How to answer this questions from our dataset above?
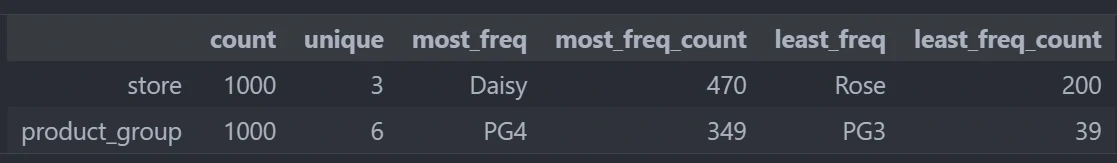
- How many observations (i.e. rows)?
- How many unique values?
- The most frequent value?
- How many observations for the most frequent value?
- The least frequent value?
- How many observations for the least frequent value?
by calling sales.stb.counts we can calculate basic analysis with our dataset and we can specifically choose which data type we want to analysis.
sales.stb.counts(exclude="number")
The result
Fourth Example
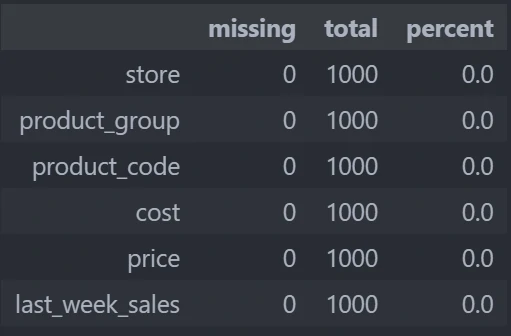
Show missing value, its total and its percentage
sales.stb.missing()
The result
Fifth Example
Show missing value, its total and its percentage
sales[sales['product_group'].isin(['PG2','PG1'])]
The result