Create Comprehensive Describe Data
descriptive analytics
Introduction
Descriptive analytics is the first step for every advanced analytics. This process will help us to understand and answer the 5W + 1H question before we expand our analytics.
By using this code, we can generate comprehensive description analytics that will provide us with:
- All columns named
- Data type for each column
- Total row of non-null data
- Total missing value in row
- Percentage of missing value
- Low value
- Quadrant 1 value
- Mean value
- Median value
- Quadrant 3 value
- High value
- Mode value
- Standard deviation
- Skewness data and its explanation
- Total unique value
Dataset
Load dataset
we use simple and common titanic dataset from seaborn library.
df = sns.load_dataset("titanic")
| survived | pclass | sex | age | sibsp | parch | fare | embarked | class | who | adult_male | deck | embark_town | alive | alone | |
|---|---|---|---|---|---|---|---|---|---|---|---|---|---|---|---|
| 0 | 0 | 3 | male | 22 | 1 | 0 | 7.25 | S | Third | man | True | nan | Southampton | no | False |
| 1 | 1 | 1 | female | 38 | 1 | 0 | 71.2833 | C | First | woman | False | C | Cherbourg | yes | False |
| 2 | 1 | 3 | female | 26 | 0 | 0 | 7.925 | S | Third | woman | False | nan | Southampton | yes | True |
| 3 | 1 | 1 | female | 35 | 1 | 0 | 53.1 | S | First | woman | False | C | Southampton | yes | False |
| 4 | 0 | 3 | male | 35 | 0 | 0 | 8.05 | S | Third | man | True | nan | Southampton | no | True |
The Code
By calling, describe.describe_data we can generate default description analytics of this dataset. This function can return either a table or an image table from description analytics.
df_styled,mis_val_table = describe.describe_data(df,image=True)
This function requires the following parameters:
- main_data (
dataframe): Data Input - image (
Boolean): generate table plot
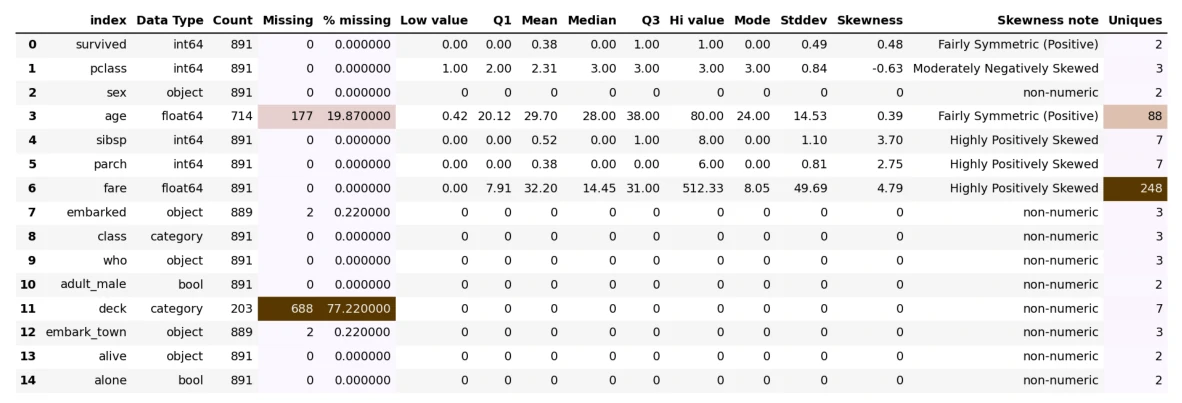
The result
table size 891 x 15
Dataframe has 15 columns.
There are 4 columns that have missing values.
| index | Data Type | Count | Missing | % missing | Low value | Q1 | Mean | Median | Q3 | Hi value | Mode | Stddev | Skewness | Skewness note | Uniques | |
|---|---|---|---|---|---|---|---|---|---|---|---|---|---|---|---|---|
| 0 | survived | int64 | 891 | 0 | 0 | 0 | 0 | 0.38 | 0 | 1 | 1 | 0 | 0.49 | 0.48 | Fairly Symmetric (Positive) | 2 |
| 1 | pclass | int64 | 891 | 0 | 0 | 1 | 2 | 2.31 | 3 | 3 | 3 | 3 | 0.84 | -0.63 | Moderately Negatively Skewed | 3 |
| 2 | sex | object | 891 | 0 | 0 | 0 | 0 | 0 | 0 | 0 | 0 | 0 | 0 | 0 | non-numeric | 2 |
| 3 | age | float64 | 714 | 177 | 19.87 | 0.42 | 20.12 | 29.7 | 28 | 38 | 80 | 24 | 14.53 | 0.39 | Fairly Symmetric (Positive) | 88 |
| 4 | sibsp | int64 | 891 | 0 | 0 | 0 | 0 | 0.52 | 0 | 1 | 8 | 0 | 1.1 | 3.7 | Highly Positively Skewed | 7 |