Create Deep Analysis for Missing value From Dataset
descriptive analytics
Introduction
This project aims to easy-to-use missing data visualizations and utilities that allows you to get a quick visual summary of the completeness (or lack thereof) of our dataset.
Dataset
Load dataset
we use simple and common titanic dataset from seaborn library.
df = sns.load_dataset("titanic")
| survived | pclass | sex | age | sibsp | parch | fare | embarked | class | who | adult_male | deck | embark_town | alive | alone | |
|---|---|---|---|---|---|---|---|---|---|---|---|---|---|---|---|
| 0 | 0 | 3 | male | 22 | 1 | 0 | 7.25 | S | Third | man | True | nan | Southampton | no | False |
| 1 | 1 | 1 | female | 38 | 1 | 0 | 71.2833 | C | First | woman | False | C | Cherbourg | yes | False |
| 2 | 1 | 3 | female | 26 | 0 | 0 | 7.925 | S | Third | woman | False | nan | Southampton | yes | True |
| 3 | 1 | 1 | female | 35 | 1 | 0 | 53.1 | S | First | woman | False | C | Southampton | yes | False |
| 4 | 0 | 3 | male | 35 | 0 | 0 | 8.05 | S | Third | man | True | nan | Southampton | no | True |
First Example
Show an heatmap for missing value
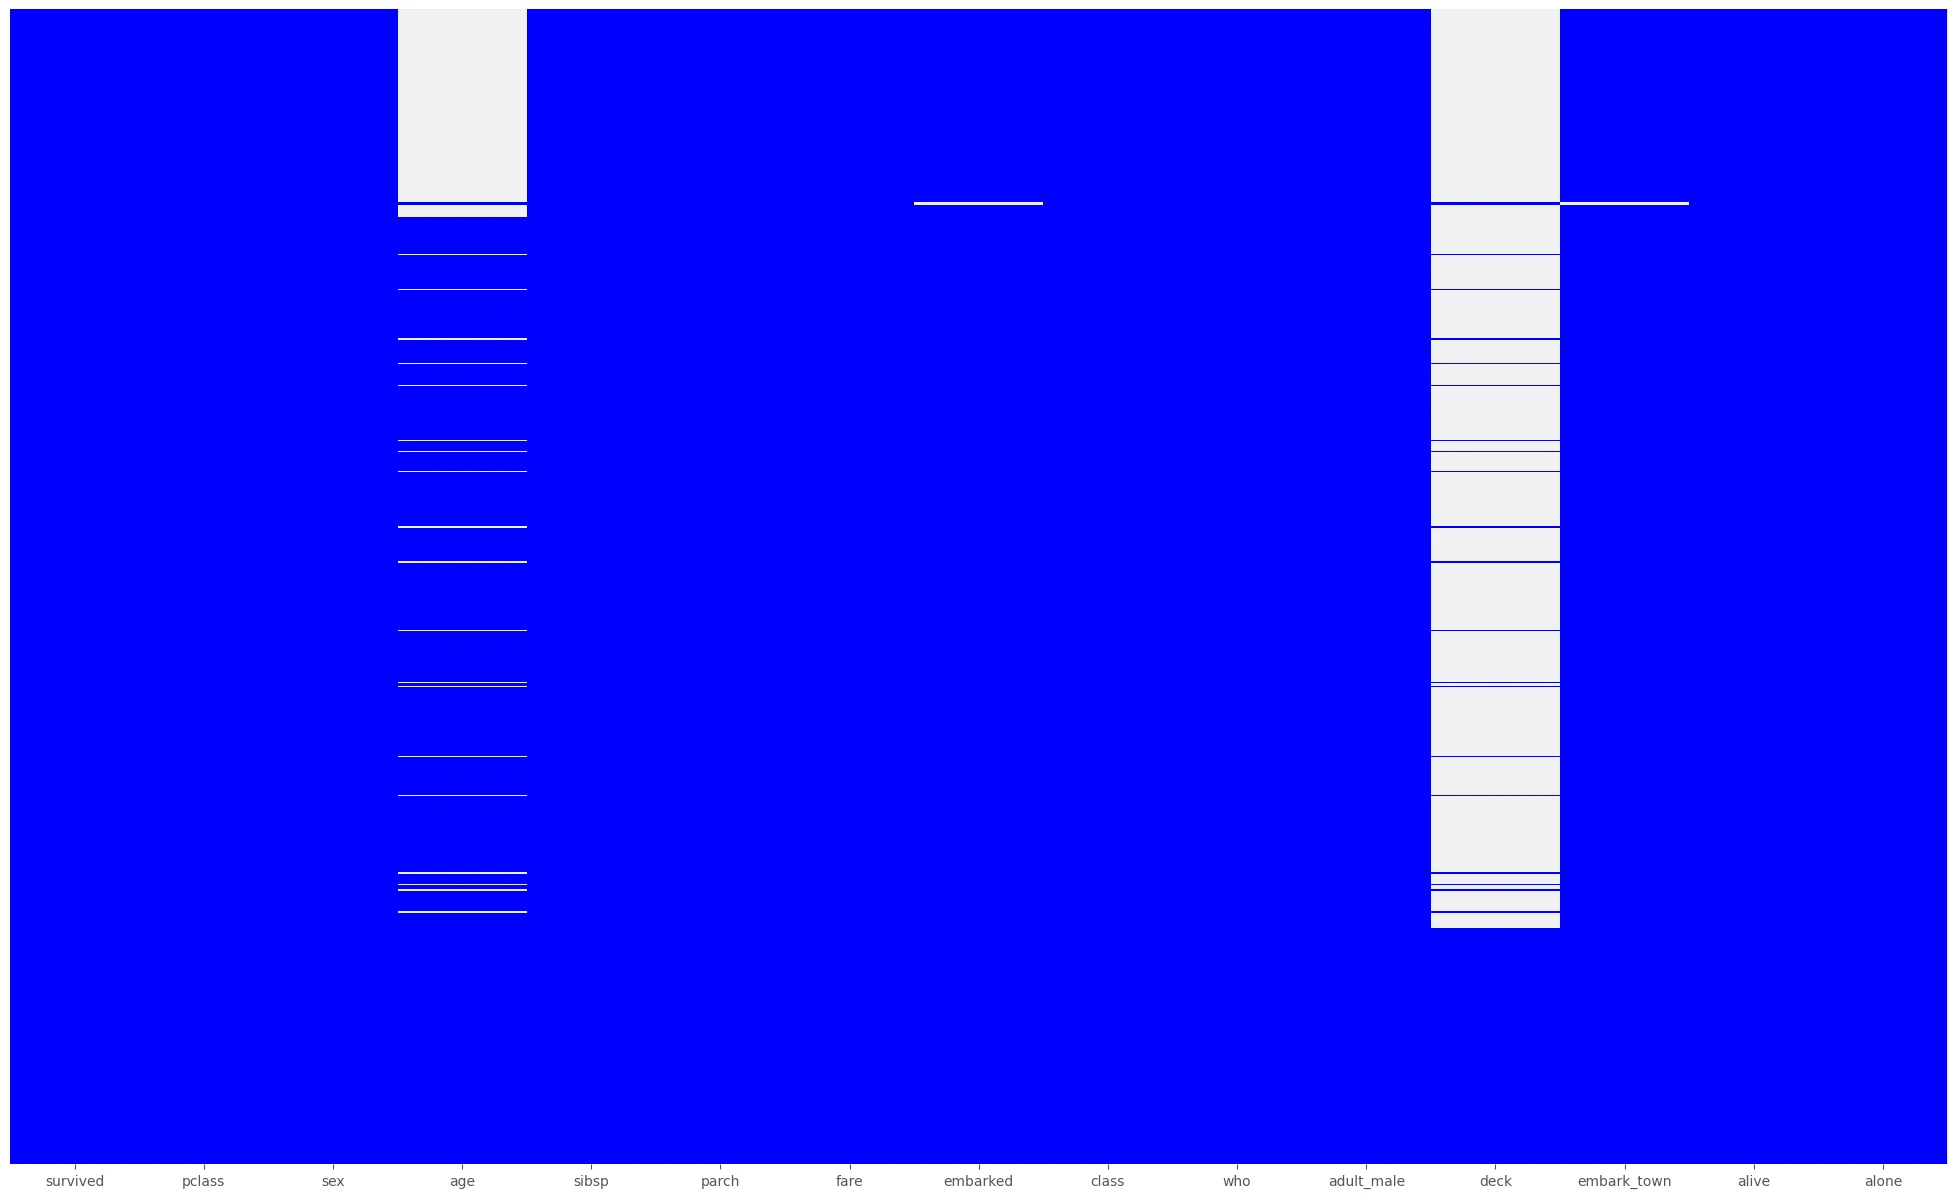
by calling describe.heatmap_mv we can generate heatmap image that will visualize missing value in our dataset.
describe.heatmap_mv(main_data)
This function requires the following parameters:
- main_data (
dataframe): Data input
The result
Second Example
Show an heatmap and bar plot for missing value
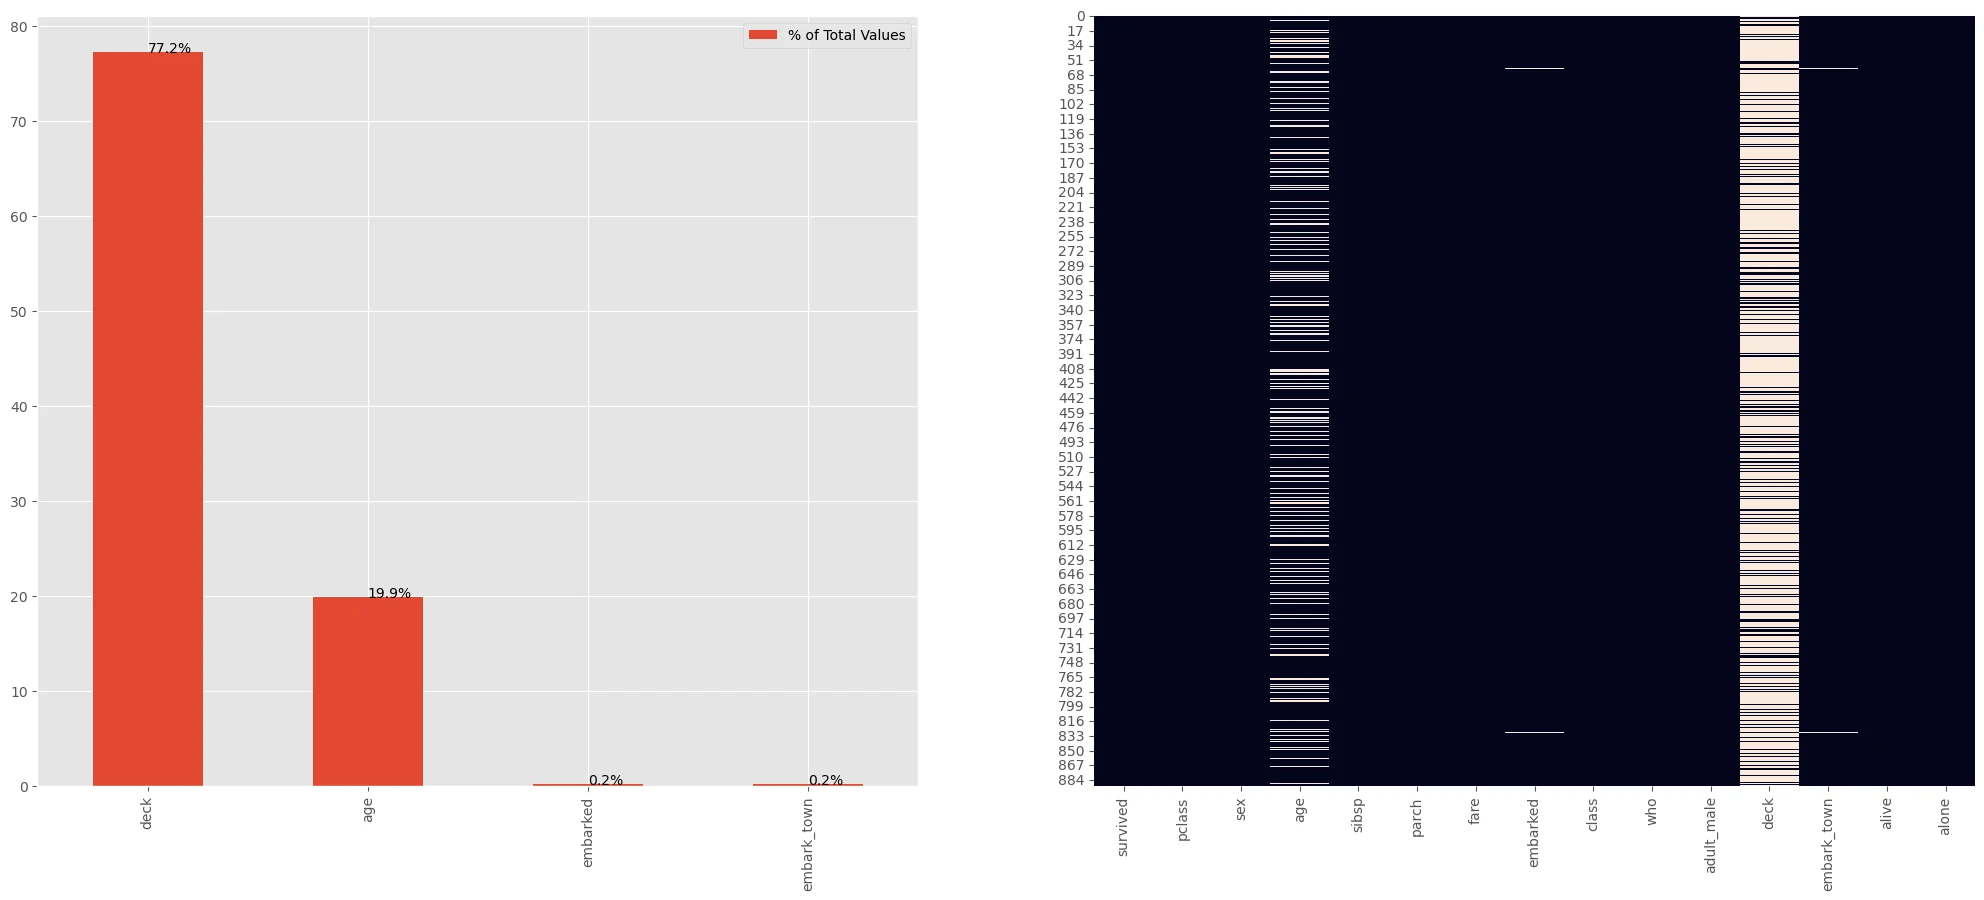
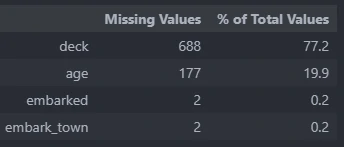
by calling describe.missing_values_table we can more extensively analyze missing value in our dataset.
describe.missing_values_table(main_data)
This function requires the following parameters:
- main_data (
dataframe): Data input
The result
Your selected dataframe has 15 columns.
There are 4 columns that have missing values.
 _________
Third Example
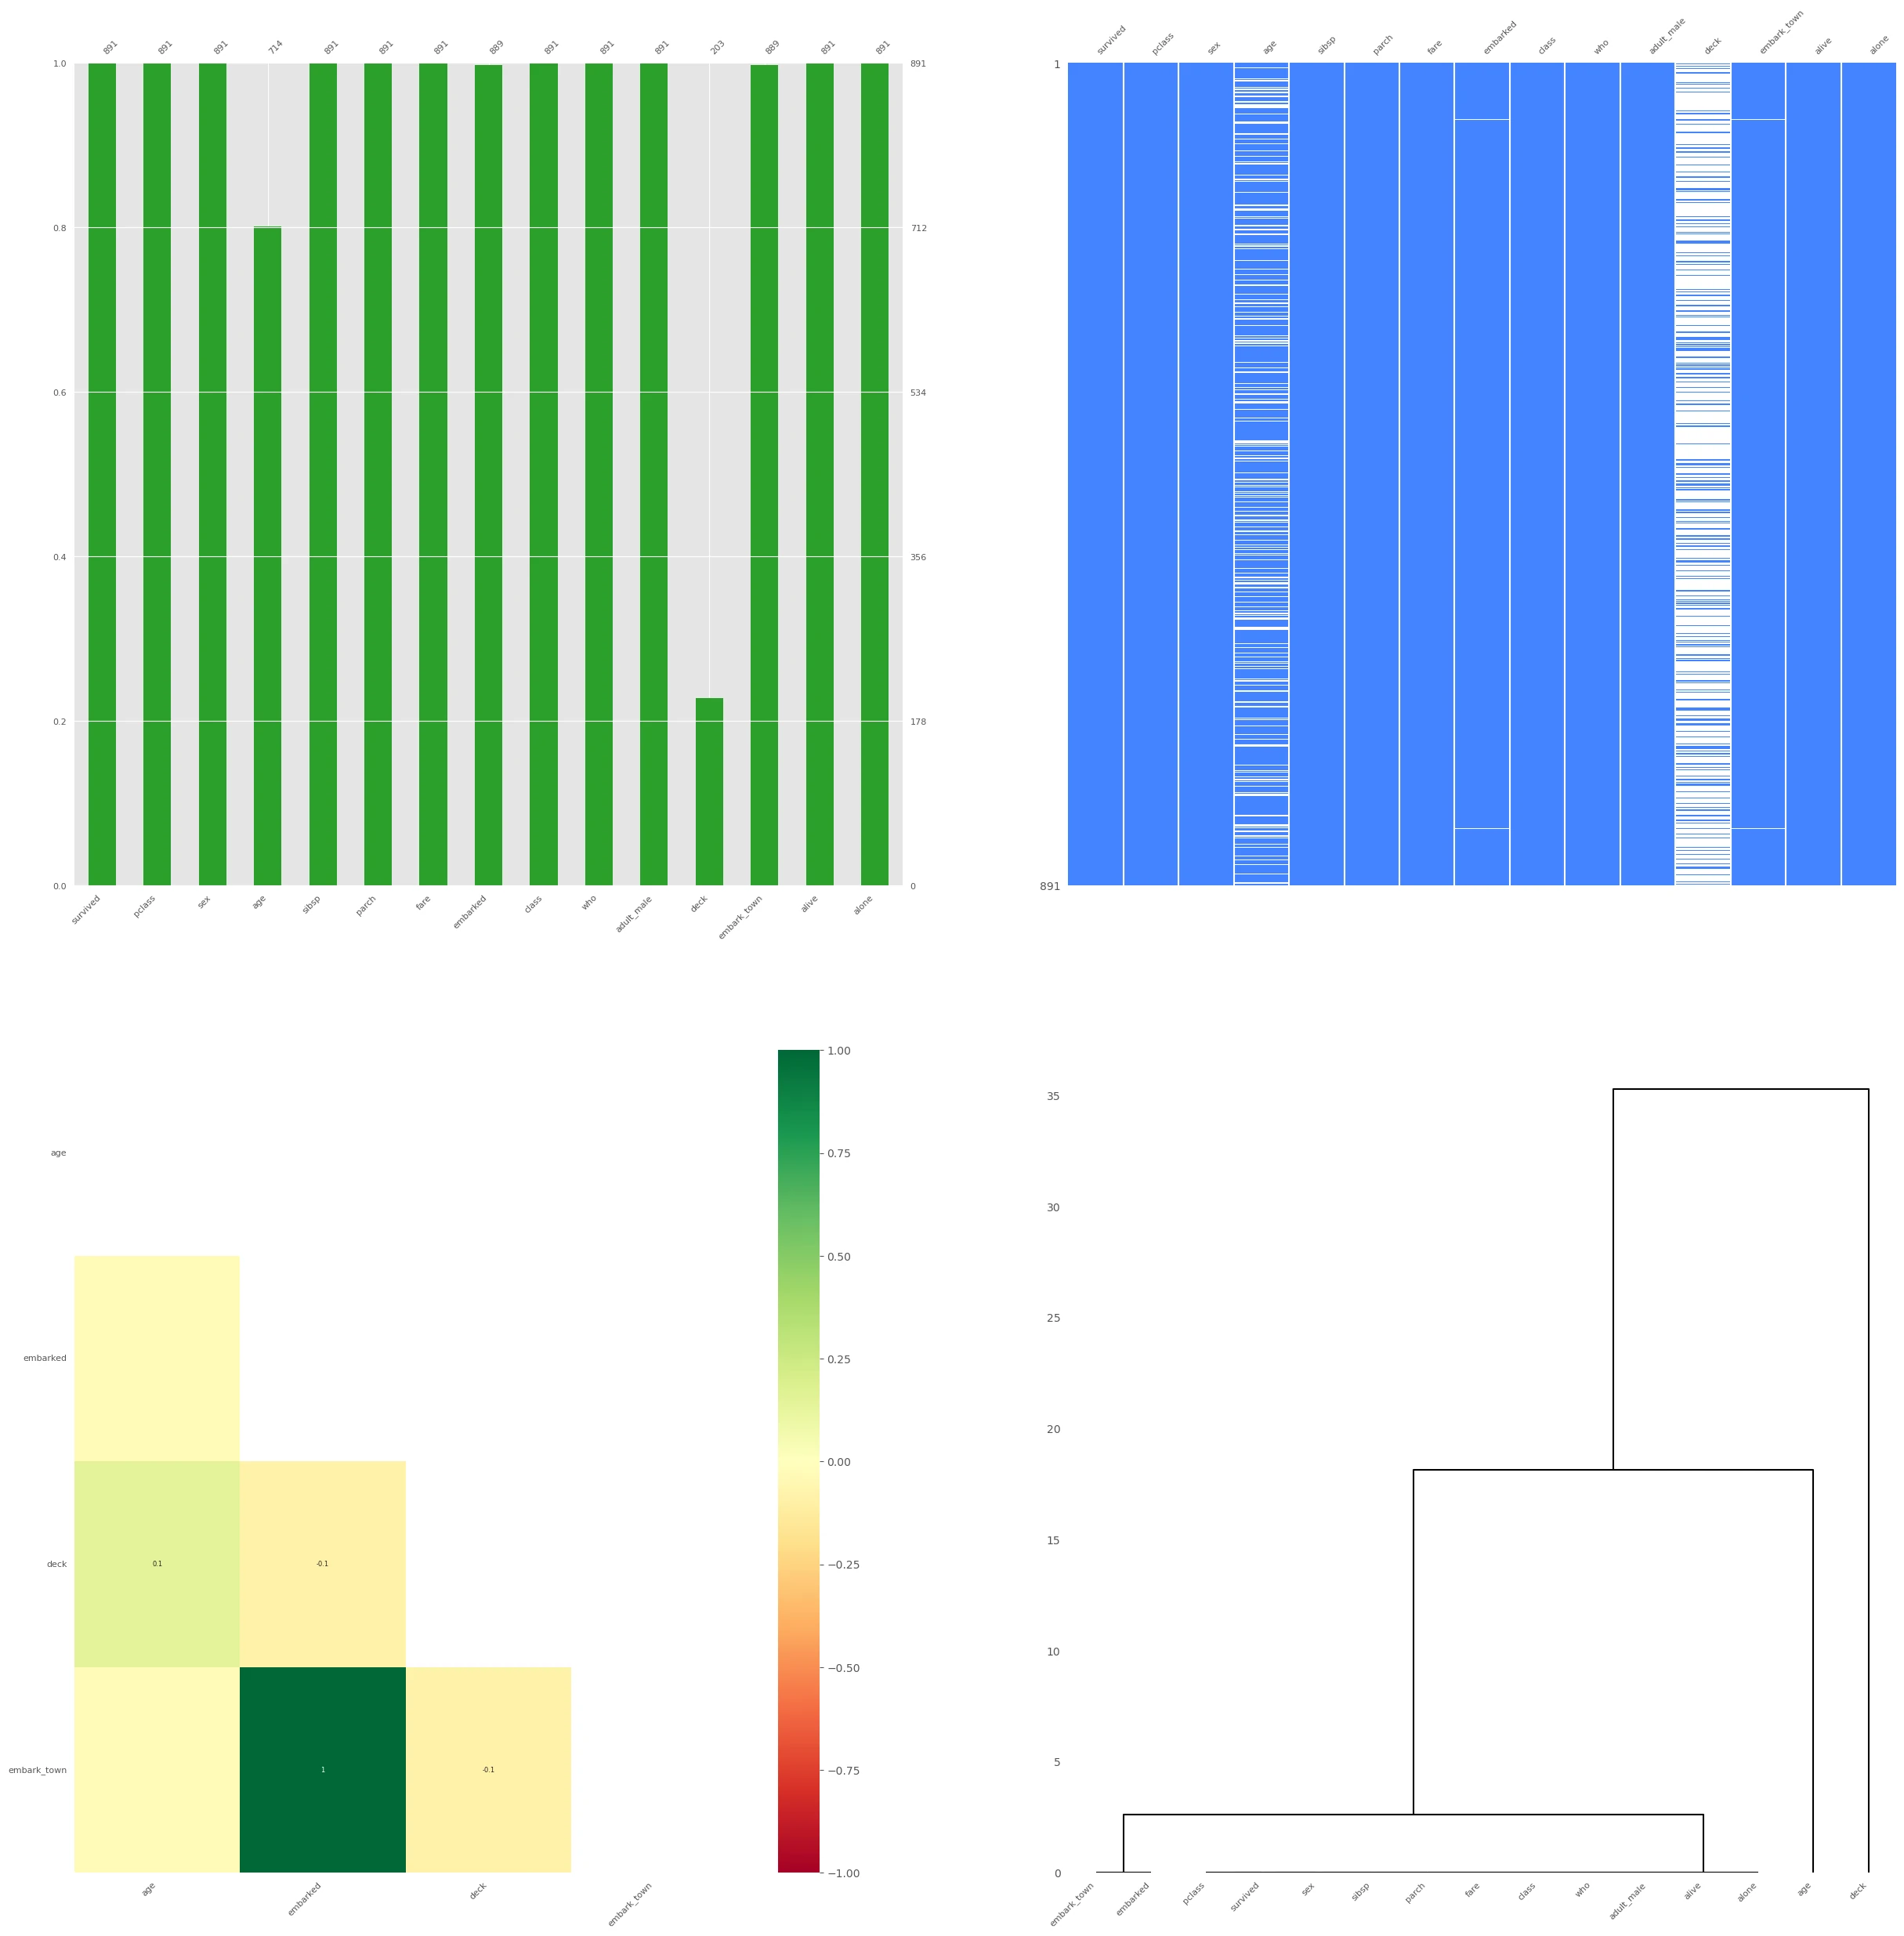
Show an heatmap and bar plot for missing value. it also provides correlation plot and hierarchy plot for each missing value.
by calling describe.missing_no we can calculate more deep analysis for missing value.
describe.missing_no(main_data)
This function requires the following parameters:
- main_data (
dataframe): Data input
The result