Create Profiling Data
descriptive analytics
Introduction
Data quality profiling and exploratory data analysis are crucial steps in the process of Data Science and Machine Learning development. This project is one of the tool that can be used as the first step in the data understanding step of the data science workflow.
This project heavly used ydata-profiling, which is a leading package for data profiling, that automates and standardizes the generation of detailed reports, complete with statistics and visualizations. The significance of the package lies in how it streamlines the process of understanding and preparing data for analysis
Dataset
Load dataset
we use simple and common titanic dataset from seaborn library.
df = sns.load_dataset("titanic")
| survived | pclass | sex | age | sibsp | parch | fare | embarked | class | who | adult_male | deck | embark_town | alive | alone | |
|---|---|---|---|---|---|---|---|---|---|---|---|---|---|---|---|
| 0 | 0 | 3 | male | 22 | 1 | 0 | 7.25 | S | Third | man | True | nan | Southampton | no | False |
| 1 | 1 | 1 | female | 38 | 1 | 0 | 71.2833 | C | First | woman | False | C | Cherbourg | yes | False |
| 2 | 1 | 3 | female | 26 | 0 | 0 | 7.925 | S | Third | woman | False | nan | Southampton | yes | True |
| 3 | 1 | 1 | female | 35 | 1 | 0 | 53.1 | S | First | woman | False | C | Southampton | yes | False |
| 4 | 0 | 3 | male | 35 | 0 | 0 | 8.05 | S | Third | man | True | nan | Southampton | no | True |
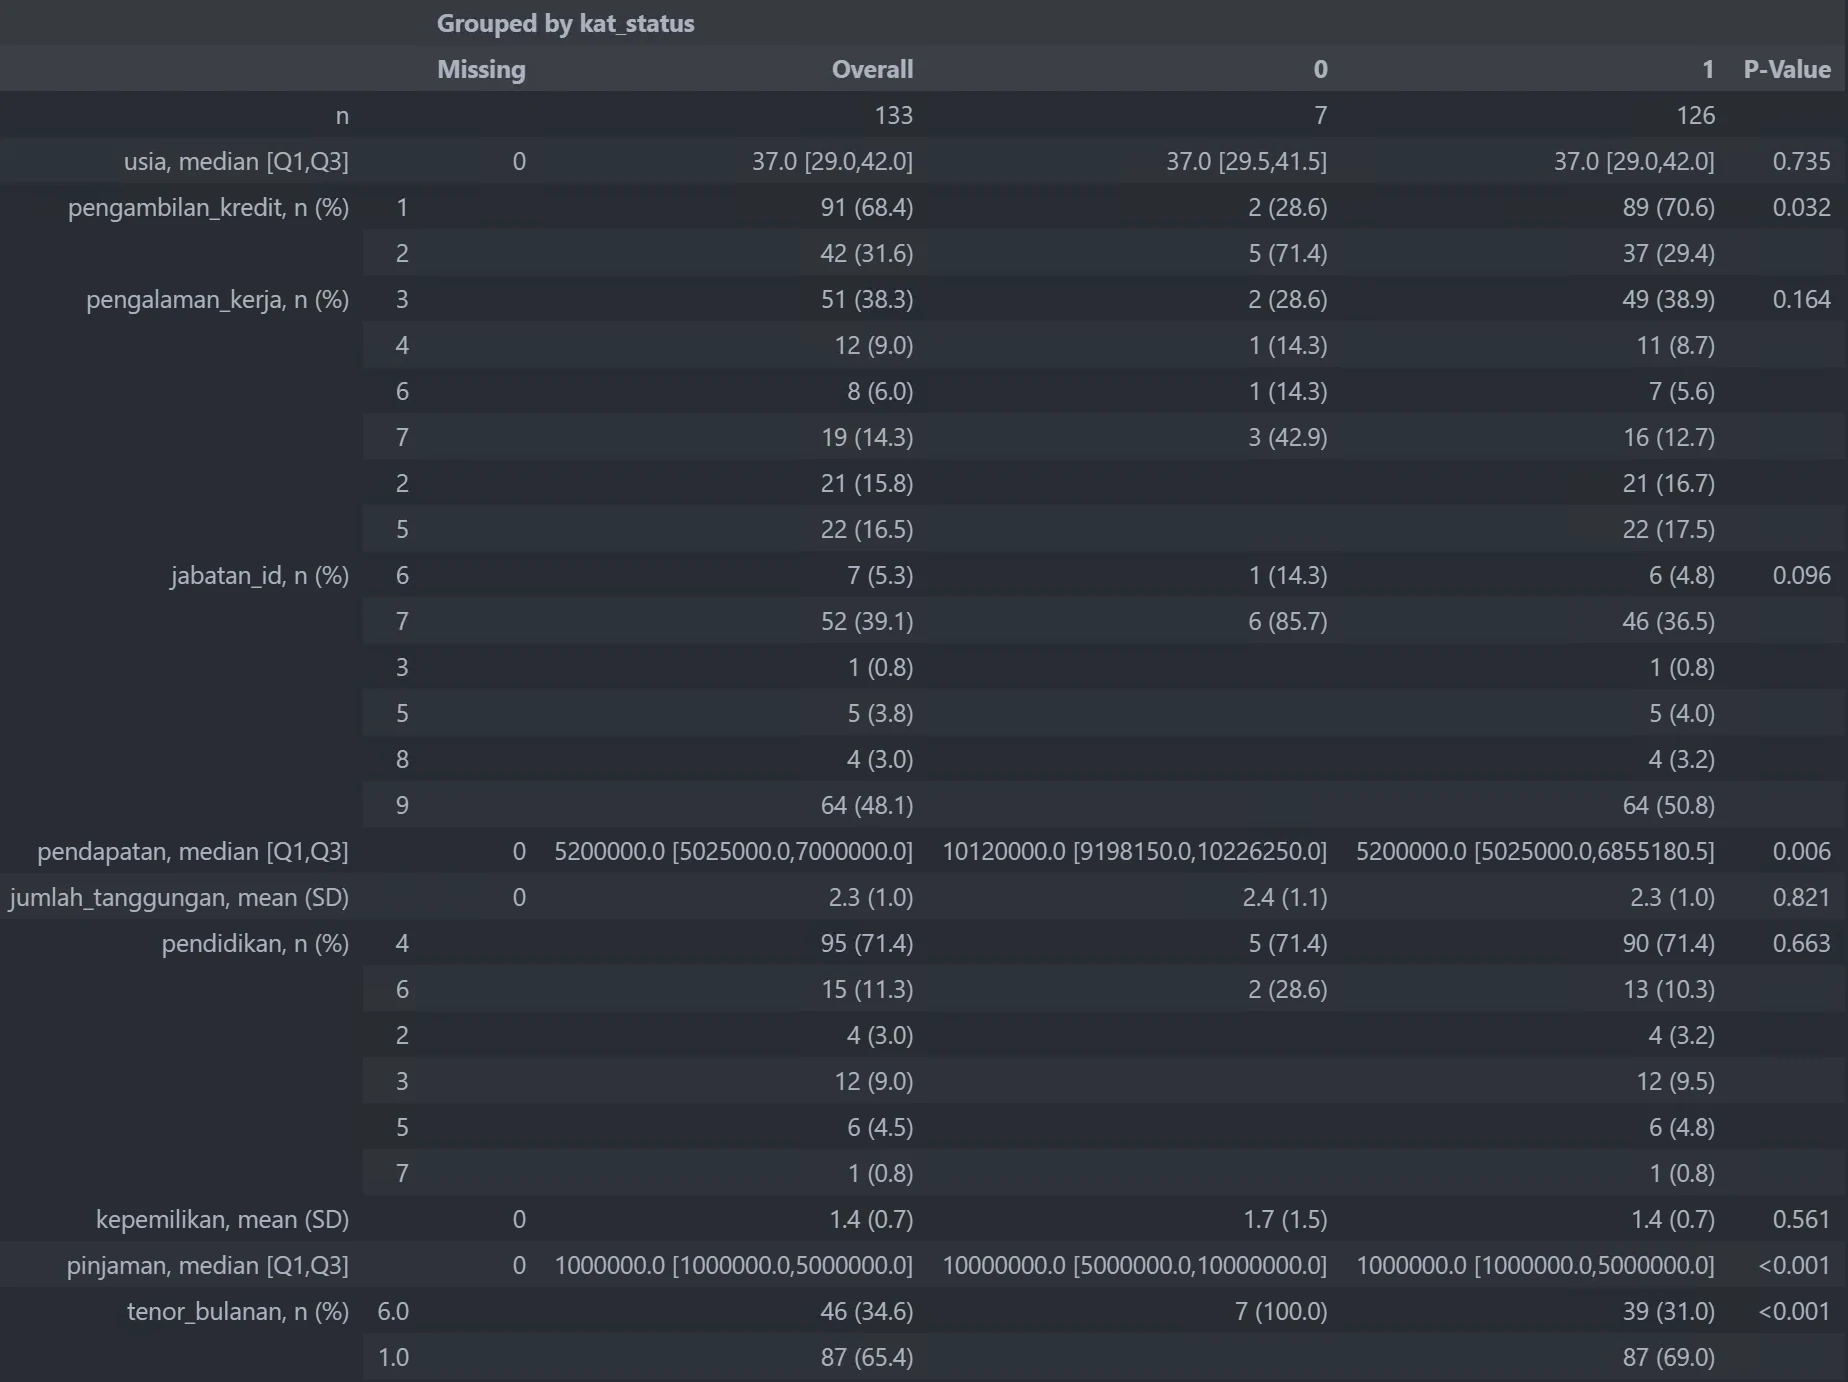
The Code
By calling, describe.tableone we can generate extensive descriptive and analysis with our dataset.
describe.tableone(df, col_list, cat_col, non_normal, label_col)
This function requires the following parameters:
- main_data (
dataframe): Data Input - col_list (
list): selected columns - cat_col (
list): categorical columns - non_normal (
list): numerical columns - label_col (
string): targeted column
The result
The Code
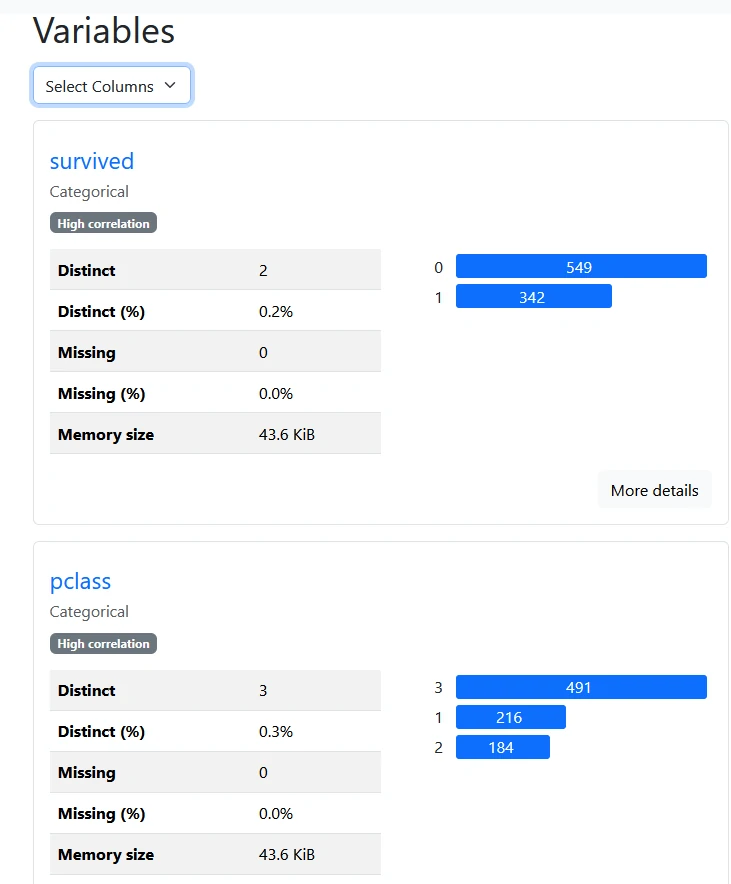
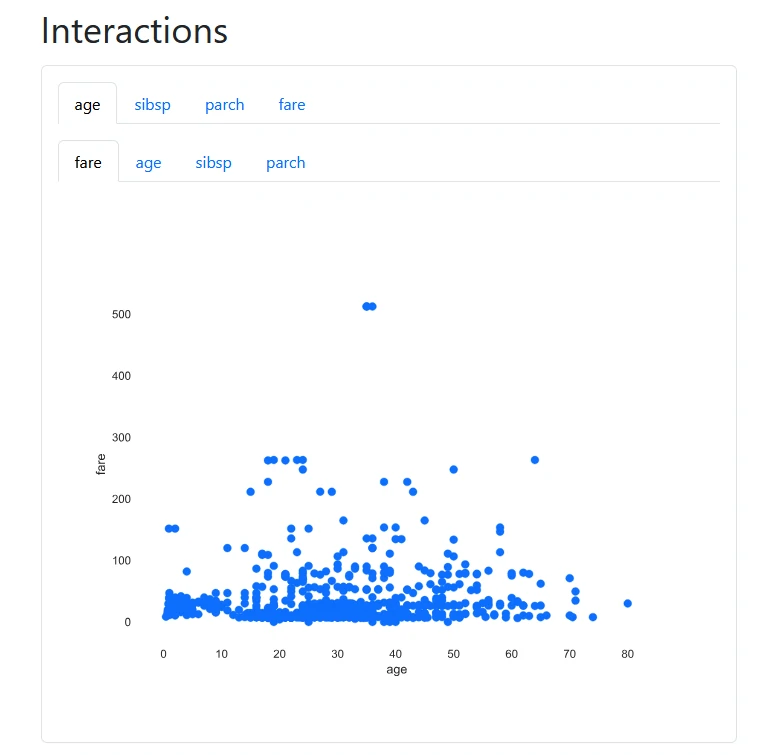
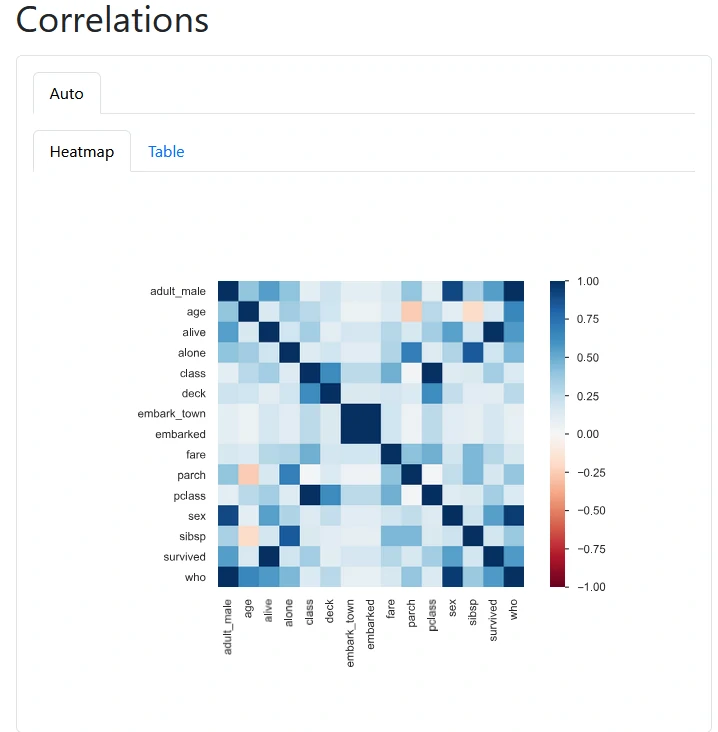
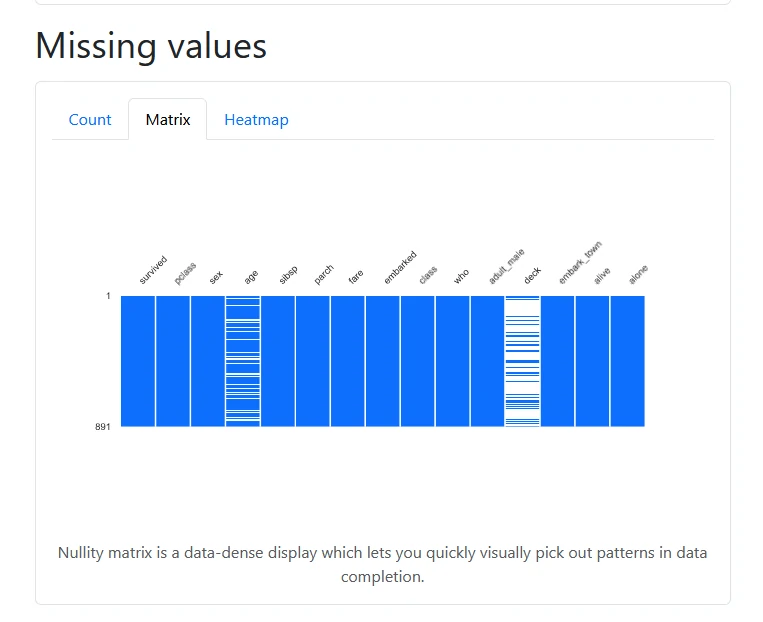
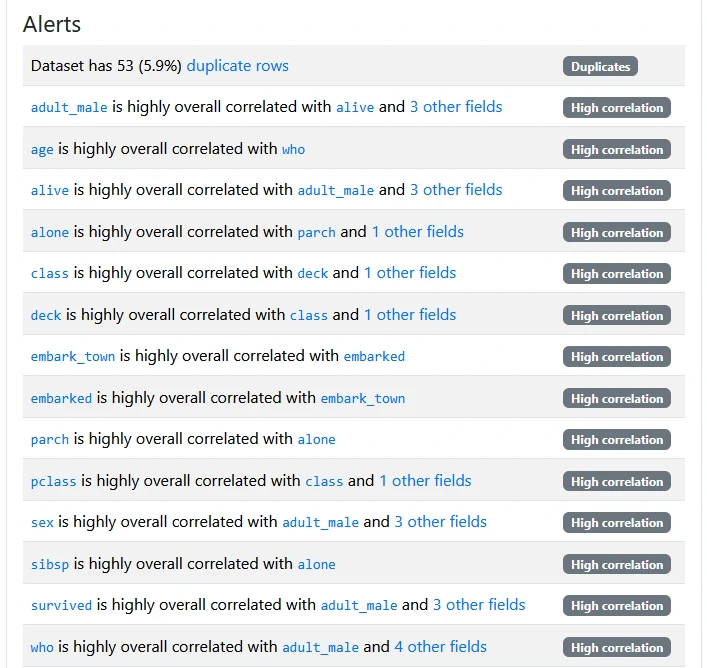
By calling, describe.profiling we can generate HTML file that contain all profiling and exploratory data analysis
describe.profiling(main_data,title,output)
This function requires the following parameters:
- main_data (
dataframe): Data Input - title (
string): title name - output (
string): output file name
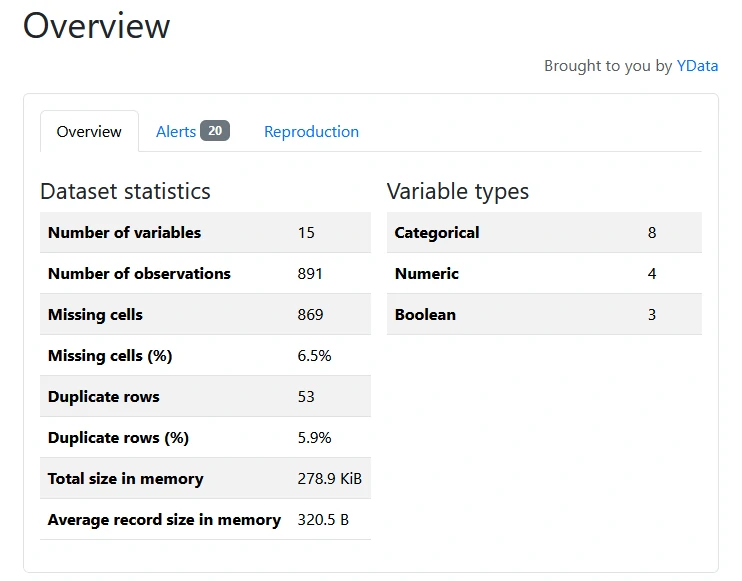
The result
The Code
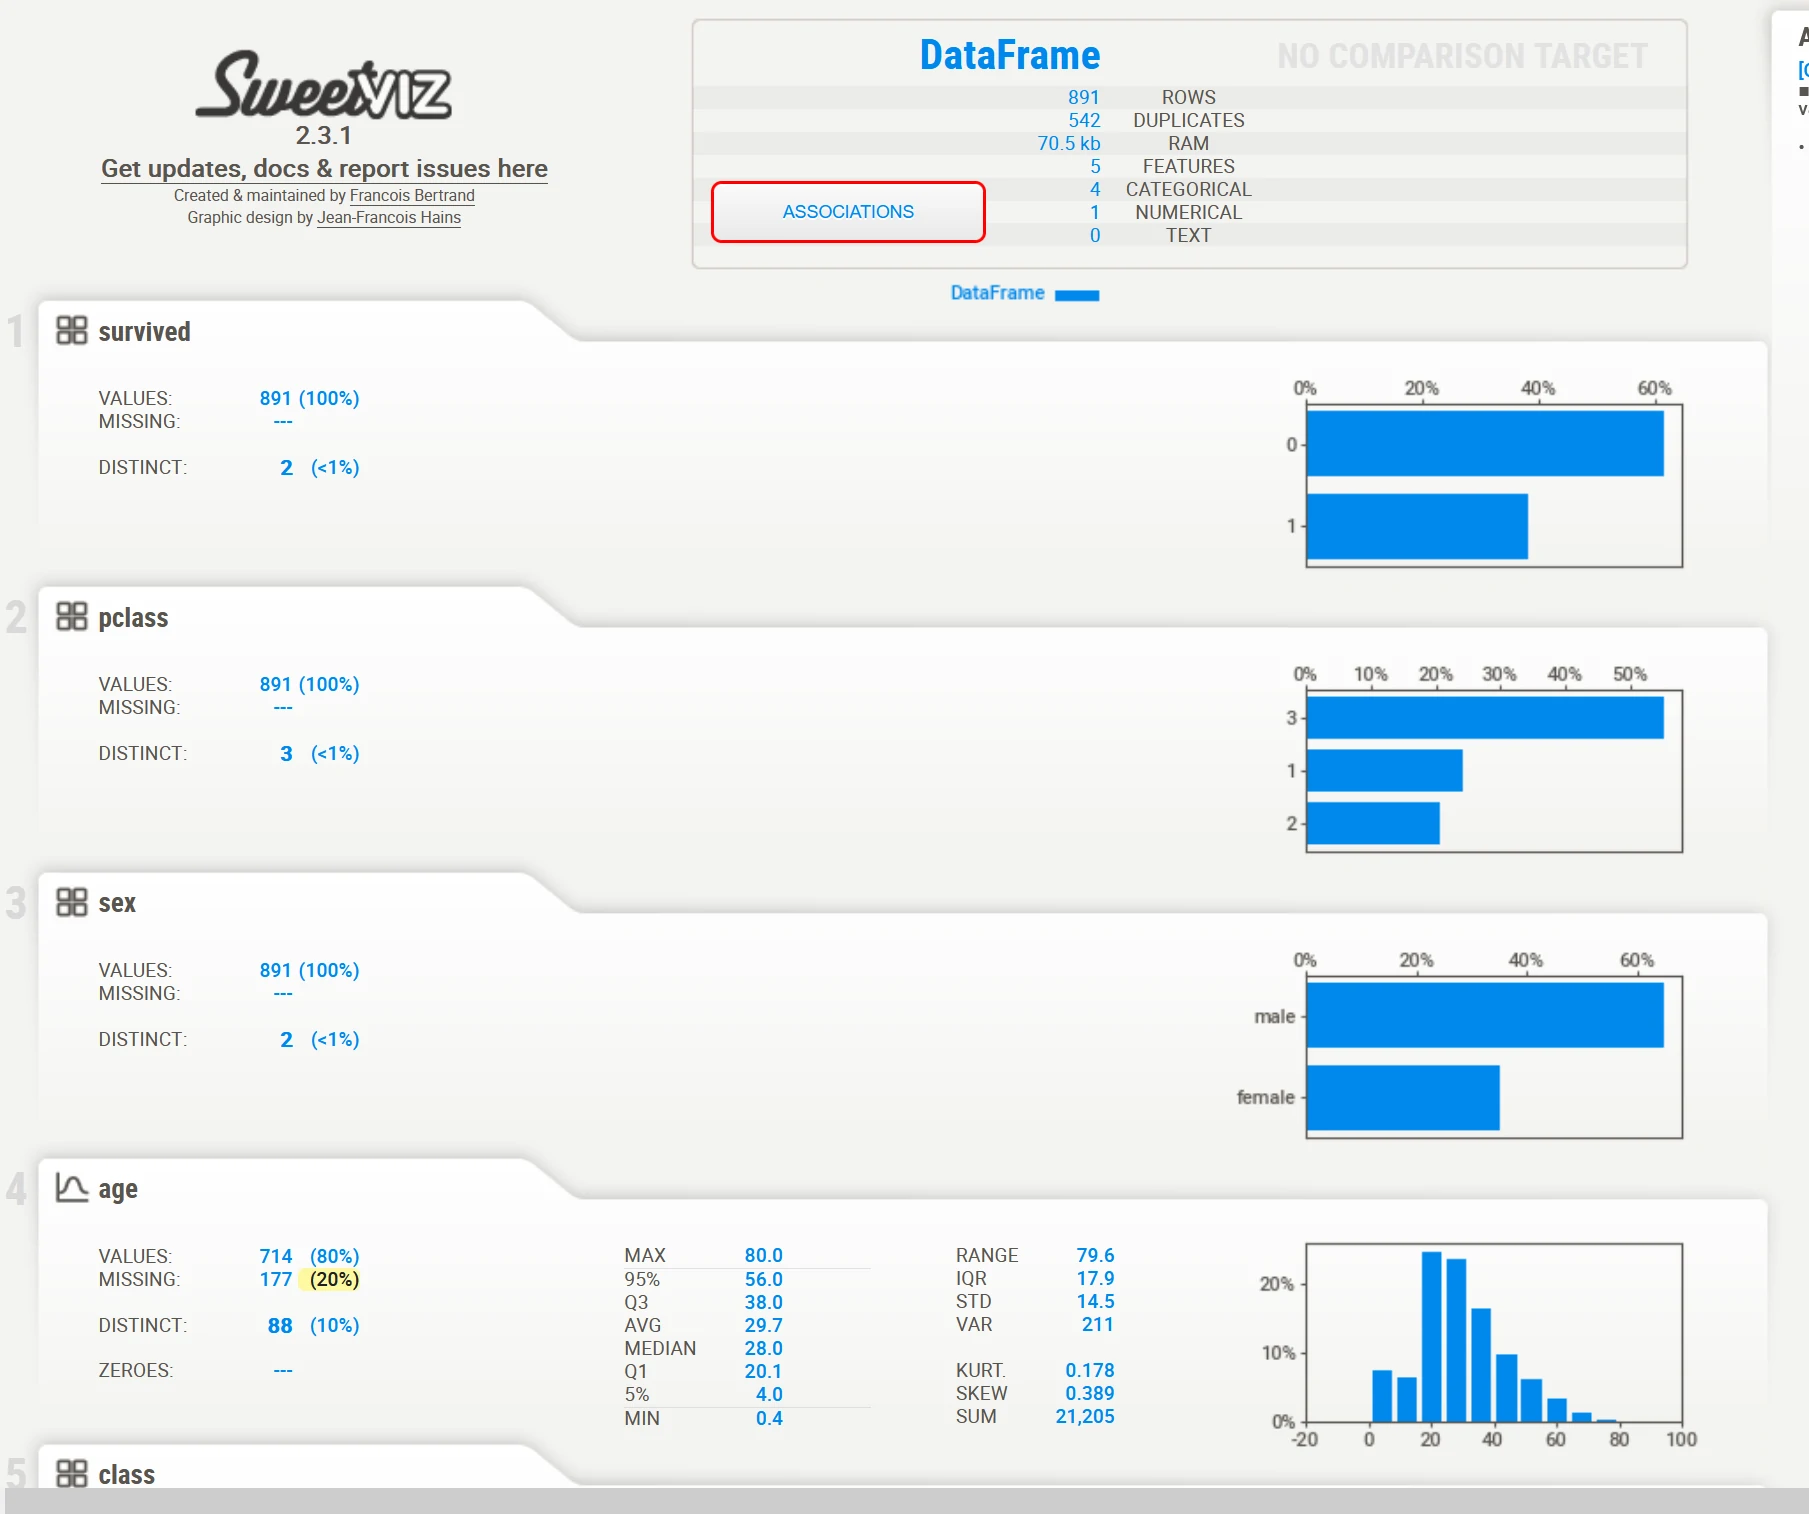
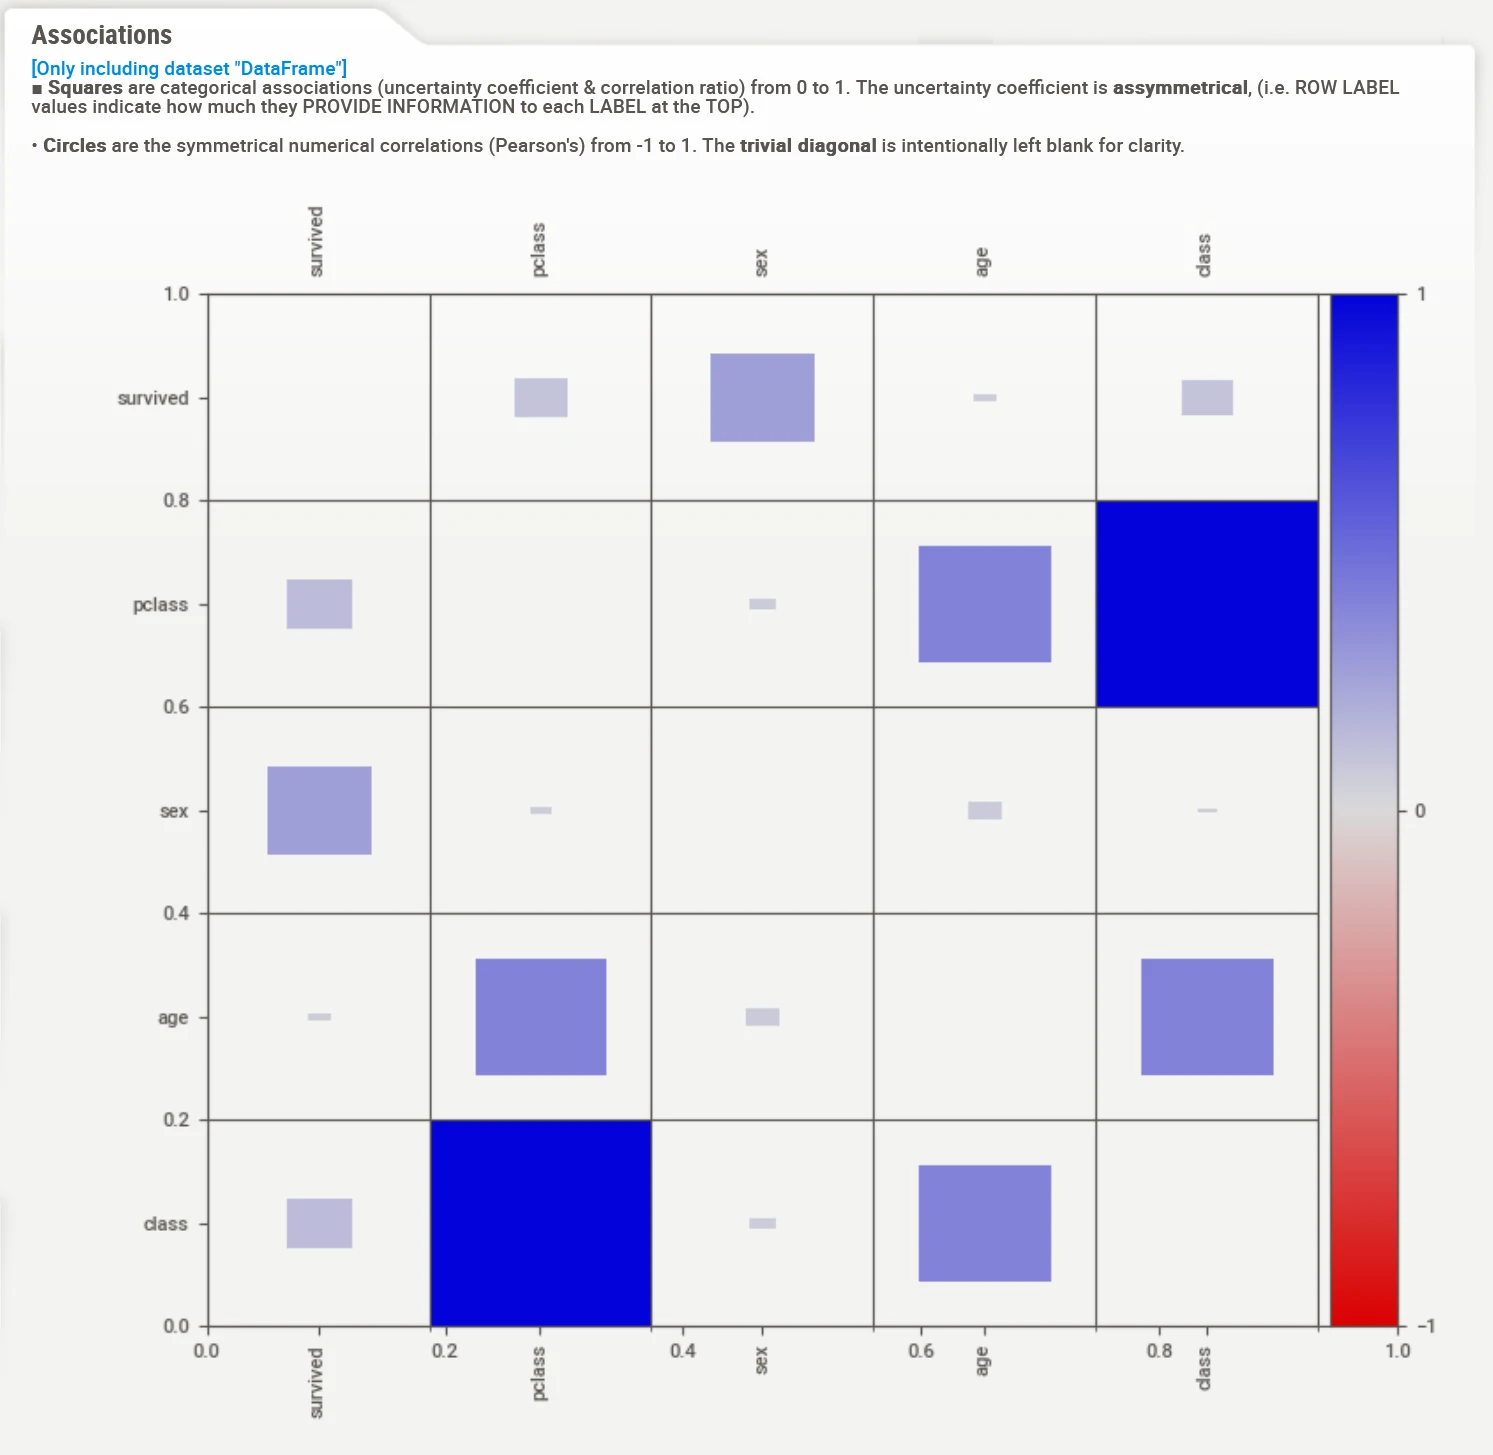
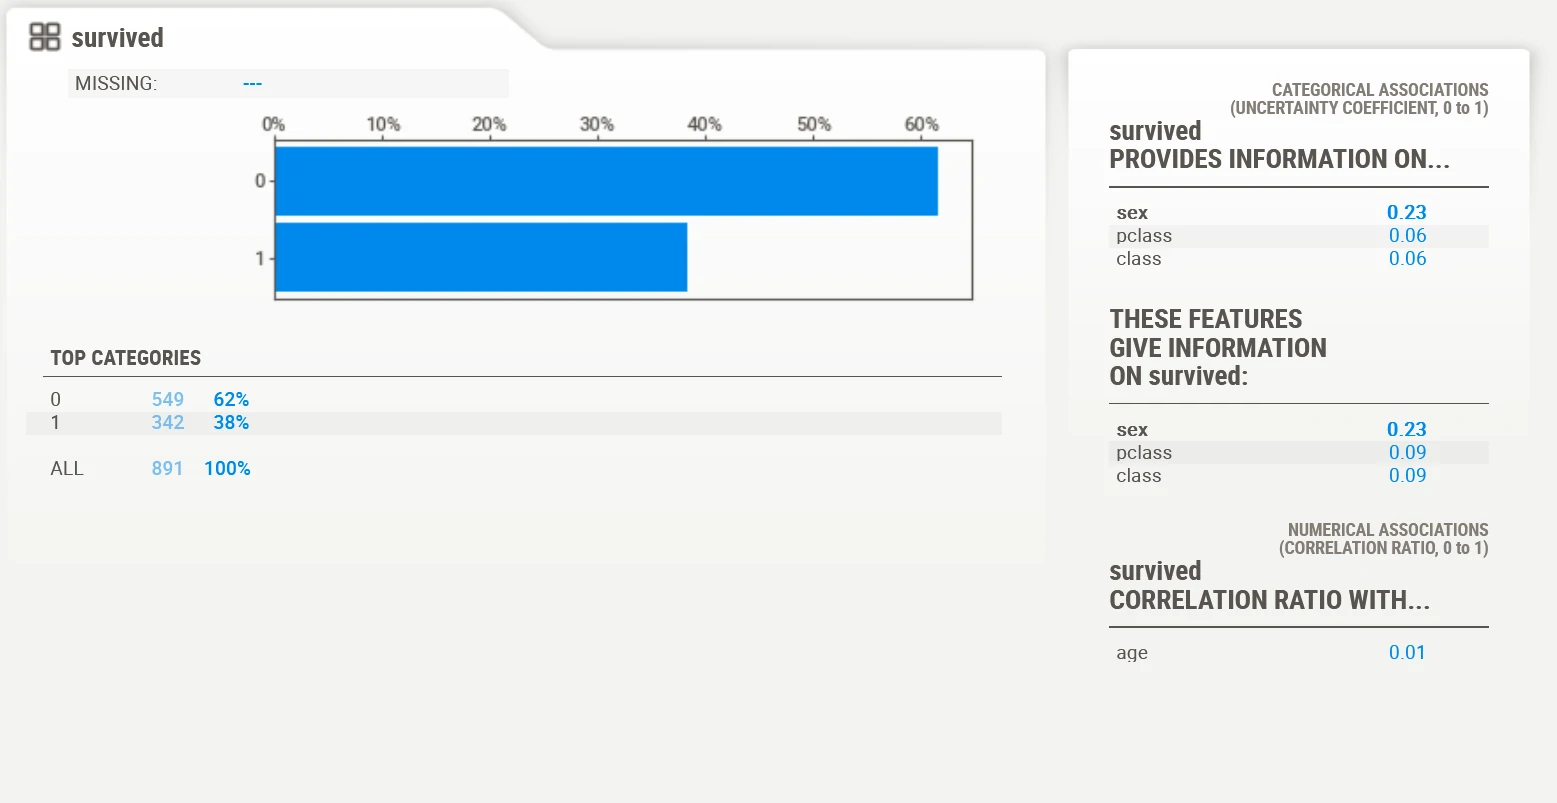
By calling, describe.sweetviz we can generate HTML file that contain all profiling and exploratory data analysis
describe.sweetviz(main_data, target, name_file)
This function requires the following parameters:
- main_data (
dataframe): Data Input - target (
string): targeted column - name_file (
string): output file name
The result
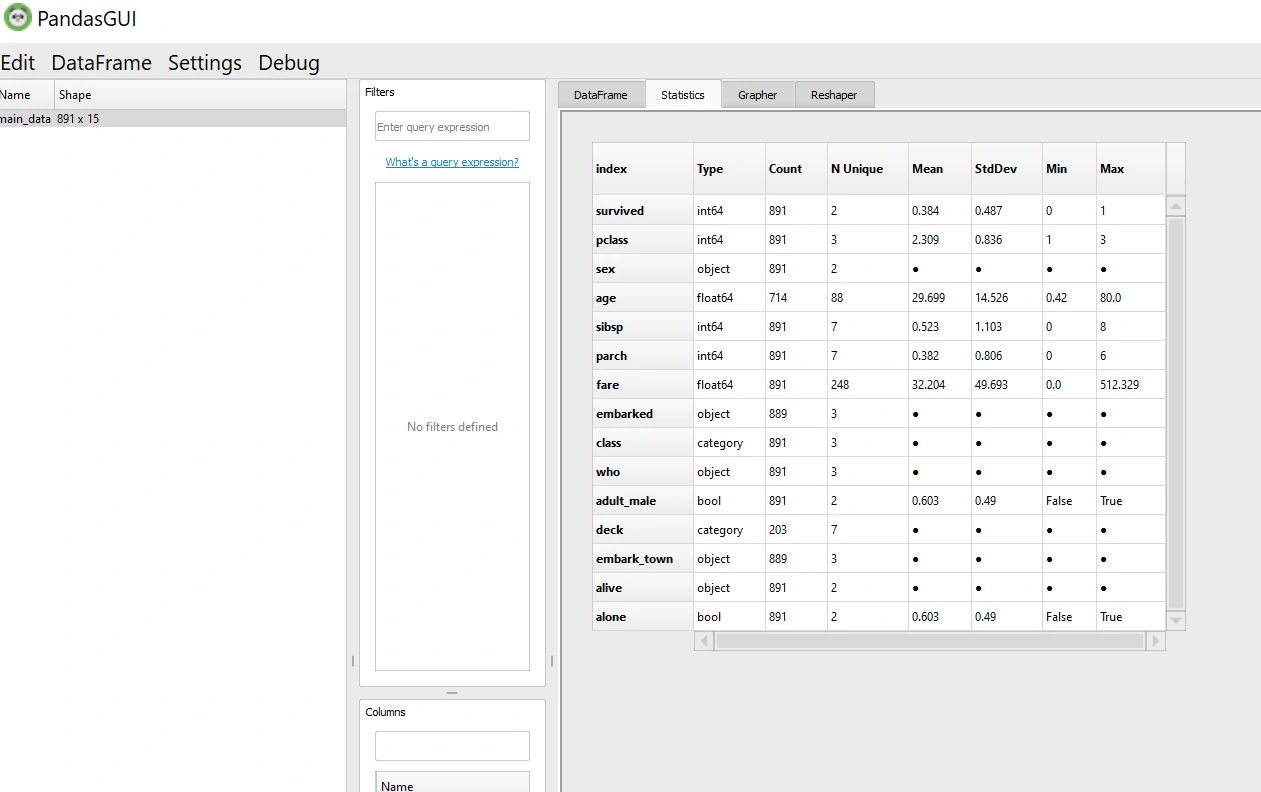
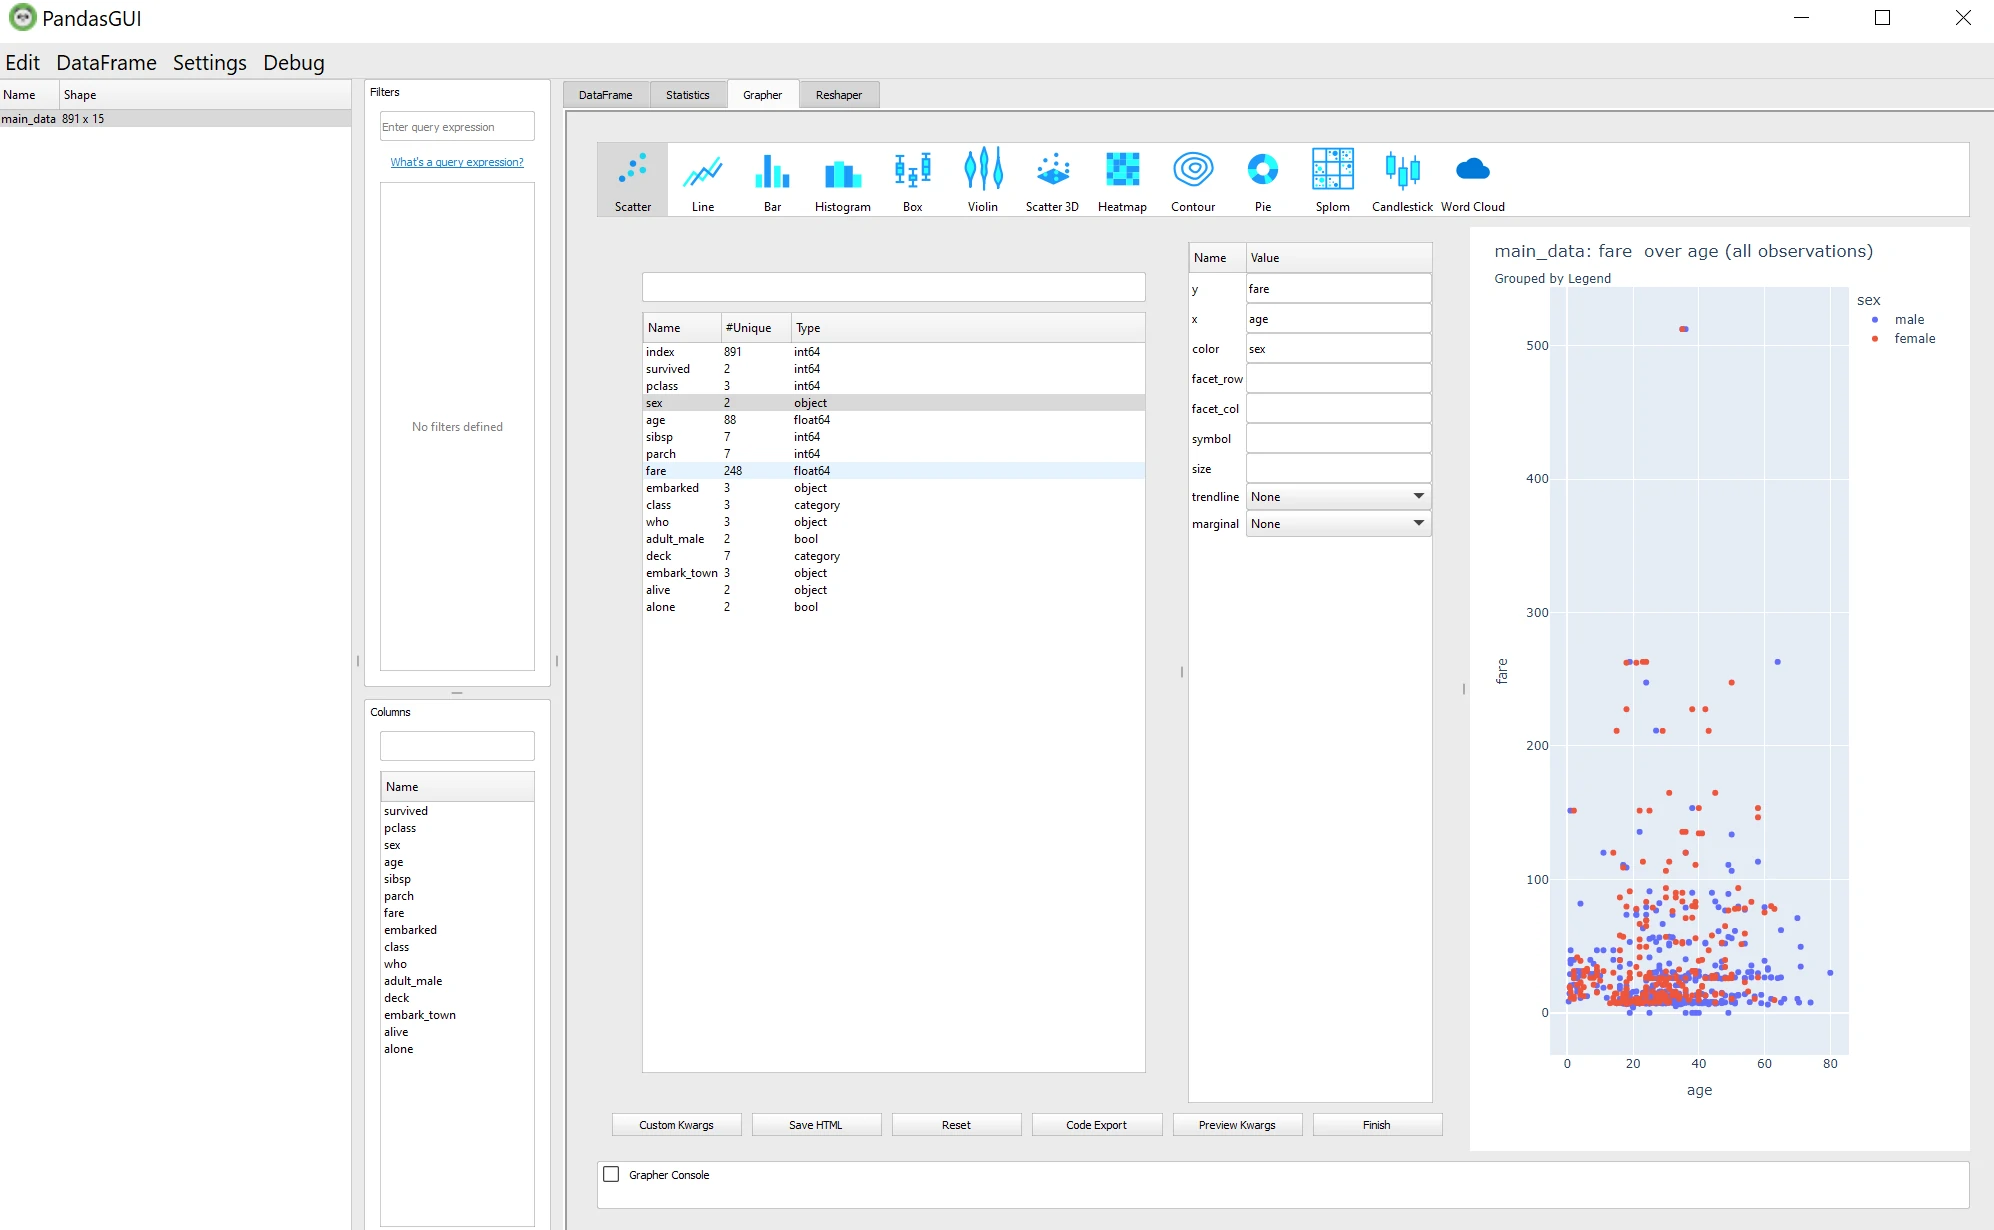
The Code
By calling, describe.pandas_gui we can generate descriptive GUI with pandasgui
describe.pandas_gui(main_data)
This function requires the following parameters:
- main_data (
dataframe): Data Input
The result