Change detection in multitemporal remote sensing images
geospatial
map
change detection
multitemporal
remote sensing
Introduction
Change detection involves analyzing 2 or more multitemporal remote sensing images covering the same area to find any changes that may have occurred at different times. The ability to find changes that occur in remote sensing images, this method can be applied in real applications such as:
- Deforestation monitoring
- Damage assessment
- Vegetation phenology variation study
- Disaster monitoring
- Monitoring of glaciers and sea ice
- Coastal monitoring
- Urban expansion research
- Ecosystem monitoring, etc.

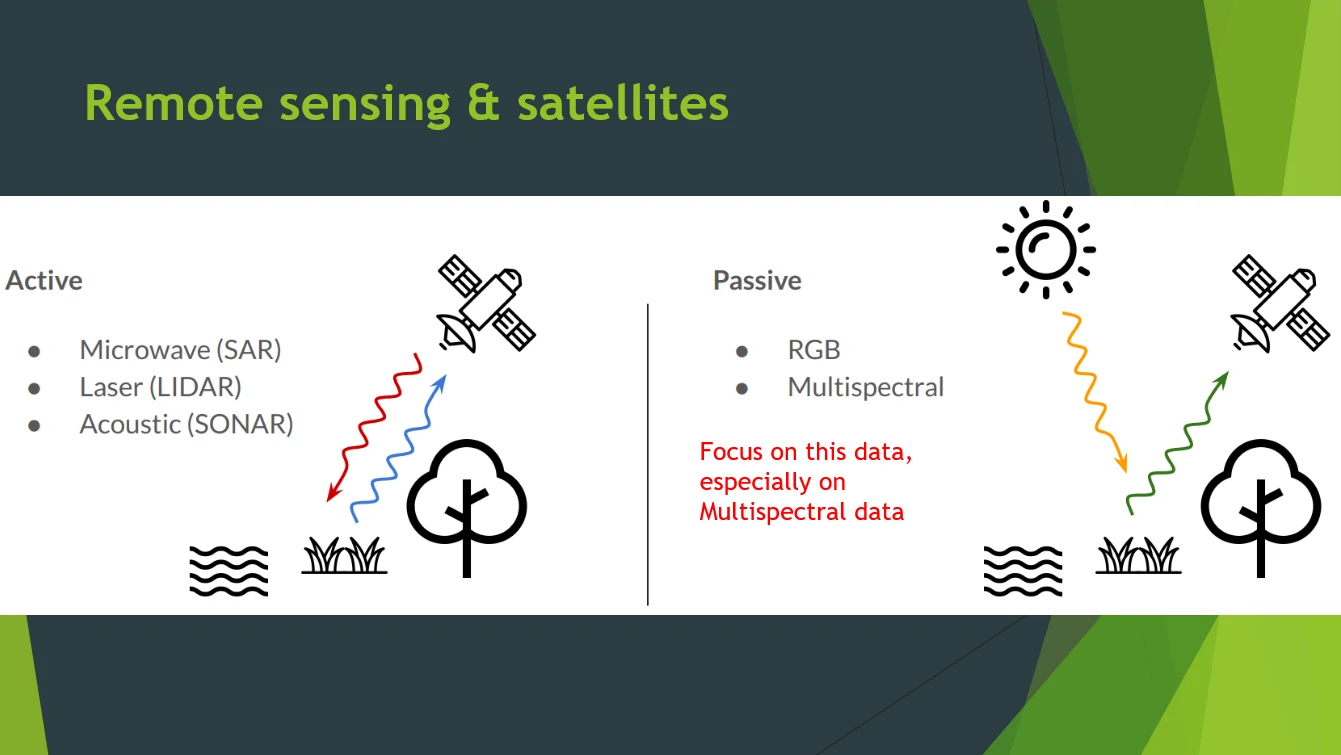
Remote sensing & satellites
Change detection algorithms
In this report we will talk about 3 of 4 algorithms in change detection on remote sensing images.
- Image algebra methods - Combination of PCA and K-Means
- Image transformation methods - Unsupervised Deep Slow Feature Analysis
- Classification methods - Deep siamese multi-scale fully convolutional network
- Other advanced methods - Wavelet, Marcove random field
Dataset
River dataset
The River dataset consists of two 198-band images with a spatial size of 463 × 241. The changed region of this dataset contains 12566 pixels, while the unchanged region contains 99017 pixels.
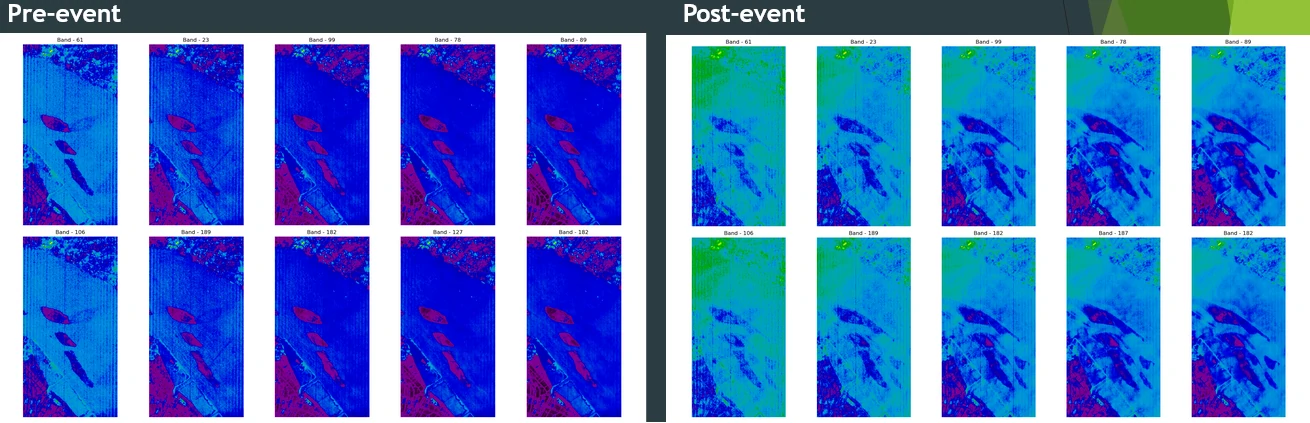
reference: https://doi.org/10.1109/TGRS.2019.2930682
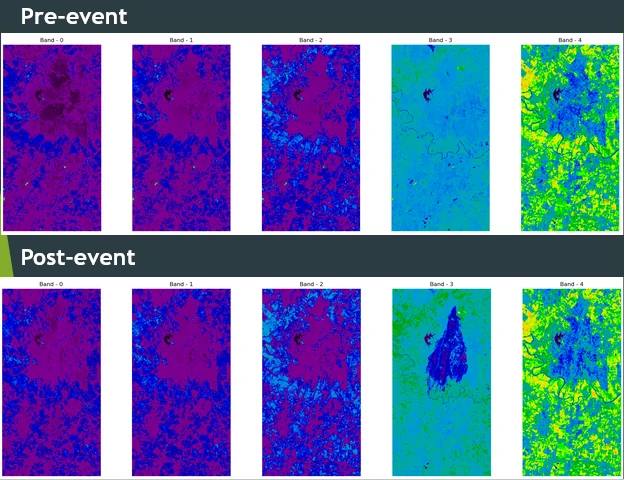
Cross-sensor relative spectral alignment dataset
This dataset consists of four images acquired from different sensors in Bastrop County, Texas (USA), before and after the 2011 wildfire. This dataset is composed of Landsat 5 TM as pre-event imagery and Landsat 5 TM, EO-1 ALI, and Landsat 8 as post-event imagery. This dataset also contains ground truth that can be used for evaluation.
reference: https://doi.org/10.1016/j.isprsjprs.2015.02.005
SZTAKI AirChange Benchmark set (ACD) dataset
The ACD dataset consists of 13 sets of multi-temporal RGB aerial images acquired under different seasonal conditions and ground truth. The size of each image is 952 × 640 and the spatial resolution is 1.5m.
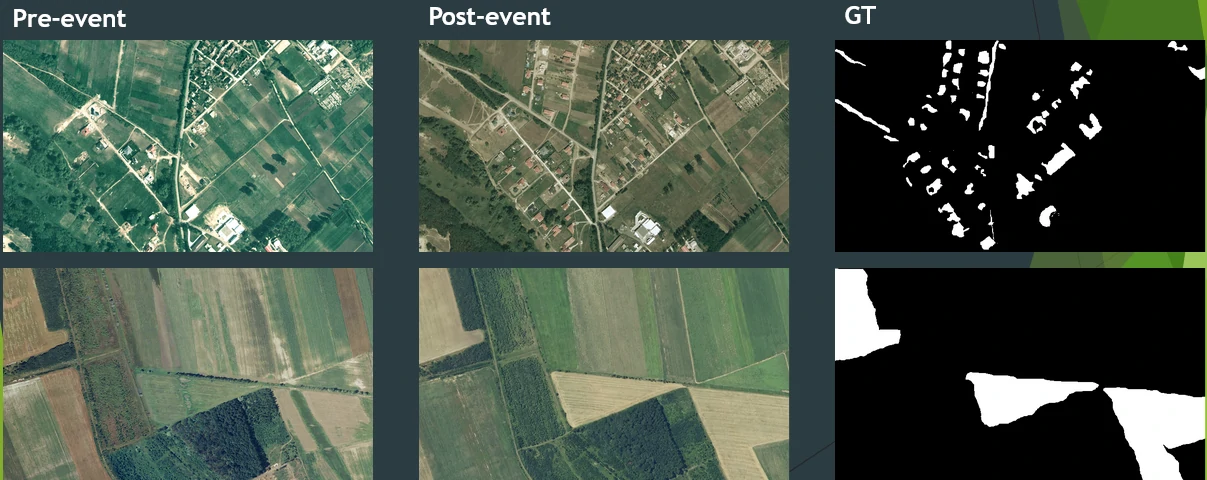
reference: http://web.eee.sztaki.hu/remotesensing/airchange_benchmark.html
The algorithms
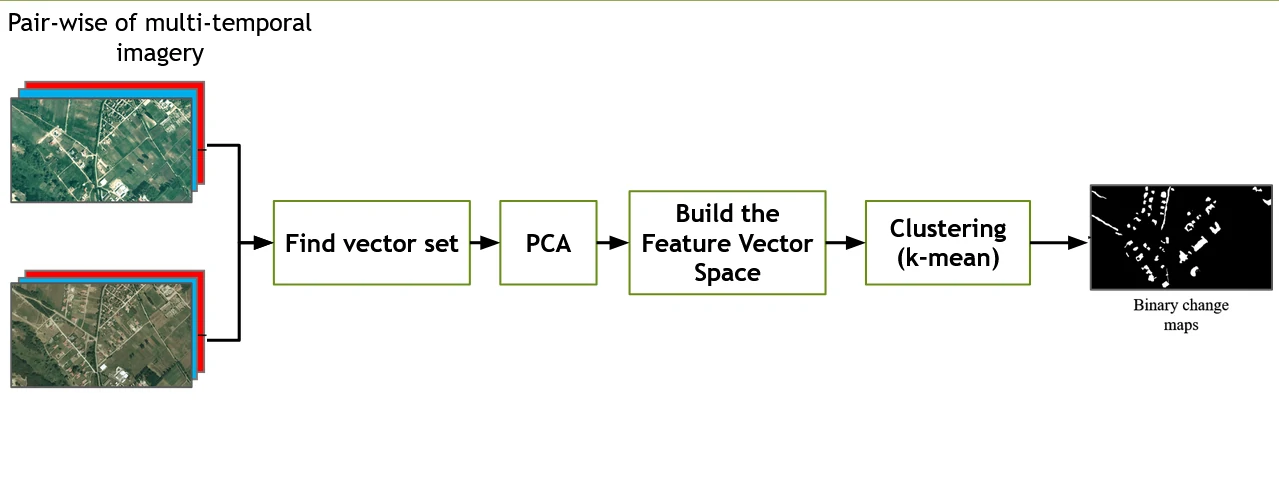
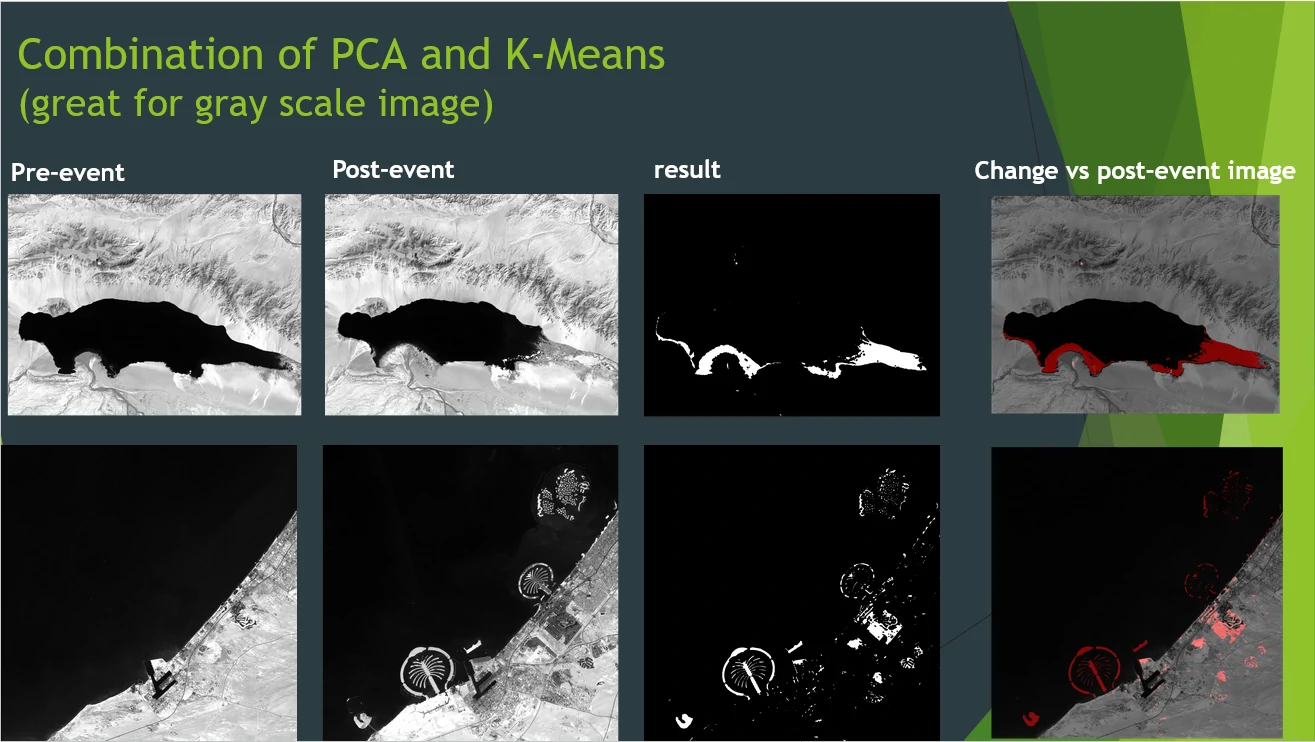
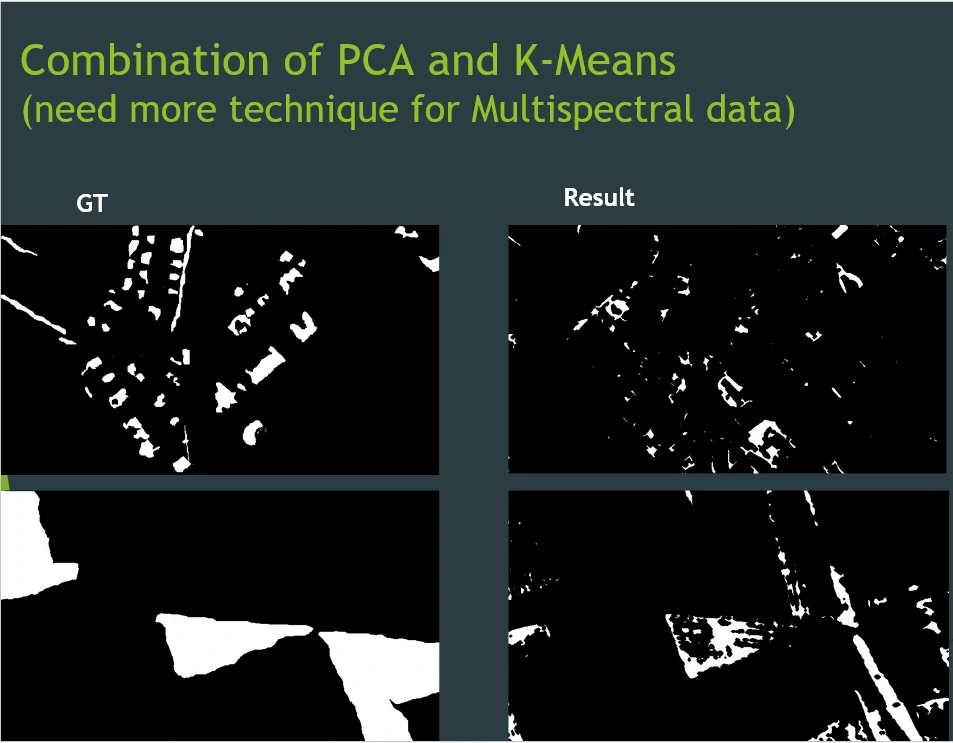
Image algebra methods - Combination of PCA and K-Means
This algorithm requires the following Hyperparameter parameters:
- blocks size (
tuple): default value (5 x 5), non-overlapping blocks of block size of feature vector space - components (
int): default value 3, The number of clusters in k-mean
we take non-overlapping blocks of size 5 x 5 from the difference image and flatten them into row vectors. The image can be resized to make both the dimensions a multiple of 5 by scipy.misc.imresize(). Collection of these row vectors forms a vector set.
Result
Hard to compute accuracy and other scoring value because we can’t calculate feature vector space at 4 boundary rows and 4 boundary columns pixels (for 5x5 block FVS boundary limitation), and it remove during calculation.
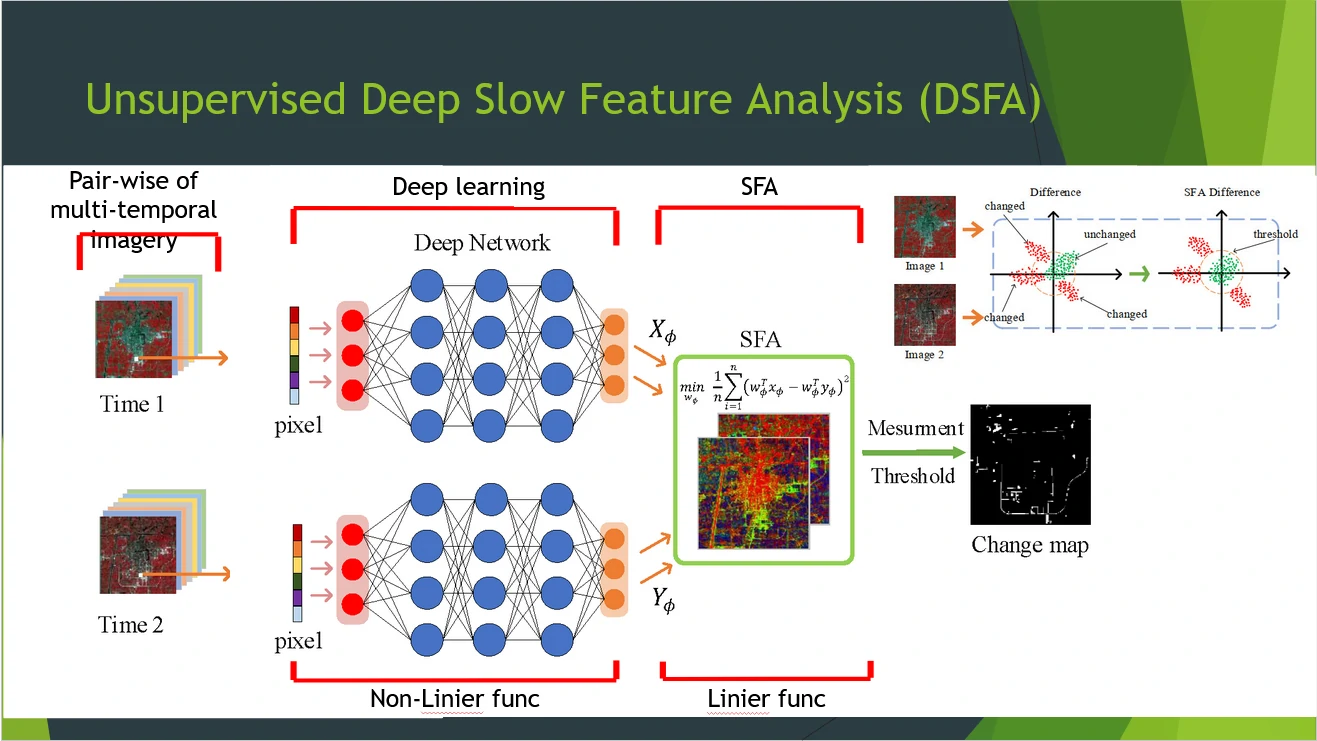
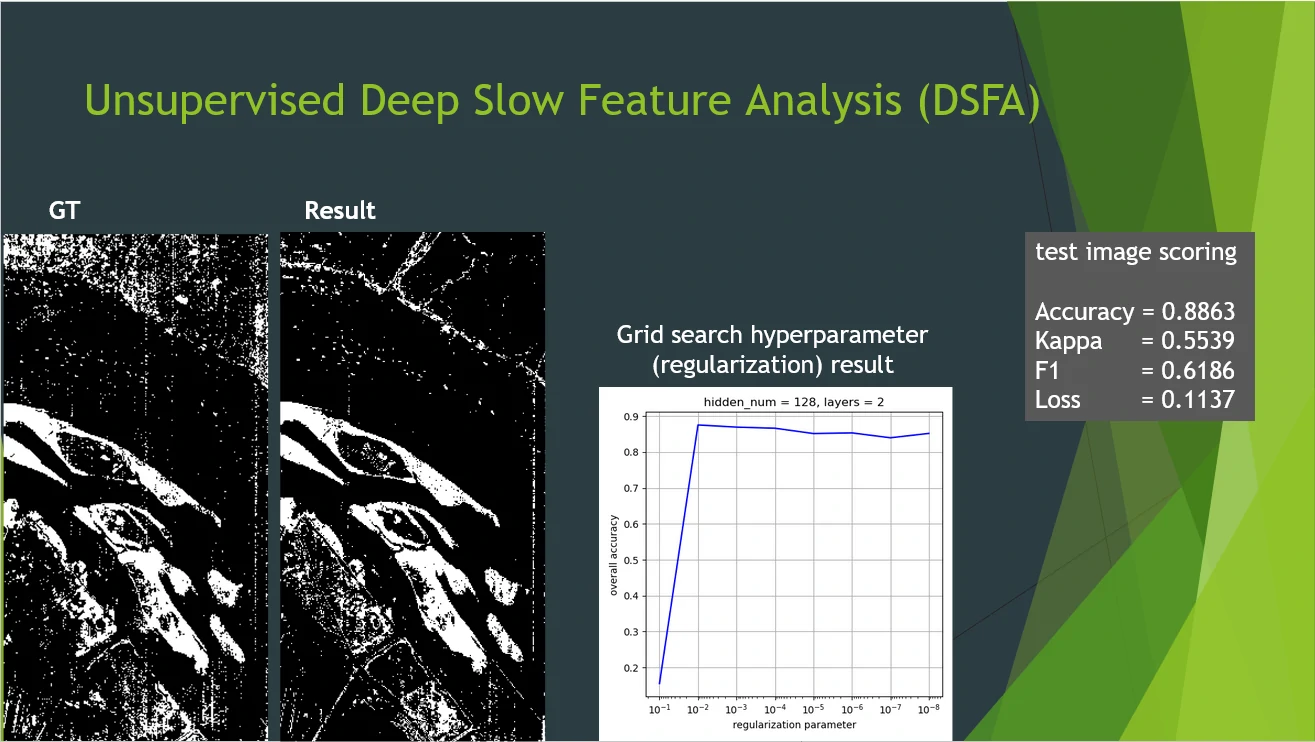
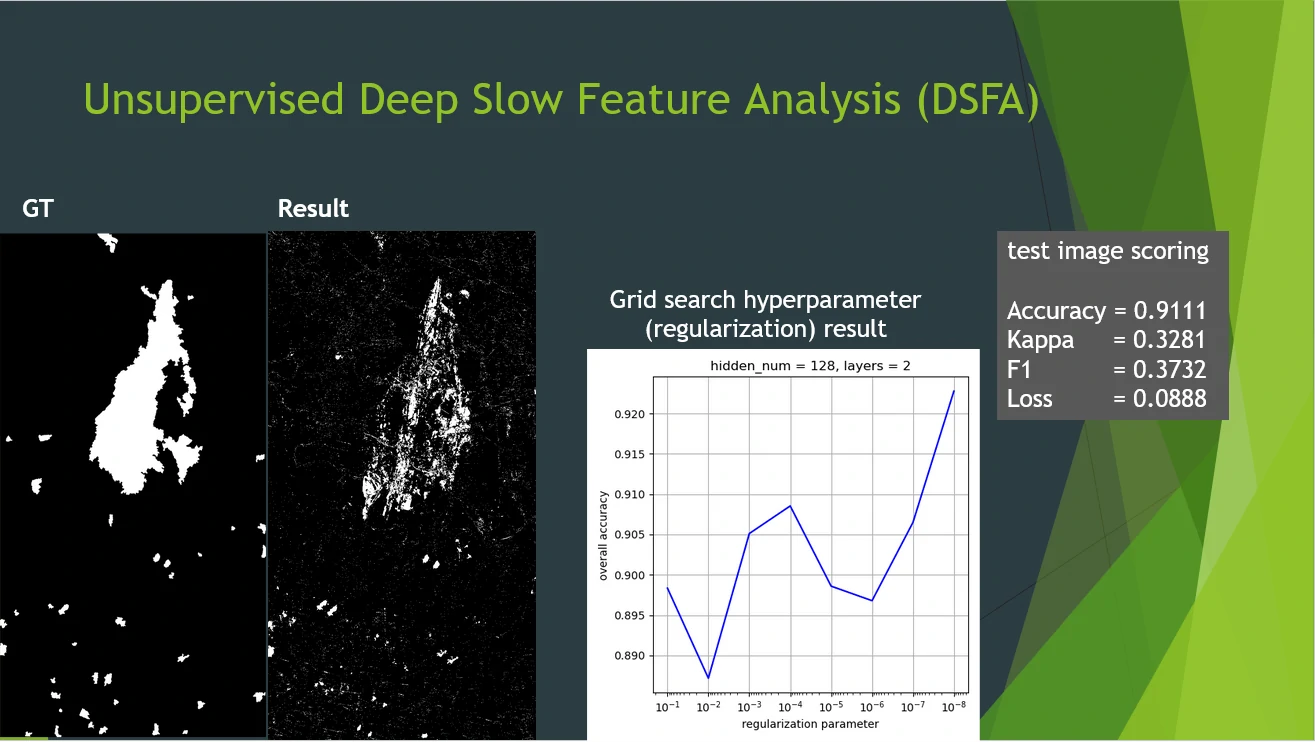
Image transformation methods - Unsupervised Deep Slow Feature Analysis
This algorithm requires the following Hyperparameter parameters:
- train_num (
int): default value 2000, total training pixel - max_iters (
int): default value 2000, total iteration in neural network - Learning rate (
float): default value 1e-4, learning rate for Gradient Descent Optimizer - hidden_num (
int): default value 128, total hidden node in single neural network - layers (
int): default value 2, total layer in single neural network - reg (
float): default value 1e-4, DSFA regularization parameter
Result
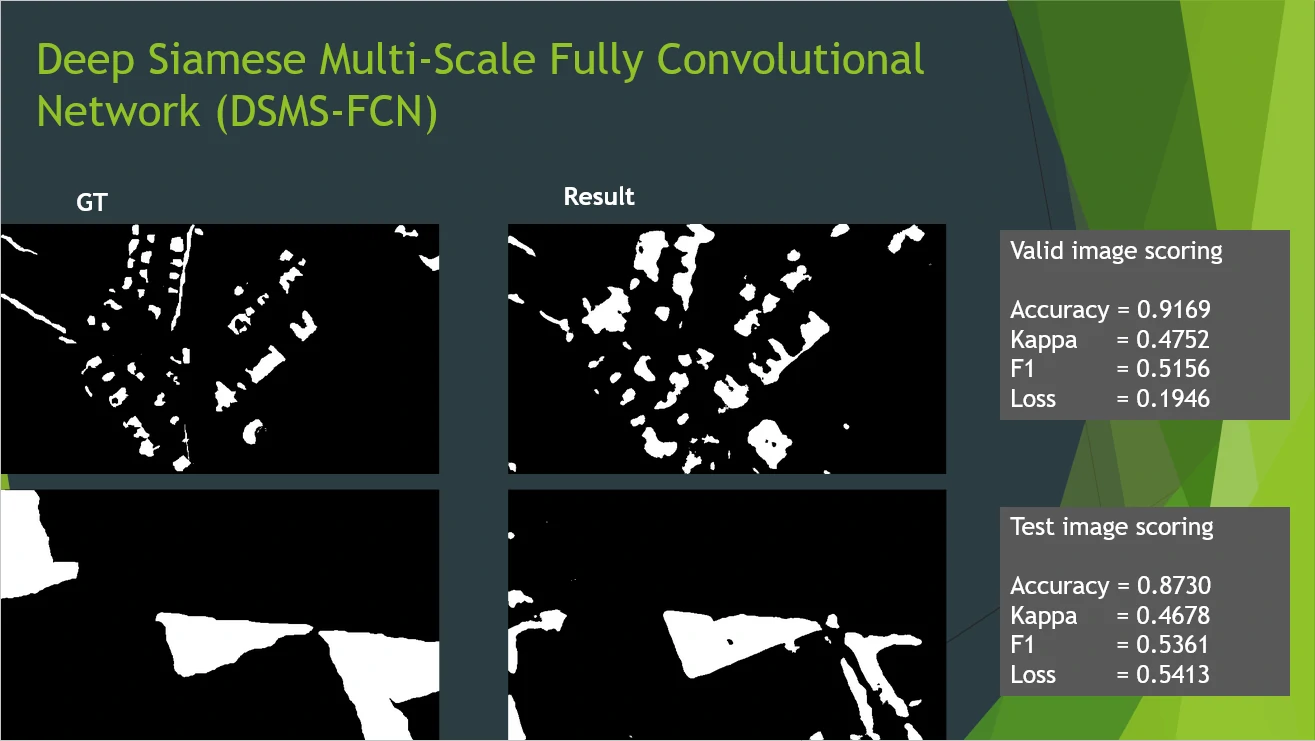
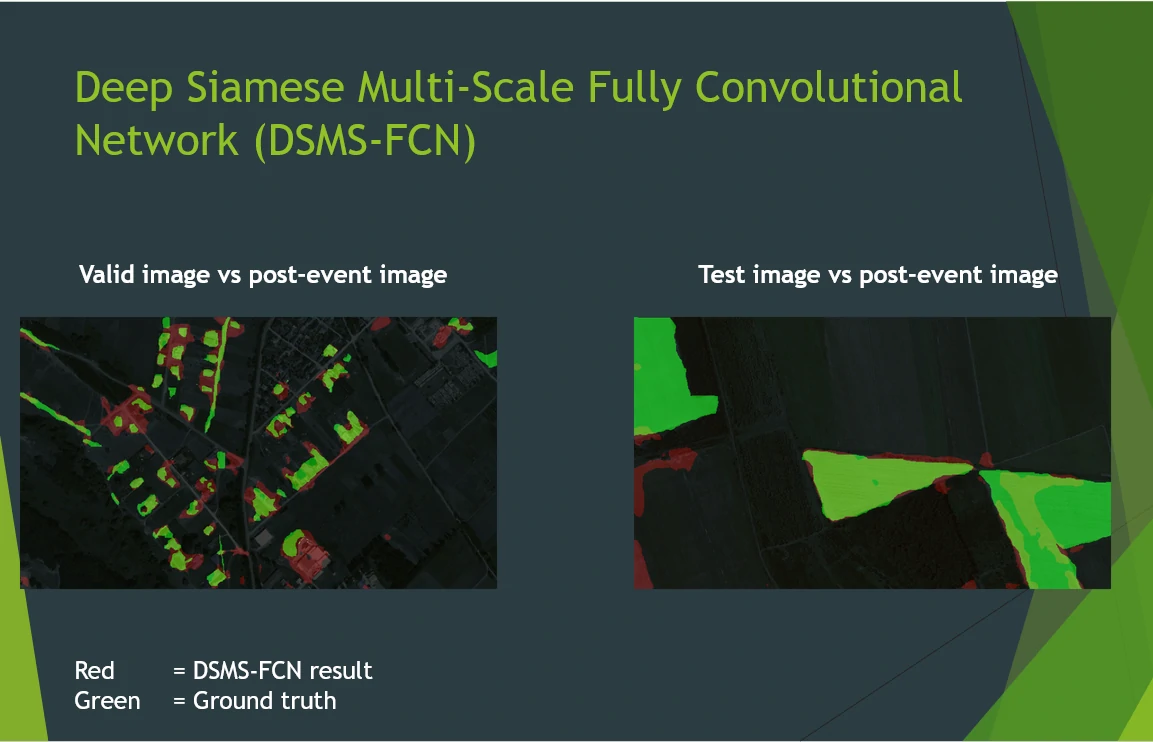
Classification methods - Deep siamese multi-scale fully convolutional network
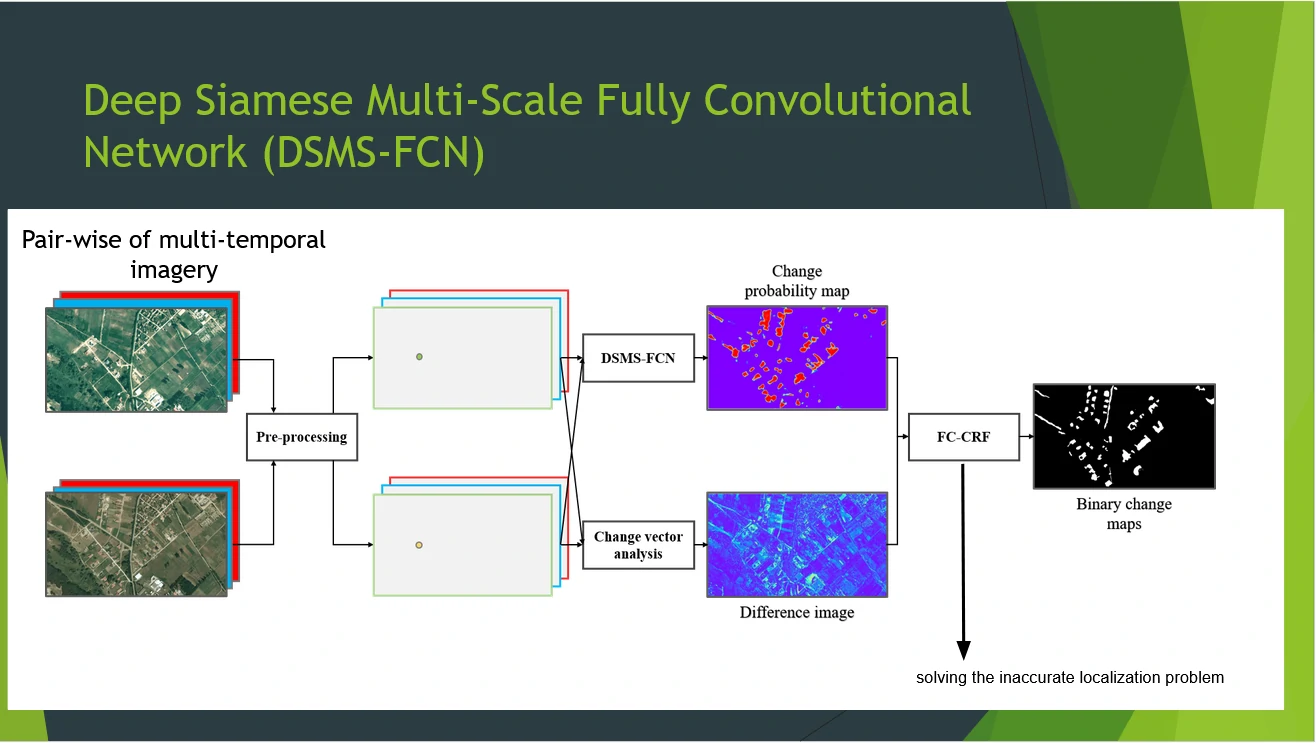
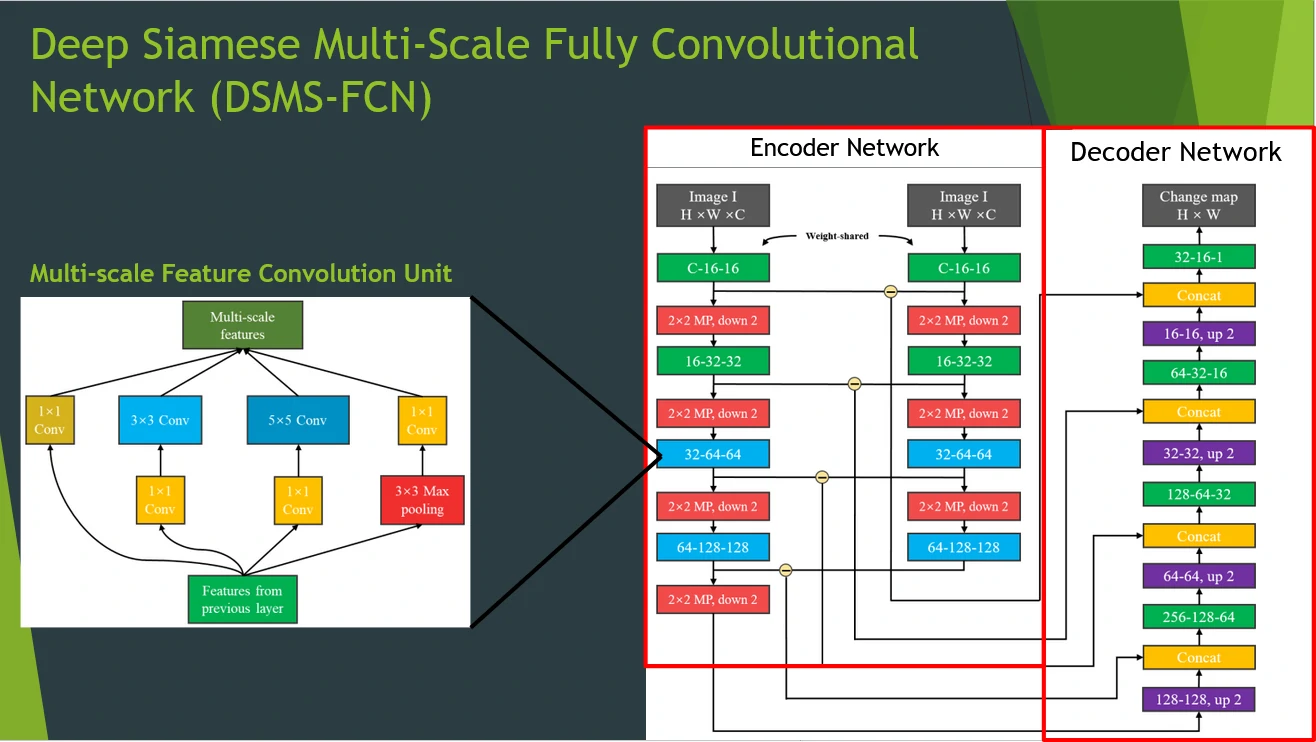
This algorithm requires the following Hyperparameter parameters:
- BATCH_SZ (
int): default value 512, batch size of training data that will input to neural network - LEARNING_RATE (
float): default value 2e-4, learning rate for Adam Optimizer - MAX_EPOCH (
int): default value 100, max iteration
Total parameter in training process = 768129
Result
Could those methods be integrated with ArcGIS products?
yes, those methods could be integrated with ArcGIS product because the requirement of those methods already implements in the ArcGIS PRO with python. i.e. :
| Library that used | Image type that used |
|---|---|
| Matplotlib Numpy Scipy Tensorflow Skimage Sklearn | All extension image / database that can be convert into a 3D-array (or more) .webp .jpg .tiff .hdr .mat (Microsoft Access Table Shortcut file) ESRI Shapefile .geojson |
What we can do for next
- We can train those methods with other dataset to analyze their performance with difference dataset
- Explore and compare other algorithms to find the best and more efficient method.
- Combine change detection algorithm with Land Cover Classification algorithm in deep learning (i.e. In Land Cover Classification in ArcGIS PRO: https://www.arcgis.com/home/item.html?id=47631bf61aad46ae90f91f80707c129c ) to get more information about what kind of land has been change before and after event.
- Create semi-supervised learning method. This method will combine an unsupervised and a supervised learning method. it means that we can use unsupervised learning result as the ground truth and apply it for supervised learning. This combination is unique because we can reduce human activity in pre-processing data (such as create ground truth as a label data that usually rare in remote sensing problems.
reference
- https://docs.google.com/presentation/d/1LlCJJZFn4hzh2htD__HmwQUrwCQYr3D2/edit?usp=sharing&ouid=102668057335838764715&rtpof=true&sd=true