Optimizing Cross-Docking Location Through Heat Map Analysis
geospatial
map
heatmap
Introduction
In the rapidly evolving landscape of logistics, the efficiency of last-mile delivery has become a critical factor in maintaining competitive advantage and customer satisfaction. By using direct shipping from distribution centers to individual buyers, leading to increased costs and extended delivery times, particularly in densely populated or geographically dispersed areas.
To address these challenges, our team has developed a data-driven tool designed to analyze and visualize the distribution of buyers, potential buyers, and transaction data across specific regions.
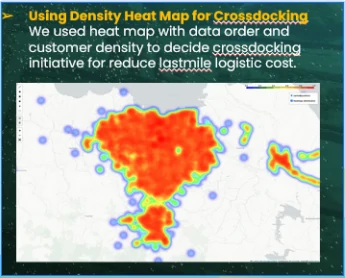
By leveraging this tool, we can generate heat maps that pinpoint high-density areas of demand and transaction volume, offering valuable insights into where logistical improvements can be made. By utilizing heat maps, we can more accurately identify optimal Cross-Docking that align with buyer and transaction concentrations. These identified zones can then be pursued as cross-docking locations to optimize last-mile logistics.
Objective
The primary objective of this doc is to demonstrate how our tool's heat map analysis can inform and optimize cross-docking decisions. By identifying the most strategic Cross-Docking, we aim to significantly reduce last-mile delivery costs while maintaining or even improving service levels.
Schema
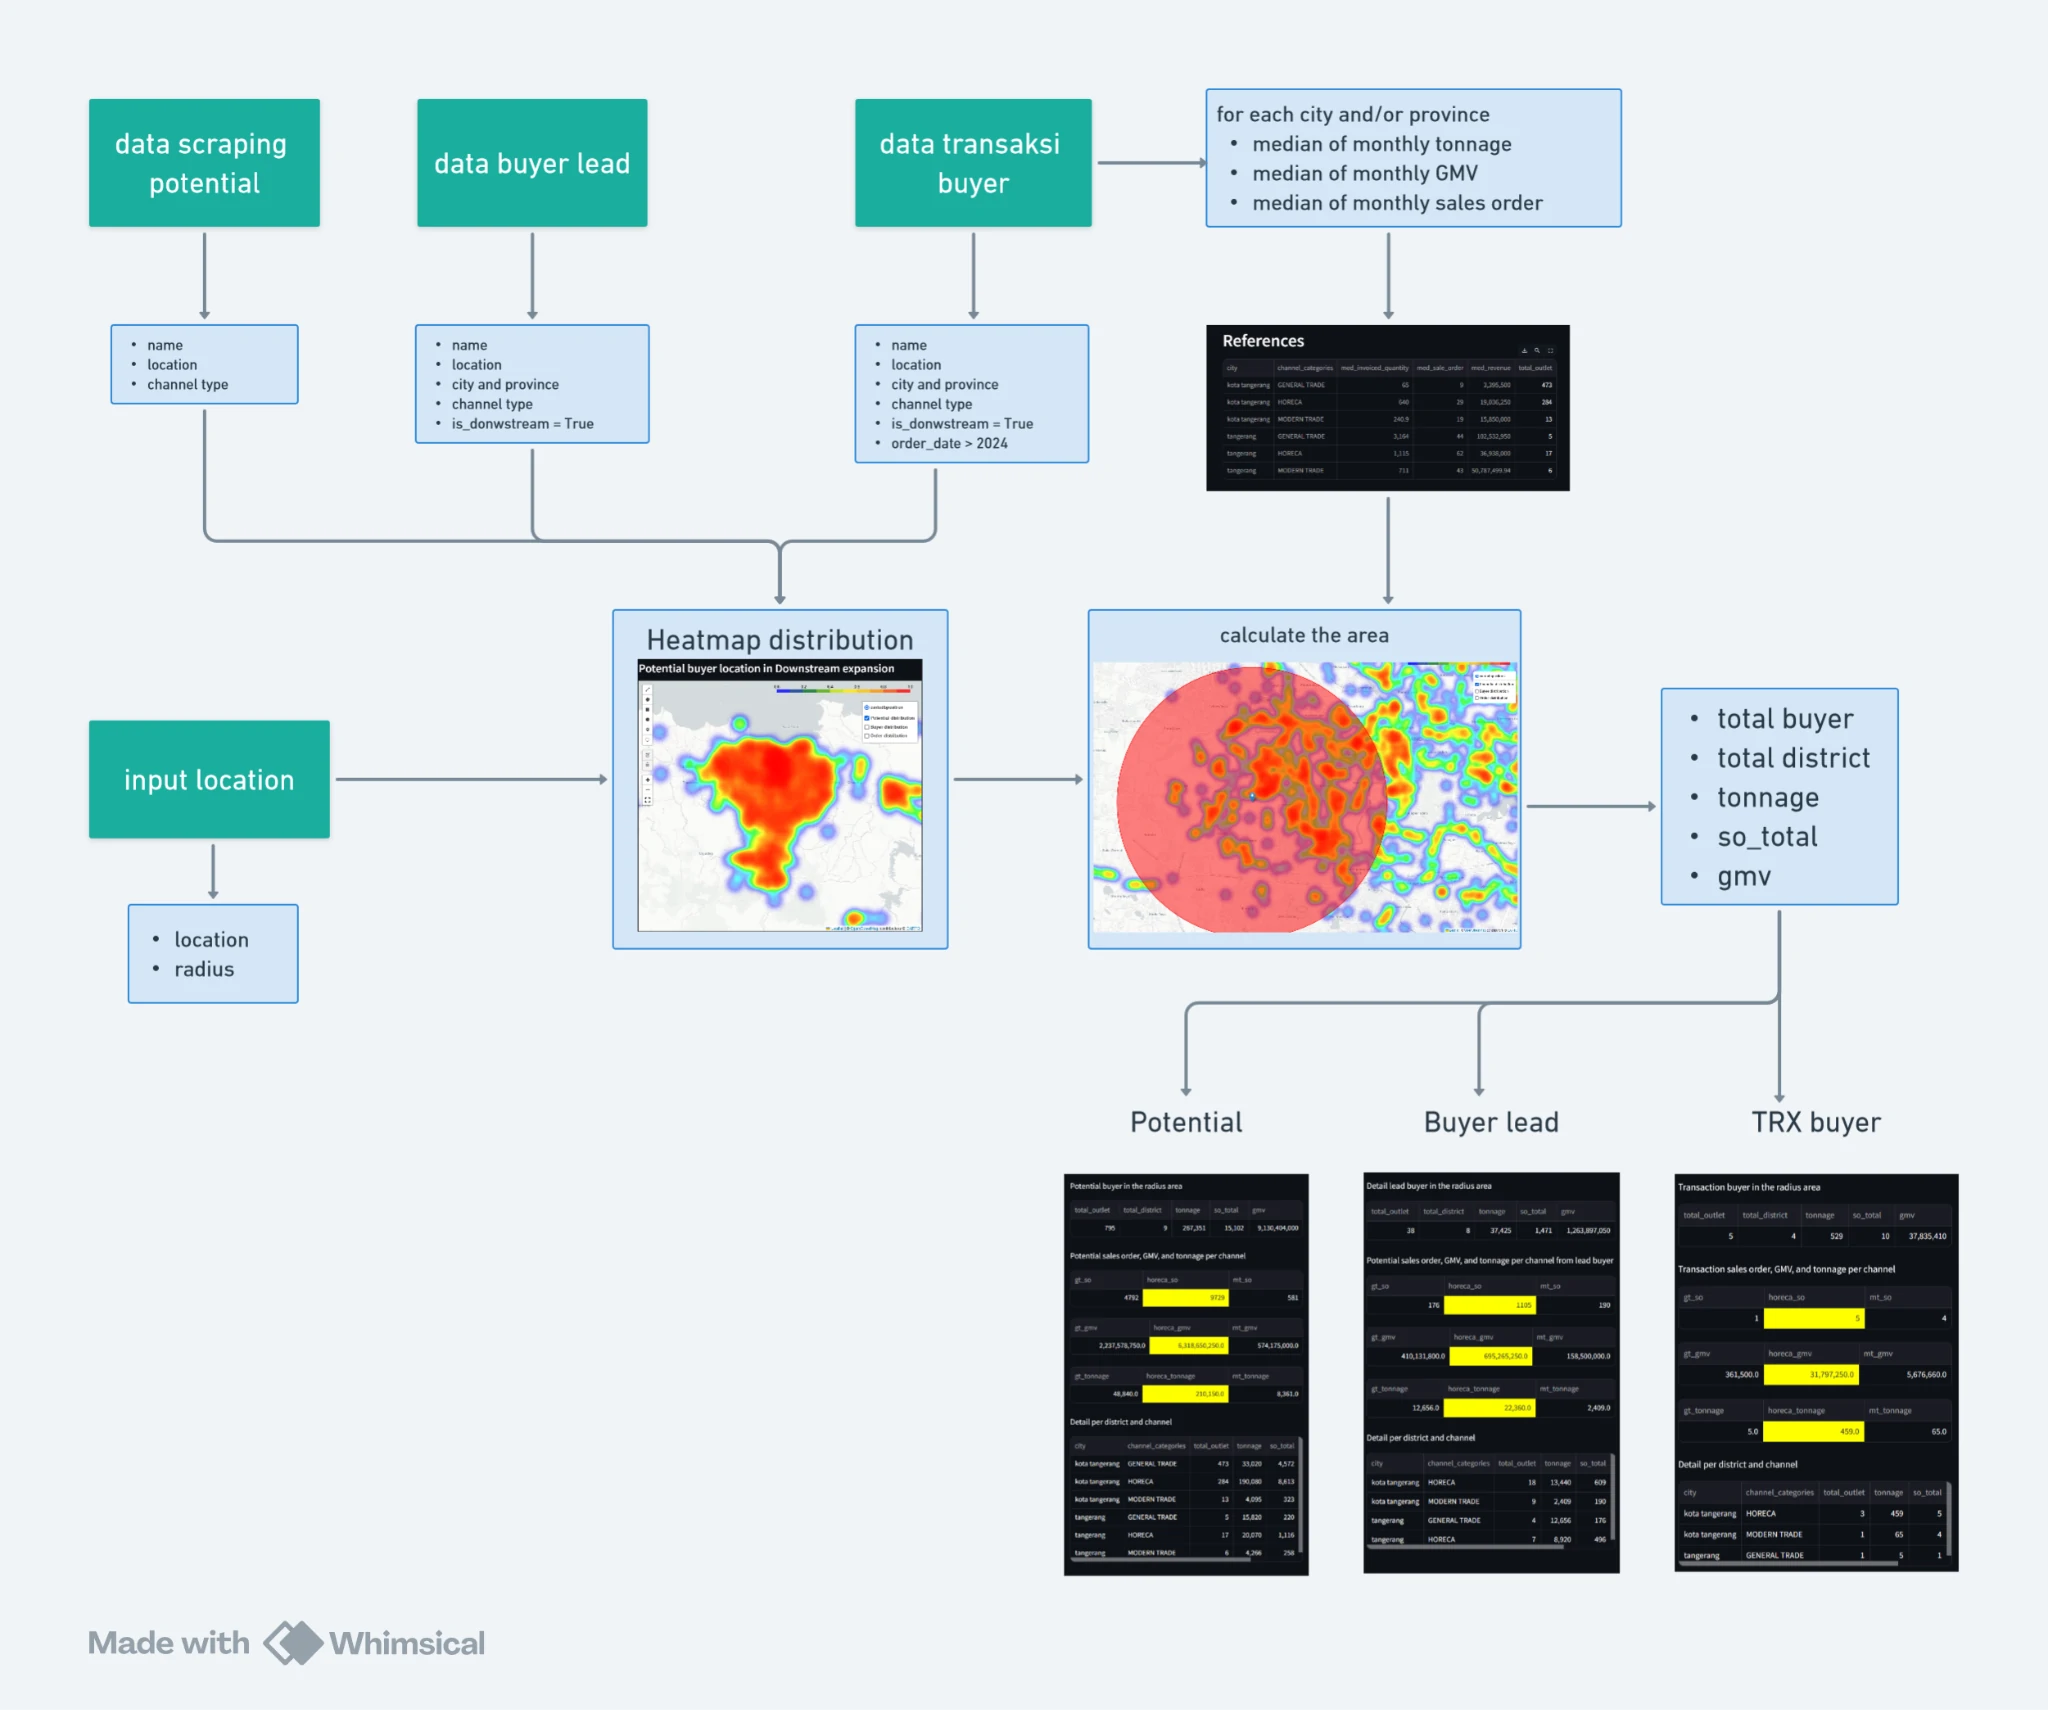
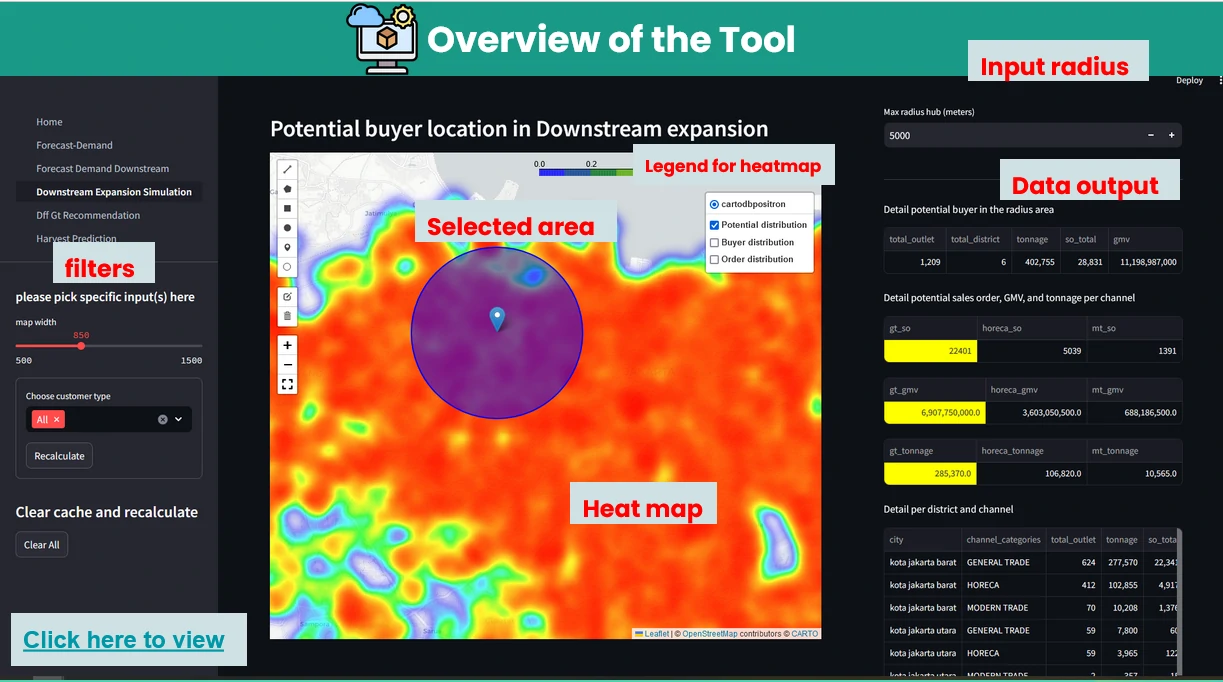
Overview of the tool
Dataset - Potential customer
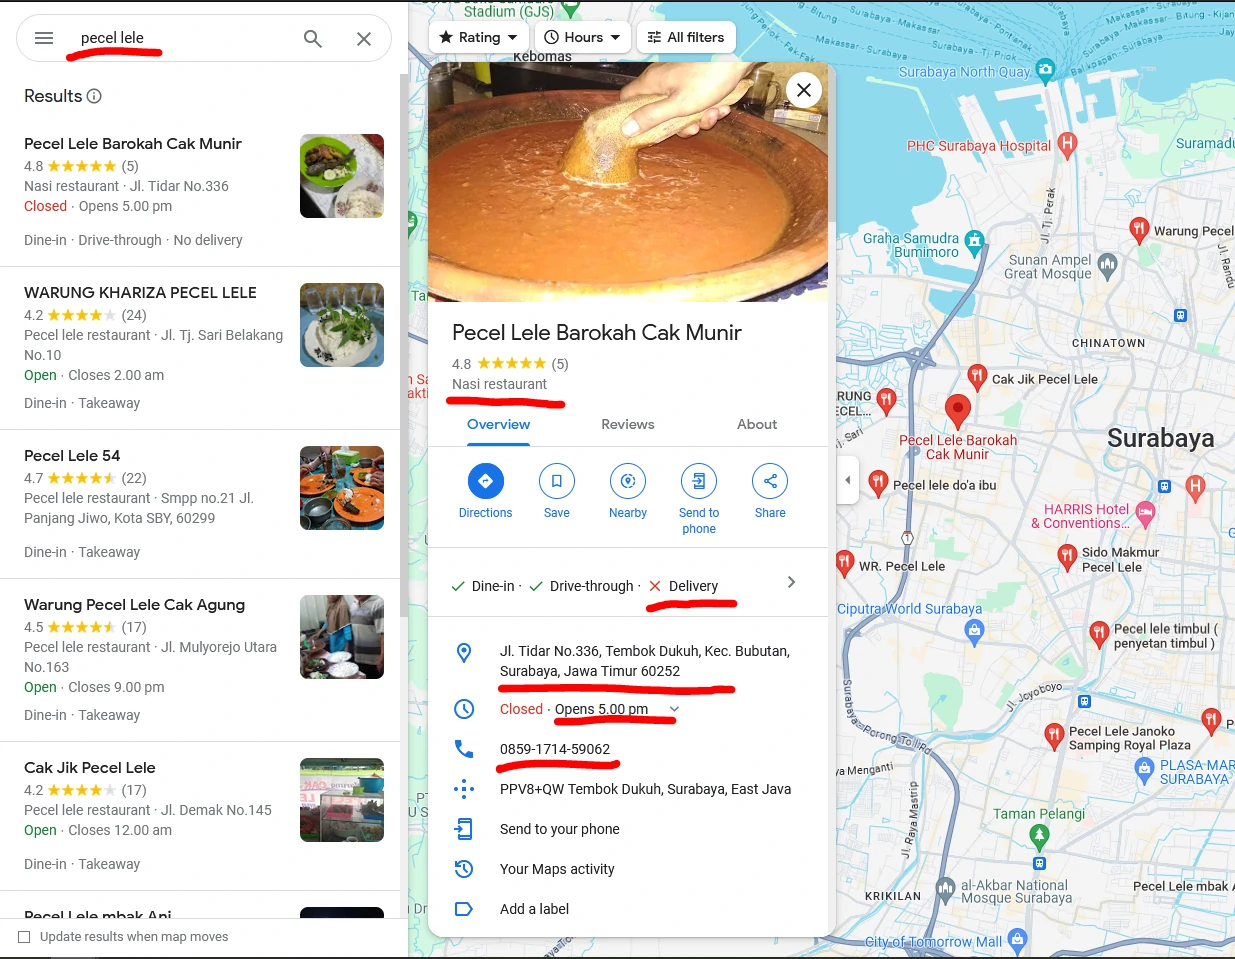
We aggregate potential data from Google Maps by targeting specific customers, locations, and keywords. By identifying the business type through Google Maps, we classify them into three channel types:
- General Trade
- Modern Trade
- Horeca
Once all data is collected, we estimate metrics such as tonnage, sales orders, and GMV using historical data specific to each city and channel type.
The median monthly values are then determined as the estimation benchmarks for each parameter. We also use this estimation benchmarks for buyer leads data.
Heat-Map Result
By comparing these three heatmaps (Potential data, Registered data, Transaction data), we can identify the most strategic Cross-Docking based on three key parameters:
- Areas with future growth potential and opportunities for generating additional demand.
- Geographic locations where sales demand is concentrated.
- Regions with a high level of current business activity.
Additionally, these maps can serve several other purposes, such as:
- Differentiating areas with frequent low-volume transactions from those with fewer high-volume transactions to inform logistical planning.
- Determining which areas to prioritize if we aim to maintain current transaction levels, potentially reducing delivery distances and times.
- Spotting regions with high transaction volumes occurring away from dense buyer areas for potential strategic initiatives.
- Identifying areas where we have a higher concentration of buyer leads compared to others, and understanding the reasons behind it.
- Recognizing patterns in the distribution of our buyer leads.
- Combining this data with customer segmentation and behavior (e.g., new, retention, churn) to pinpoint areas where we should focus our outreach efforts.
- Detecting high-potential buyer densities or high-transaction buyer densities that may not align with current buyer distributions.
- Identifying regions suitable for expansion or targeted marketing campaigns.
Heat-Map with Analysis of matrices
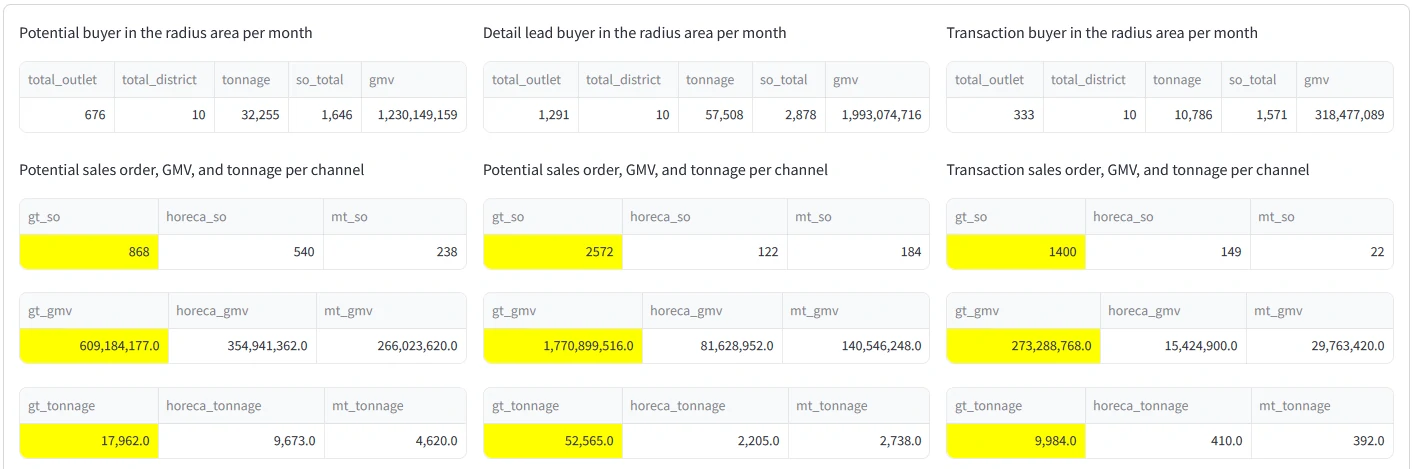
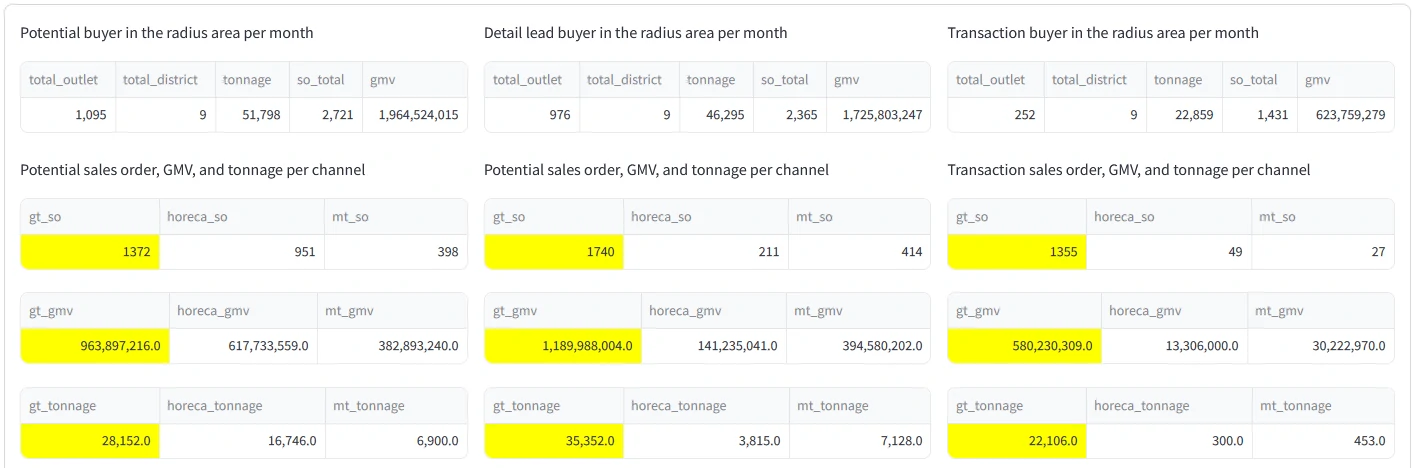
In addition to the heatmap visualizations provided by this tool, we can perform a deep dive analysis of tonnage, GMV, and sales orders within the identified regions. By leveraging these visualizations and analytics, we can discuss and assess the logistical implications. In example: particularly in high-volume areas within a 5 km radius of selected points of interest:
- The number of potential buyers, buyer leads, and transactions
- The distribution across different channel categories
- Identifying the direction of the highest concentration of buyers near this point.
- Analyzing and comparing key metrics within the radius area, including: Tonnage, GMV, Sales orders
- Detailed analysis of the above metrics by channel category (GT, MT, HoReCa) and/or by kabupaten or city within the radius.
- Using historical data to estimate the potential market size within the radius.
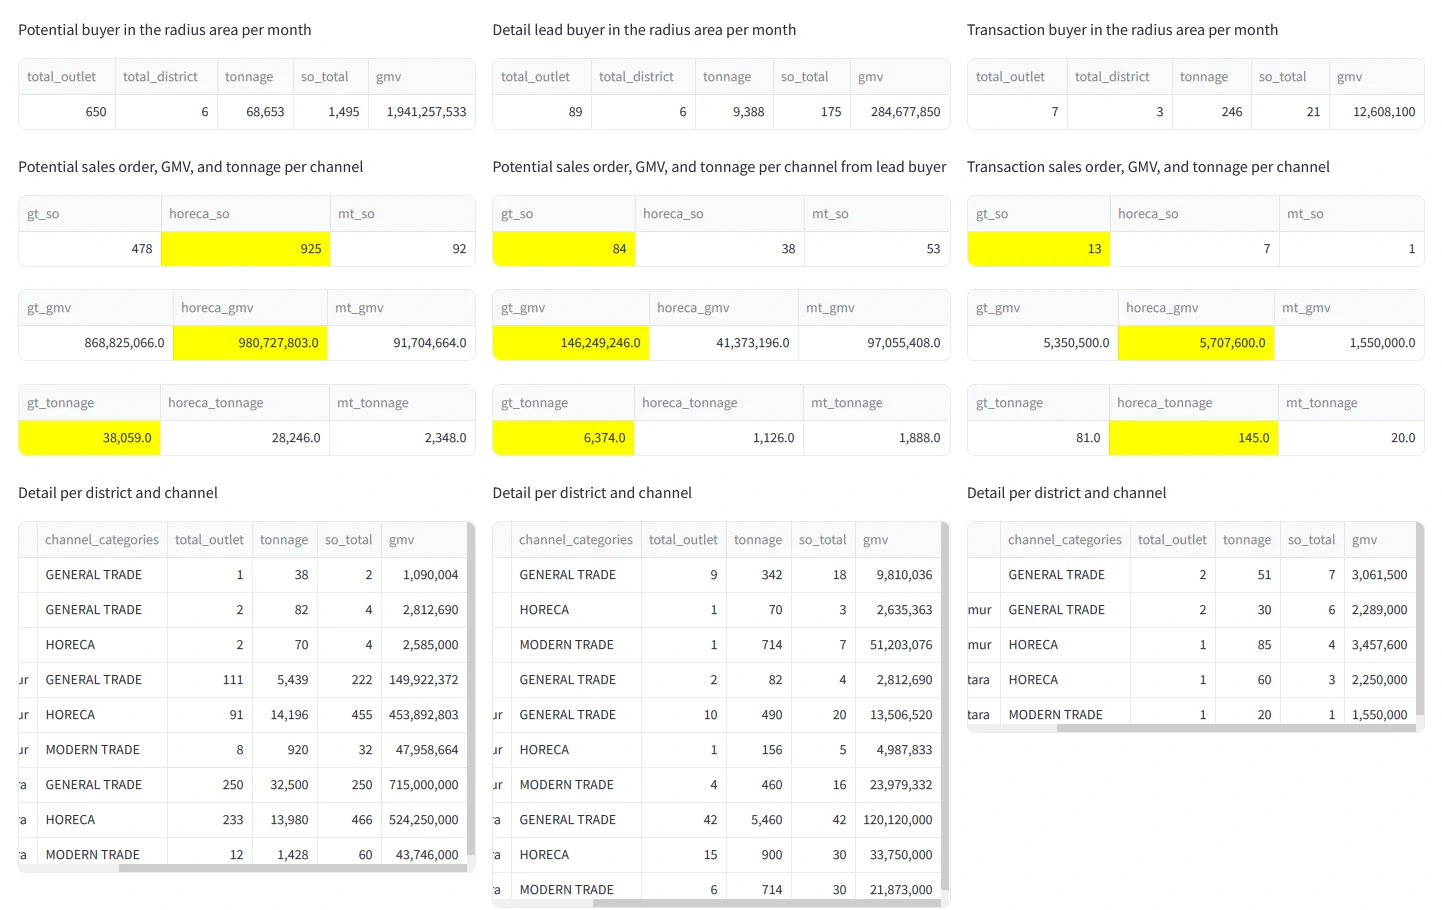
As shown in the table above, we can measure the number of potential and registered buyers, the required tonnage, GMV, and sales orders generated for each city and channel category. This insight is crucial for formulating a strategic plan for the area, from both business and logistics perspectives.
Comparing two points to get more insight and decision
With this tool, we can comparing 2 points that lead us to get more insight and better decision for cross-docking location.
East Jakarta
South Jakarta
Expansion
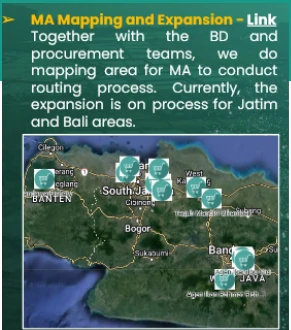
if we want to expand our business by establishing a new Cross-Docking in a high-potential area like Bogor. First, we need to identify regions with a high density of potential buyers, registered buyers, and areas with high order volumes. With this information, we can select the most optimal location for a Cross-Docking that would efficiently cover both existing transactions and potential buyers.
Bogor
West Jakarta
Surabaya
Bali
Bekasi
Key Takeaways
- This tool and its visualizations allow us to gain deeper insights into the distribution of buyers, potential buyers, and transaction data across specific regions.
- Comparing three parameters—potential buyers, registered buyers, and transaction buyers—helps us identify areas with high and low buyer activity.
- Enables a better understanding of the potential market, retention opportunities, and areas with high transaction volume.
- Facilitates the calculation of key metrics for single or multiple points, providing a comprehensive view to determine optimal locations for Cross-Dockings or distribution centers.
- offering valuable insights into where business and logistical improvements can be made.
- Supports the initiation of cost-distance and cost-benefit analyses.