Use Case Descriptive and Diagnostic Analytics
descriptive analytics
diagnostic analytics
usecase
Business Understanding
Detail contexts for our analysis
Prior knowledge:
- Perusahaan yang bergerak di bidang Quick Service Restaurant.
- Memiliki 20 cabang yang tersebar di pulau Jawa.
- Di Tahun 2023 sampai dengan bulan Agustus penjualan mengalami penurunan.
Main goals:
- Apa saja analisa atau insight yang didapatkan dari data yang tersedia dari perspektif seorang data analyst?
- Rekomendasi apa yang bisa diusulkan oleh seorang data analyst terhadap management untuk memperbaiki kinerja penjualannya (Based on Analisa Data yang tersedia)
Data Understanding
Detail contexts for our analysis
Finding:
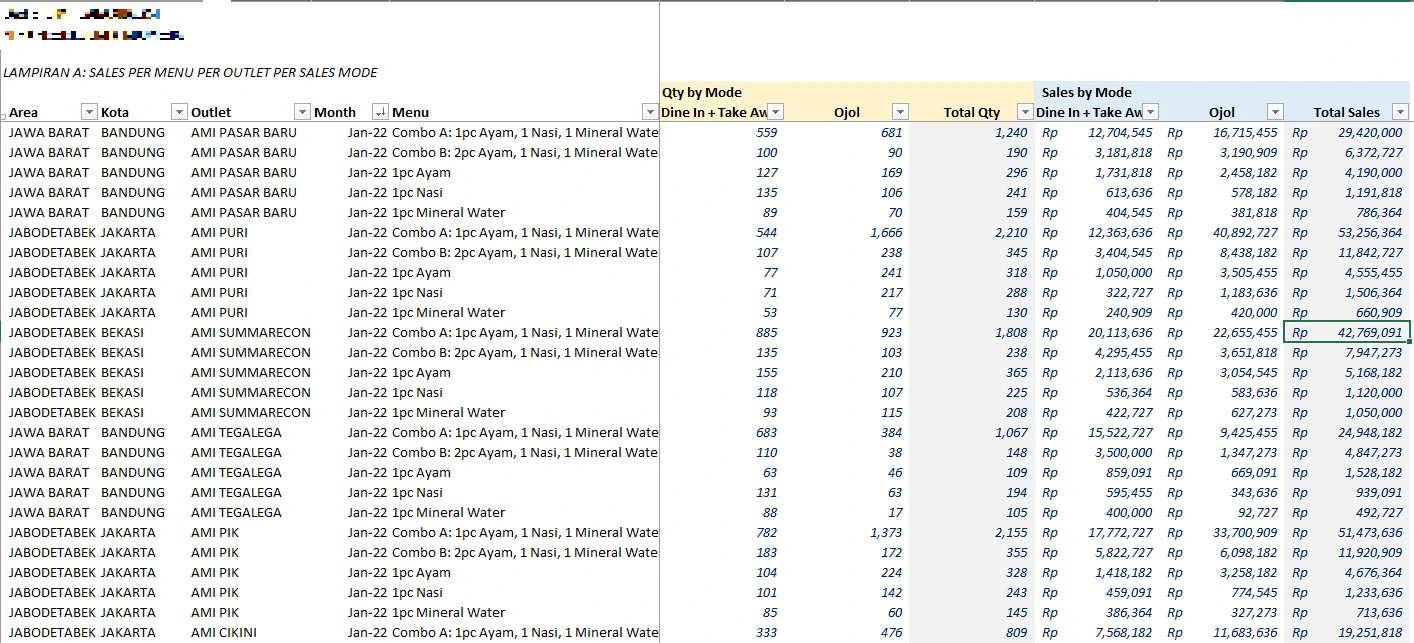
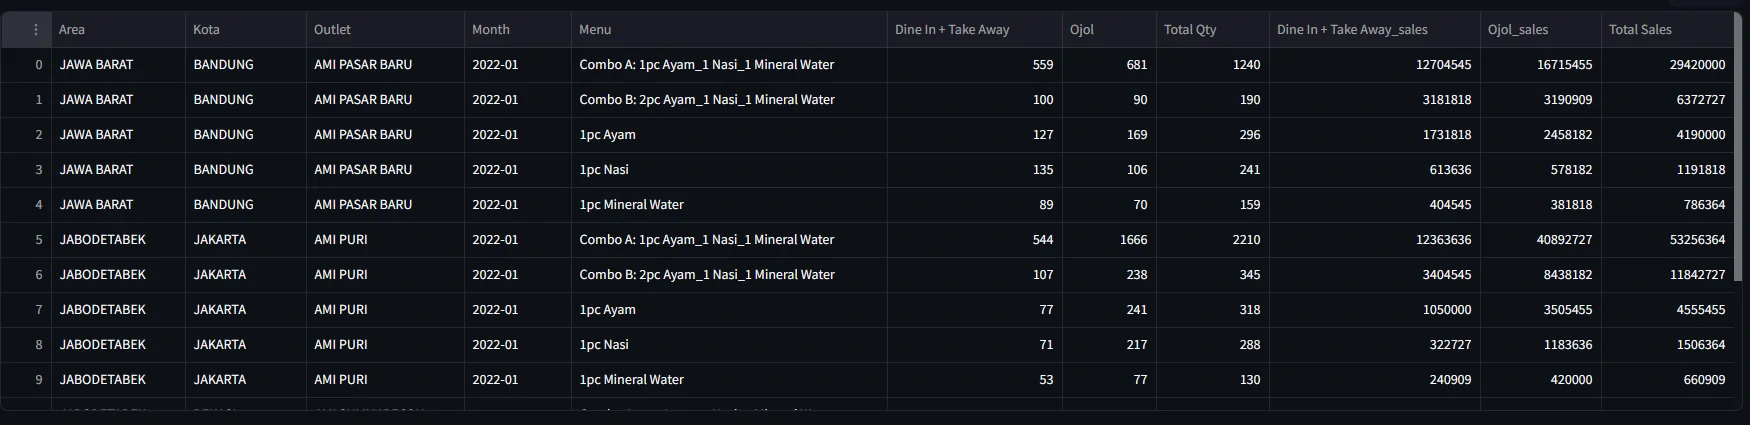
- The dataset is structured across key dimensions, including Area, City (Kota), Outlet, Month, and Menu.
- The dataset includes three primary numerical metrics: quantity sold, sales from dine-in and takeaway, and sales from third-party delivery platforms (Ojol). Each transaction is categorized by sales channel, enabling detailed channel-based performance analysis.
- Menu pricing appears to be standardized across outlets, as the sales-to-quantity ratio (i.e., unit price) remains consistent for each menu item. This will make easier for us to focus only for one of them.
Data preprocessing
To make it easier to ETL
To enhance compatibility with analytical tools and streamline data processing, we have:
- Converted the dataset into .csv format,
- Removed comma delimiters within numeric fields, and
- Cleared any Excel-specific formatting or styling.
Descriptive and Diagnostic Analytics
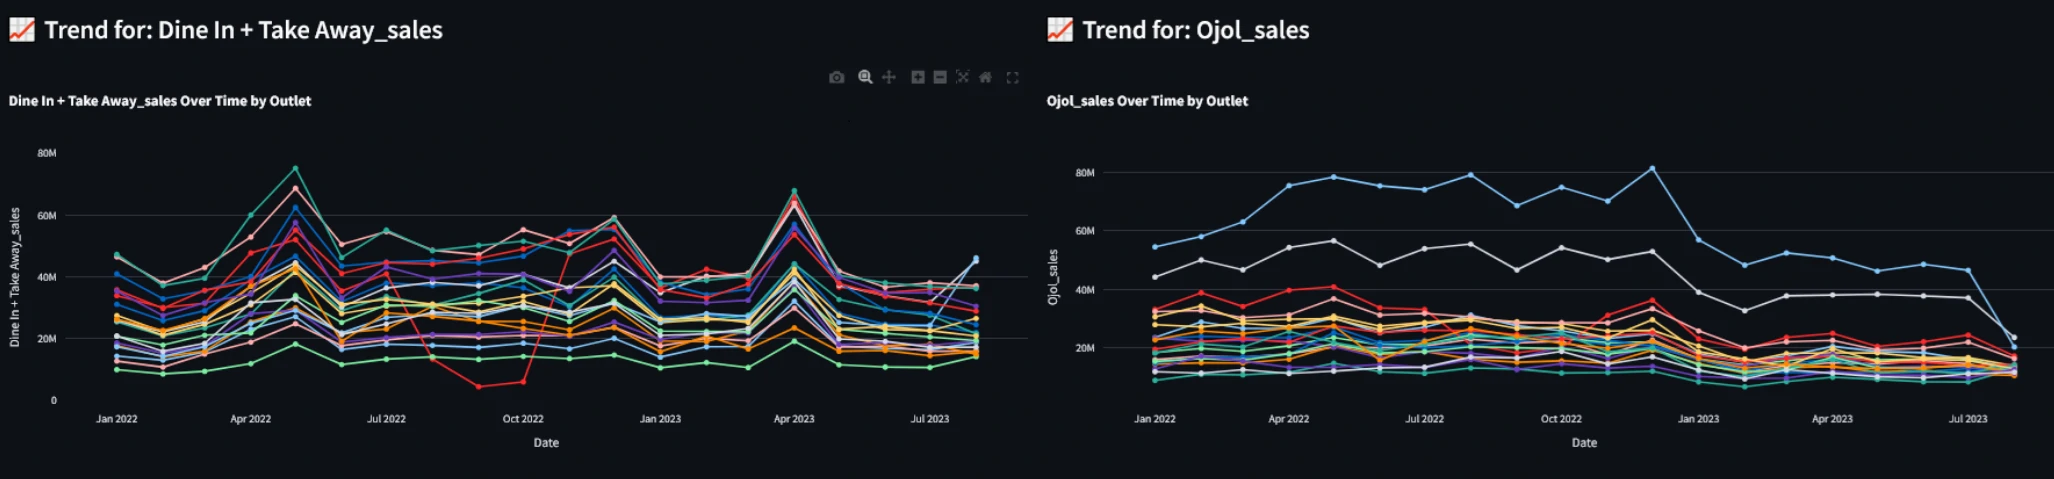
1. Recurring seasonal peaks and a notable low point each year
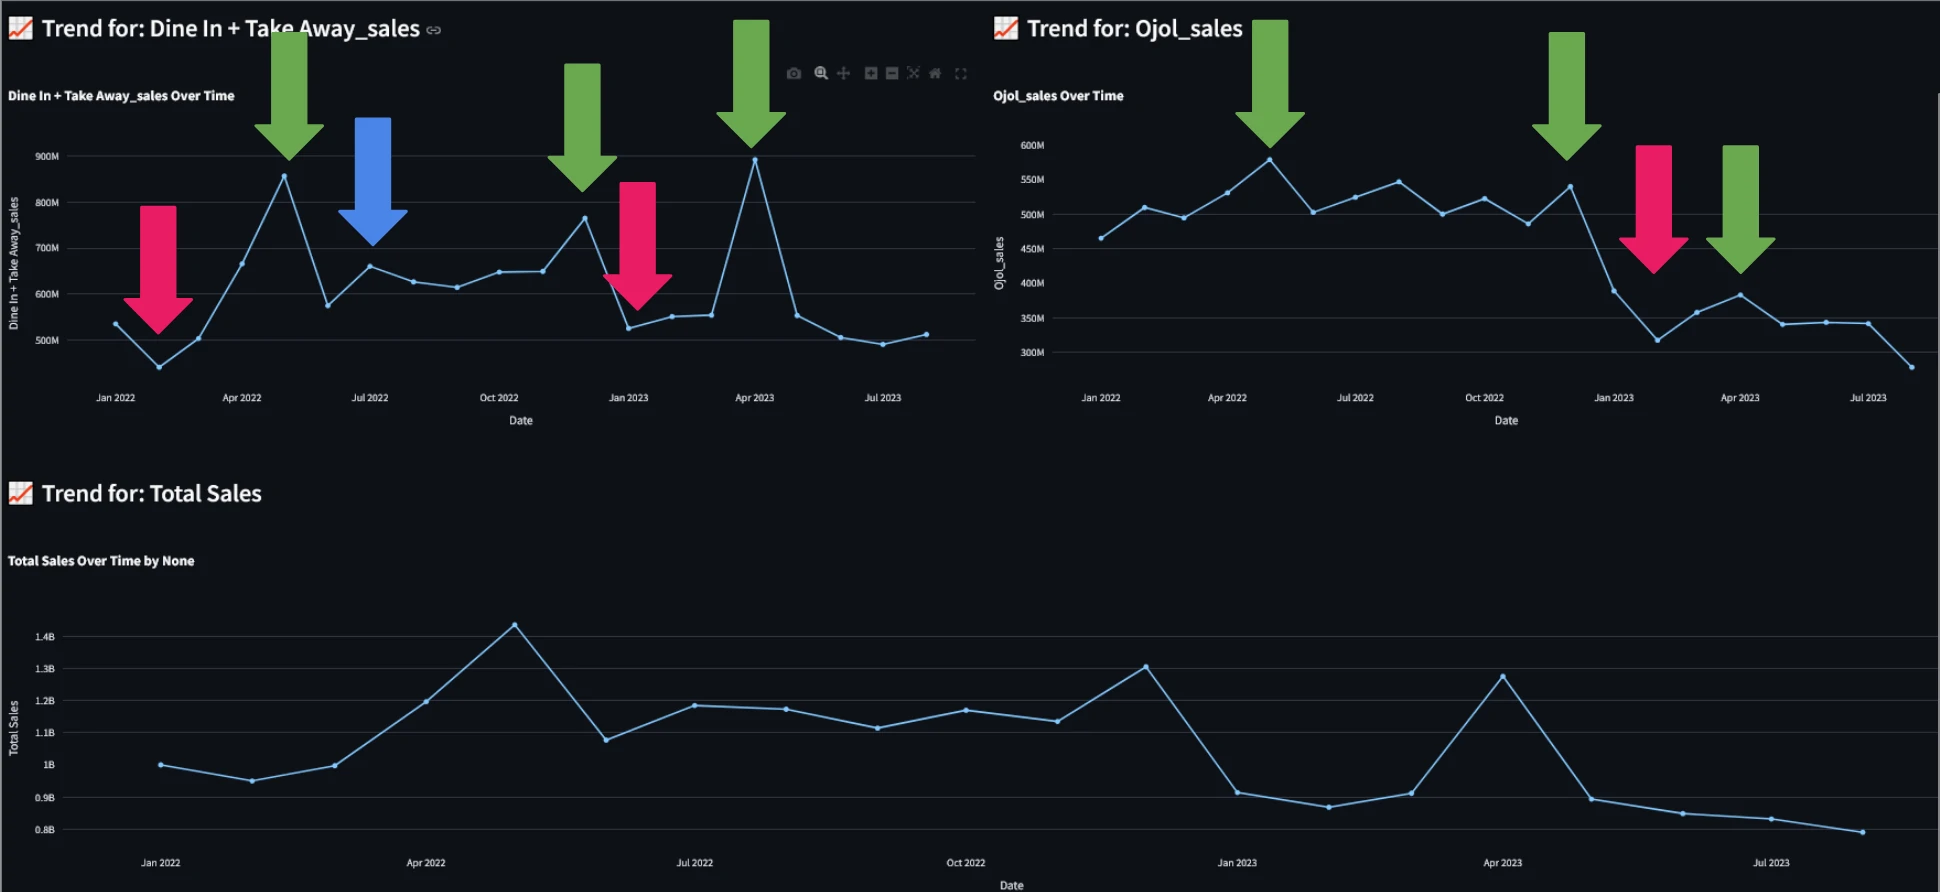
These patterns are particularly pronounced in the Dine-In & Takeaway channel, whereas the Ojol (delivery) channel shows less pronounced seasonality.
Peak Months: Aligning with key holiday periods.
- April: Corresponds with Ramadan and Idul Fitri, where there is a cultural tendency to dine out or break fast in groups.
- December: Reflects increased consumption during the Christmas and New Year holiday season.
Low Point in January:
- January consistently shows the lowest sales, especially within the Ojol channel at 2023, while Dine-In & Takeaway remain relatively stable. This post-holiday decline may reflect consumer fatigue, reduced mobility, or seasonal financial constraints — making it a key area for further investigation.
These insights suggest that:
- seasonal factors and holidays significantly influence in-store sales, while the delivery channel may be more vulnerable to sharp declines in off-peak periods, particularly in January. This presents a potential opportunity to build seasonal strategies and channel-specific recovery campaigns to mitigate post-peak drops._
2. Ojol channels show a consistent decline, dine-in and takeaway sales plateaued
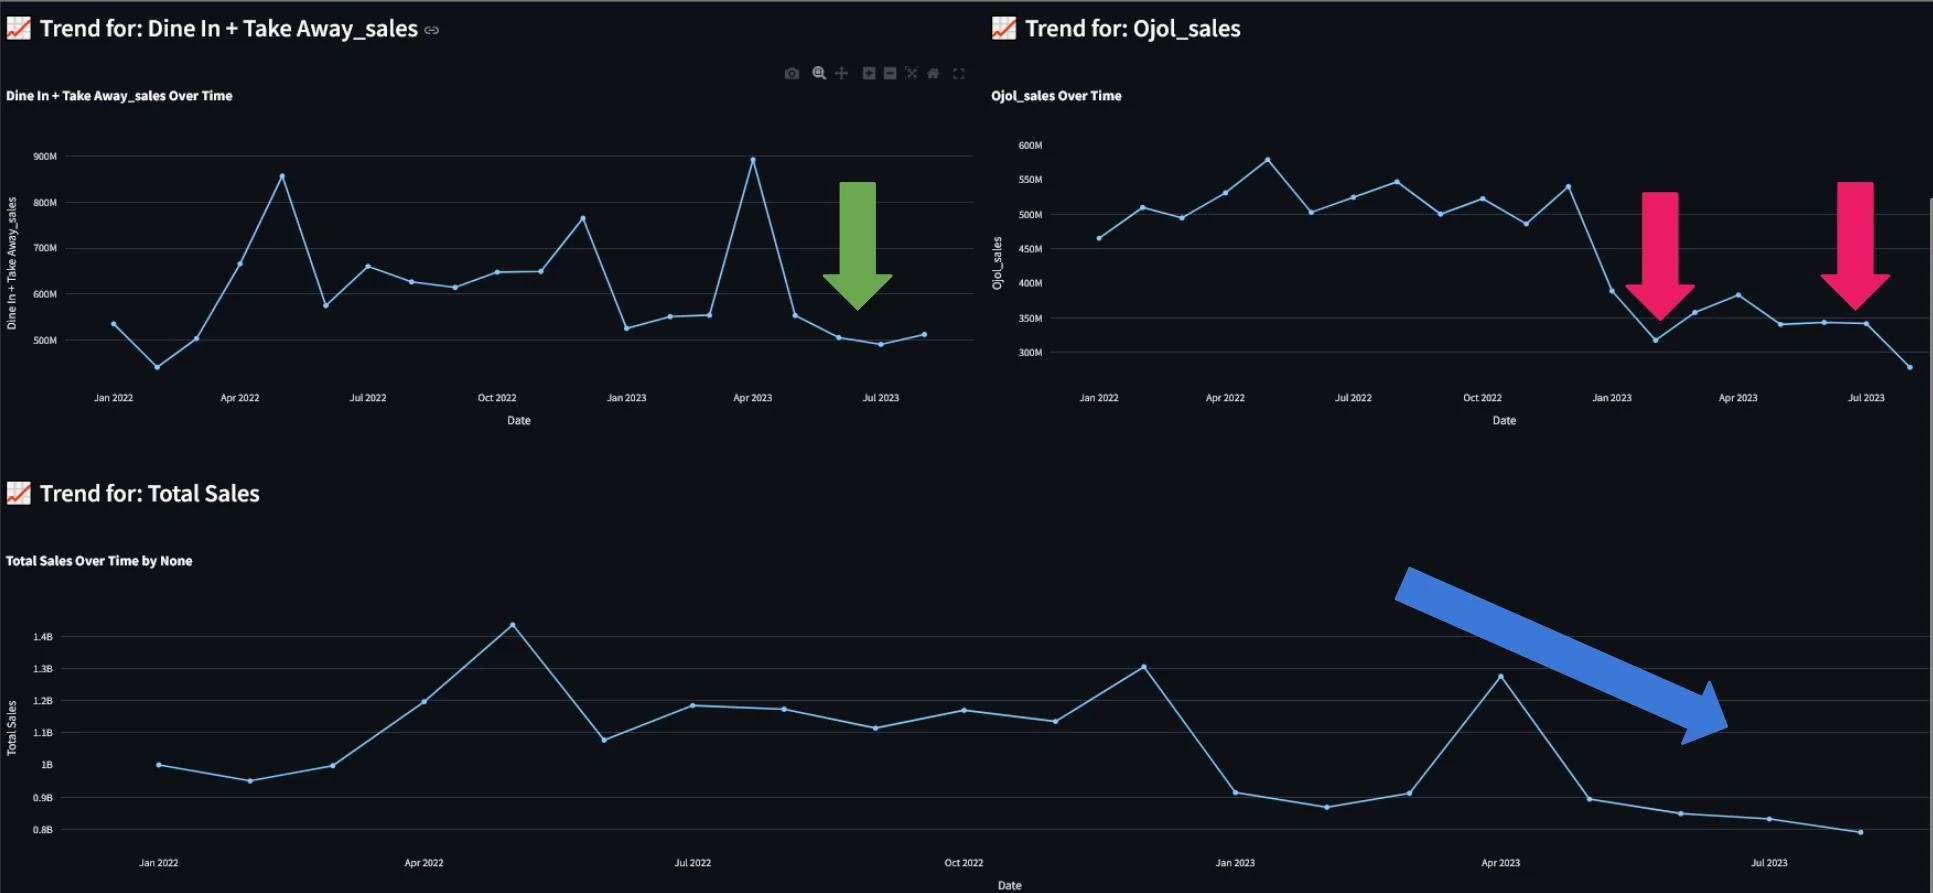
We visualized total sales over time and observed a clear downward trend throughout 2023 (refer to the chart on the left). Upon breaking down the data by sales channel, two key patterns emerged:
- Sales through Ojol channels show a consistent decline, with no recovery to even the minimum monthly levels recorded in 2022. (Red arrow)
- After April, dine-in and takeaway sales plateaued, showing no significant upward momentum. (Green arrow indicates this stagnation.)
As a result, the overall sales in 2023 remained below 2022 levels, primarily driven by the sharp and sustained drop in Ojol channel performance.
3. Drop in Ojol sales had a more substantial impact, and needs maintaining or revitalizing
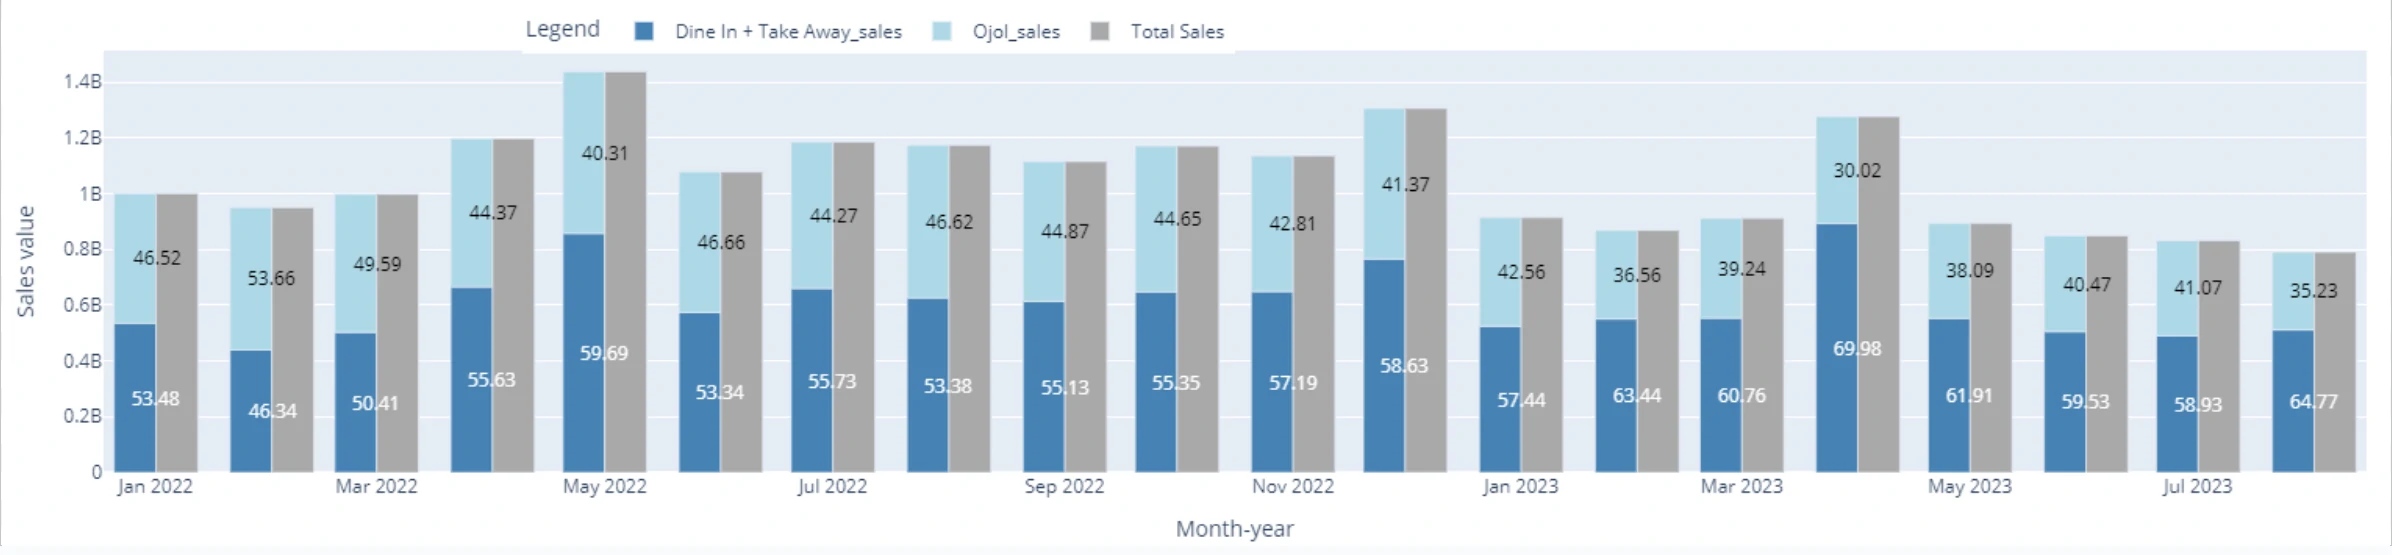
A direct comparison between sales channels reveals that the decline in total sales is primarily driven by the third-party delivery (Ojol) channel.
- Ojol Channel Share: The contribution of Ojol sales to total revenue dropped significantly—from approximately 45% in 2022 to 37% in 2023.
- Dine-In & Takeaway Share: In contrast, the dine-in and takeaway channel maintained a relatively stable contribution, slightly increasing from around 57% to 60%.
This analysis highlights that although both channels experienced stagnation, the drop in Ojol sales had a more substantial impact on the overall decline in total revenue. Maintaining or revitalizing Ojol channel performance will be critical to reversing the downward sales trend.
4. How channels and area categories give more insights
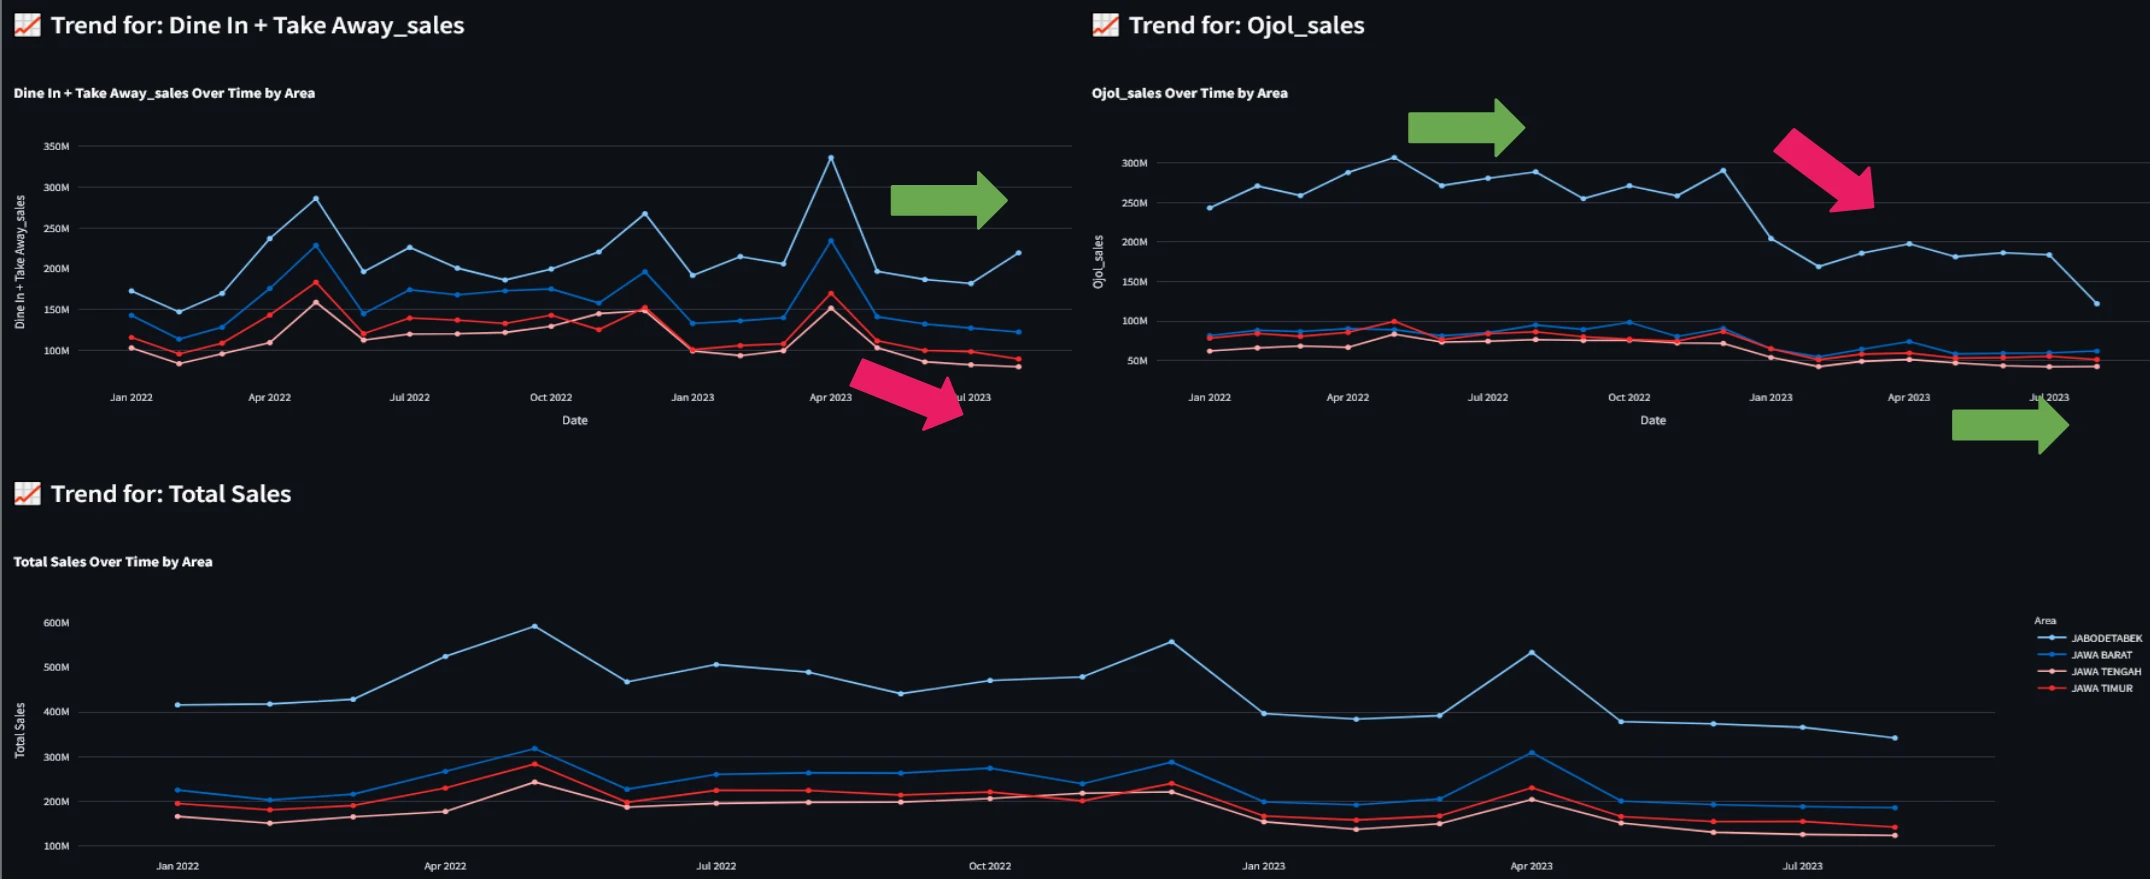
Jabodetabek Region
-
Dine-In & Takeaway: Sales in this channel have shown a plateauing trend, maintaining a relatively stable performance over time.
-
Ojol: In contrast, Ojol sales experienced a significant decline, diverging from last year’s relatively stable trajectory. This sharp drop is a major driver of the overall sales decline in the region.
Non-Jabodetabek Regions
- Dine-In & Takeaway: Sales show a gradual downward trend, though the magnitude of the decline is less severe than the Jabodetabek Ojol drop.
- Ojol: Similar to dine-in, Ojol sales also declined, but at a more moderate pace.
Key Insight
- The steepest decline is observed in the Ojol channel within Jabodetabek, indicating a potential saturation, behavioral shift, or increase in delivery service pricing.
- Non-Jabodetabek performance, while declining, shows less volatility, which may suggest either less dependence on Ojol or greater resilience in mixed-channel performance.
5. The issue is likely channel-specific, not related to product appeal or demand
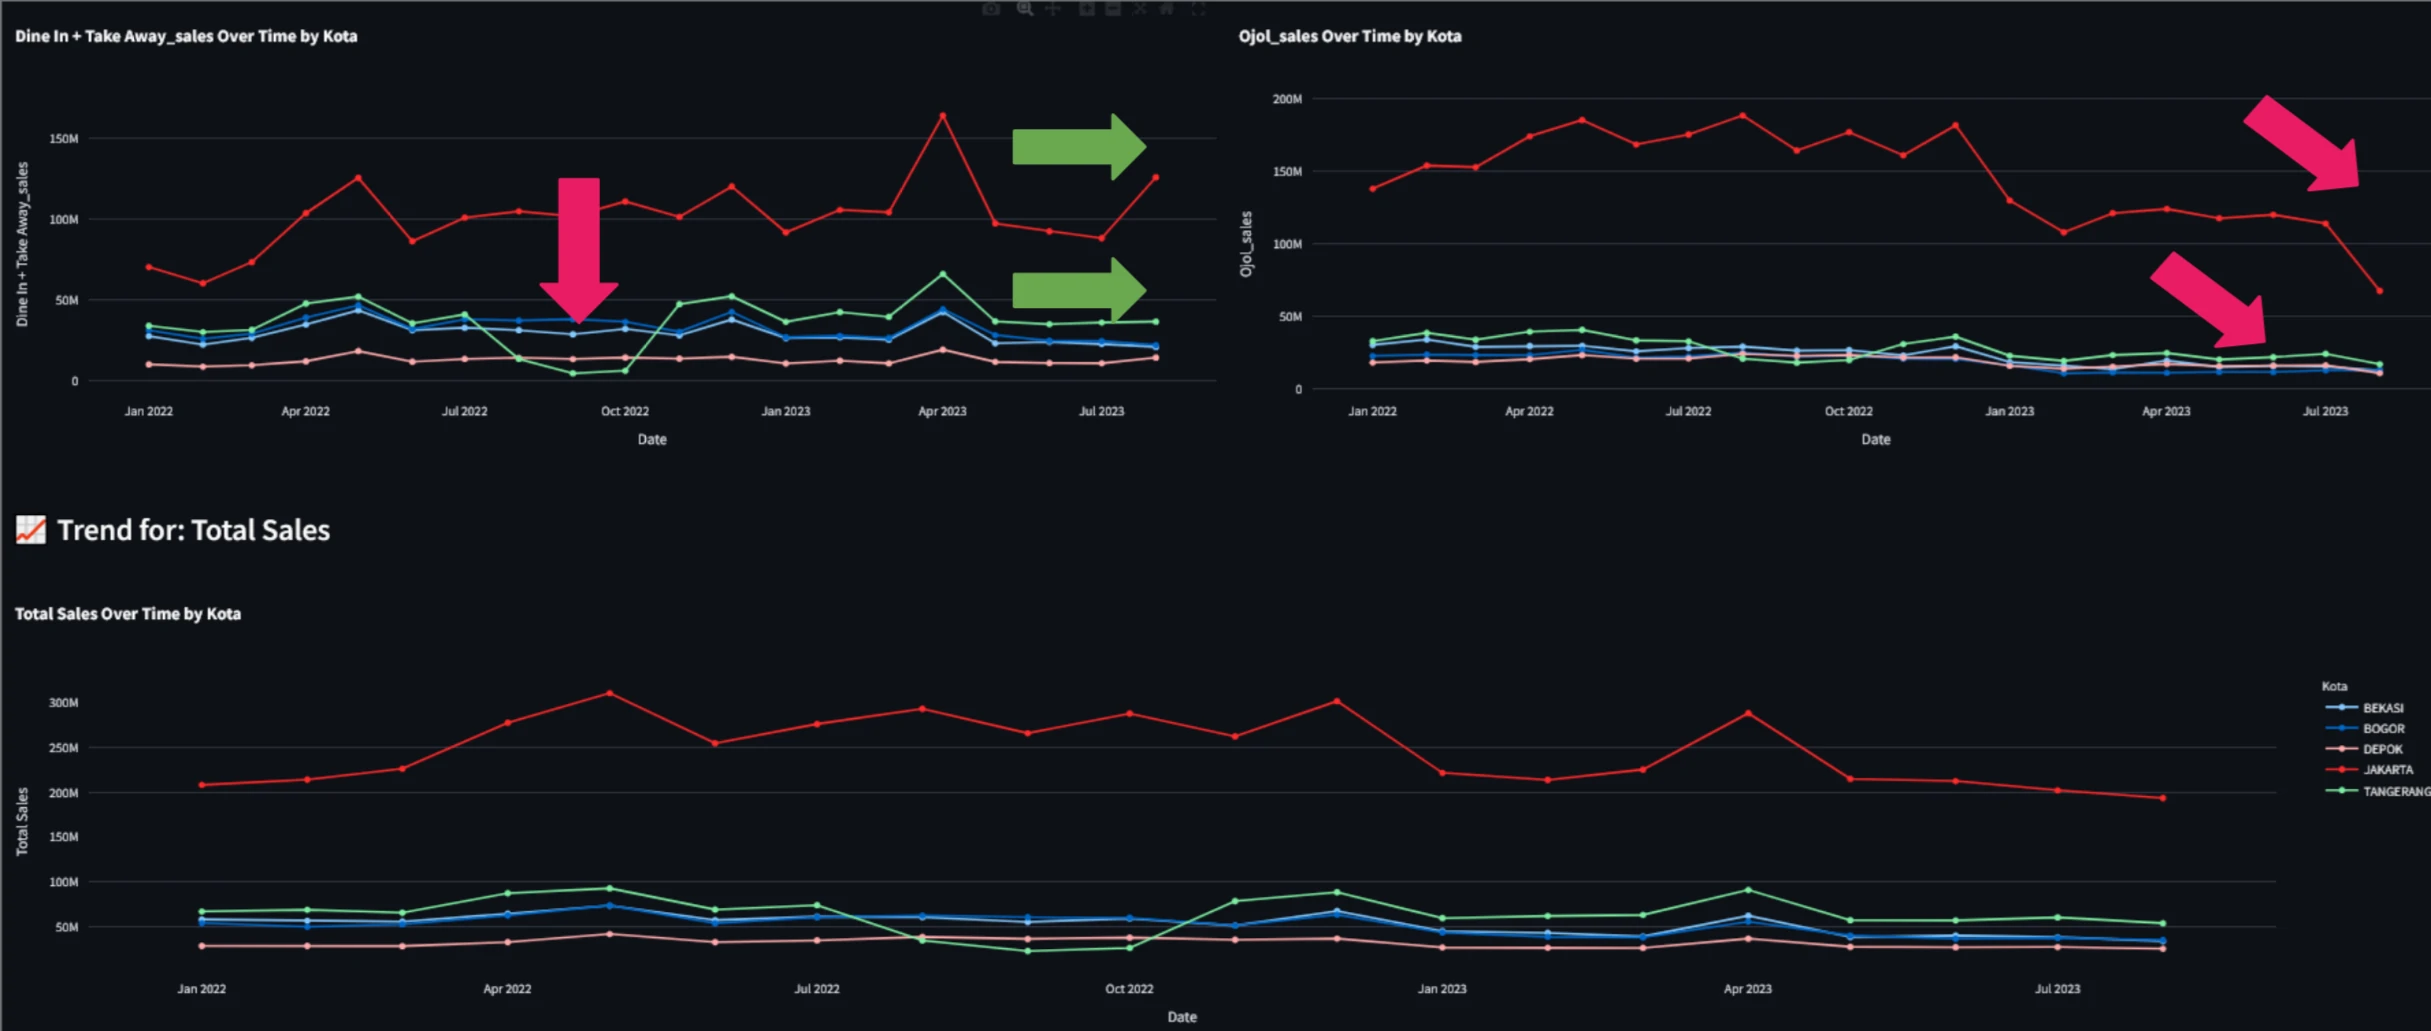
A more granular, city-level analysis within Jabodetabek reveals compelling insights about the performance and decline of sales across channels:
- Ojol Channel: The most significant decline is observed in Jakarta, where Ojol sales dropped sharply, contributing heavily to the overall sales downturn in the region. In other cities within Jabodetabek (e.g., Bekasi, Tangerang, Depok), Ojol sales also show a gradual downward trend, though with less dramatic impact than Jakarta.
- Dine-In & Takeaway Channel: Encouragingly, this channel has shown stable performance across all cities in Jabodetabek.
Key Insight
- Stability in Dine-In & Takeaway Channel, helps mitigate the impact of the ojol channel’s decline and indicates that the issue is likely channel-specific, not related to product appeal or demand.
- Special Observation: Tangerang. A sharp drop in total sales is evident in Tangerang during August and October 2022. This anomaly appears city-specific and outside the main pattern.
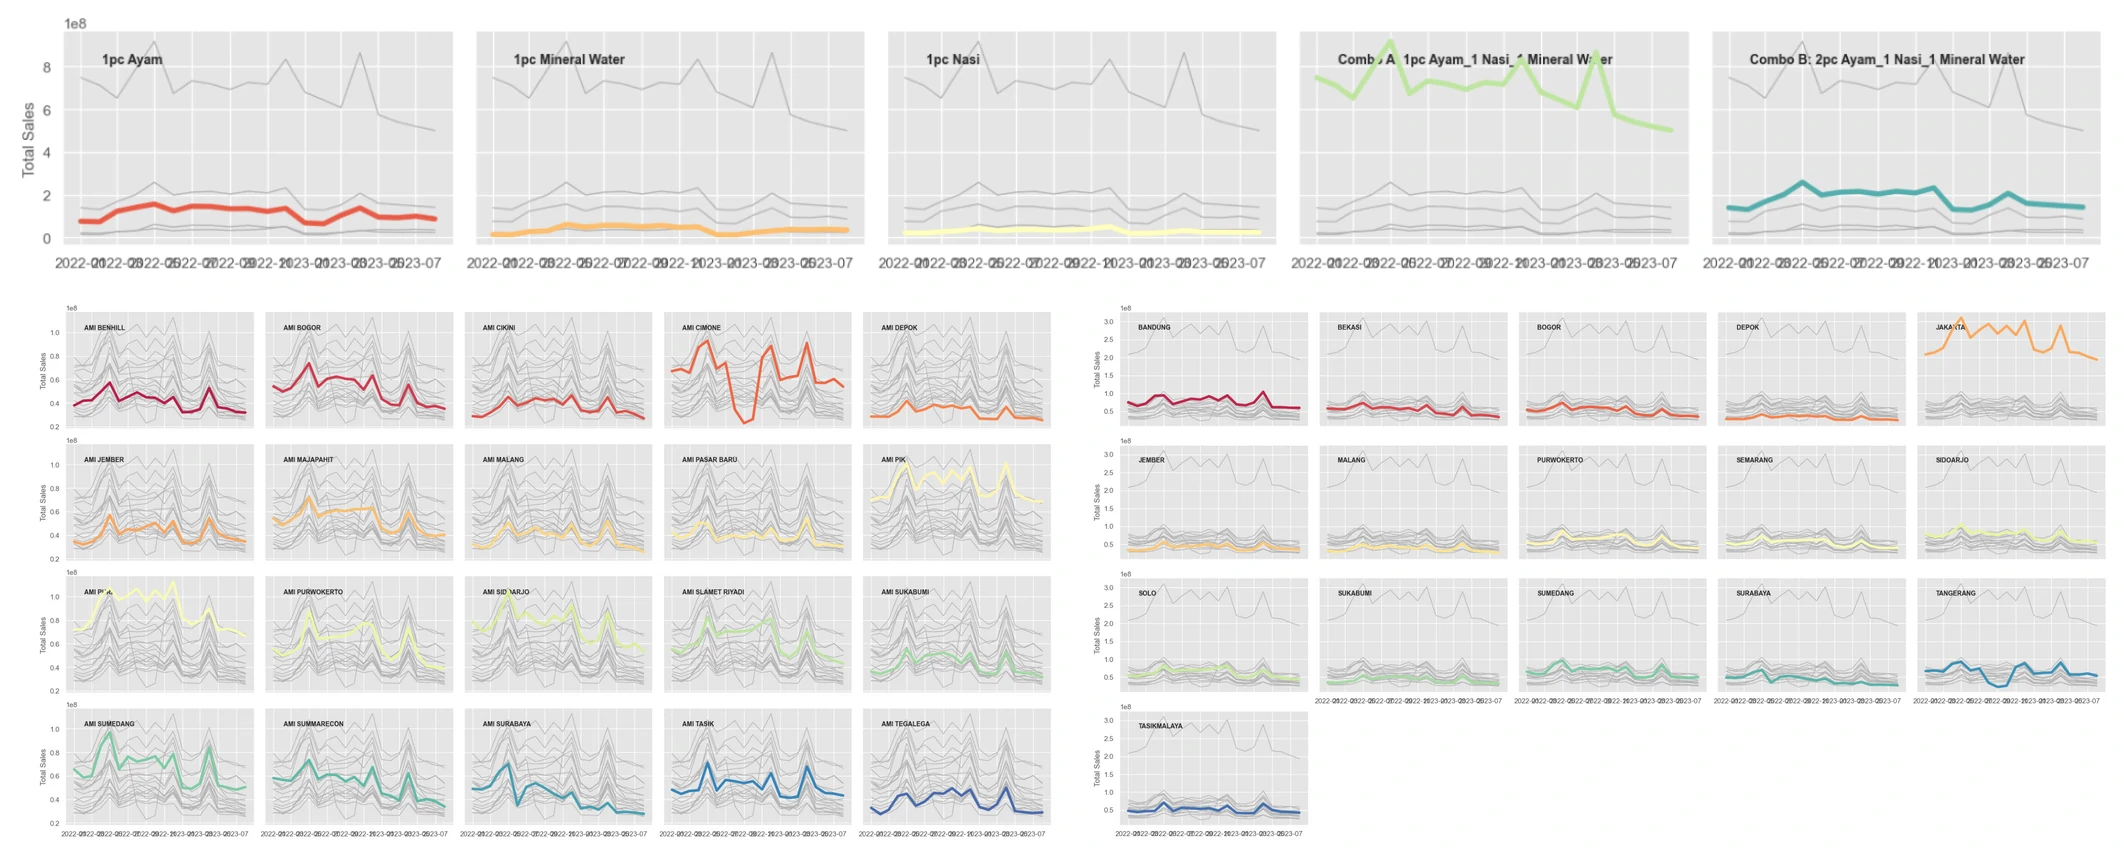
6. Identifying potential shift in consumer behavior.
While overall visualizations may appear cluttered at the outlet level, this breakdown is crucial for identifying localized patterns and uncovering specific drivers behind sales fluctuations.
Key Findings:
- Tangerang Area – Cimone Outlet. A sharp drop in total sales in Tangerang is primarily attributed to the Cimone outlet. This give us a key candidate for further operational or market investigation.
- Dine-In & Takeaway Trends Across Outlets. Most outlets display a consistent, plateaued trend in the Dine-In & Takeaway channel throughout the observed period.
- However, a few outlets—particularly PURI and PIK—showed a notable sales increase in July–August 2023, deviating from the general trend.
- Ojol (Delivery) Channel Behavior. Interestingly, PURI and PIK not only had the highest Ojol sales volume historically but also experienced substantial declines in Ojol transactions during July–August 2023.
- This suggests a potential shift in consumer behavior — possibly from delivery to in-store visits, or an external disruption such as changes in delivery platform policies or customer preferences.
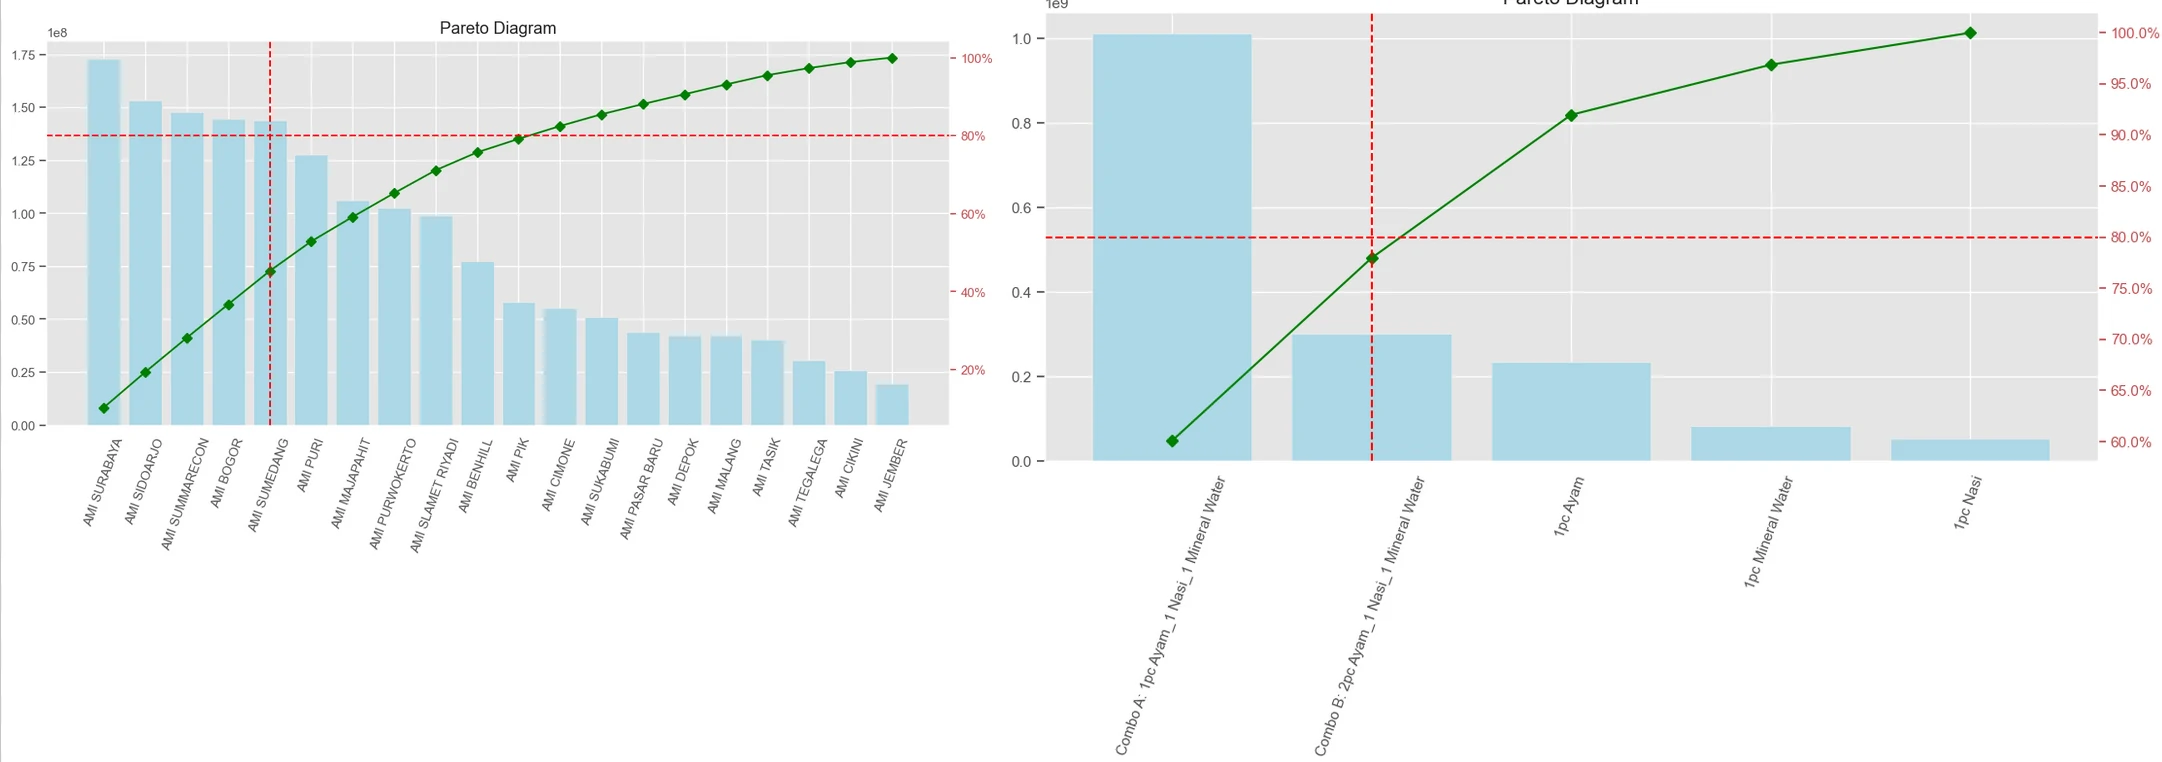
7. Hypothesis: reduction or removal of discounts in ojol channel for Combo A menu
To further enrich our understanding of the sales decline, we analyzed the data at the menu level, examining how different items perform over time across channels.
- Key Findings:
- Combo A (1 pc Ayam, 1 Nasi, 1 Mineral Water) consistently records the highest demand, making it the top-selling item overall.
- Dine-In & Takeaway Channel: Sales patterns across all menu items in this channel remain consistent with overall trends—no major deviations or item-specific performance shifts were detected.
- Ojol (Delivery) Channel: A notable exception was found in the performance of Combo A (1 pc Ayam, 1 Nasi, 1 Mineral Water). This menu item experienced a significant and sharp decline in Ojol sales, unlike other menu items, which followed the general plateaued trend.
- Hypothesis:
- The decline in Combo A sales through the Ojol channel may be associated with a reduction or removal of promotional pricing or discounts offered by the third-party delivery platforms.
- This likely made Combo A less appealing or cost-effective, leading to a drop in customer transactions for this item specifically via Ojol.
Recommendations to Management
To give more data-driven decision
- Product & Menu Optimization
- Rebundle individual items into combos
- Introduce Ojol-exclusive promotions or bundle pricing to leverage high traffic.
- Channel Strategy
- Focus on channel-specific issue, but not fully ignore issue that related to product appeal or demand.
- Maintaining or revitalizing Ojol channel performance will be critical to reversing the downward sales trend
- Answer the hypothesis: reduction or removal of discounts in ojol channel for Combo A menu
- Evaluate Ojol partner promotions especially for combo A menu.
- Consider incentives for Dine-In (e.g., loyalty cards or limited-time in-store menu).
- Outlet & Regional Strategy
- Investigate for less volatility area, which may suggest either less dependence on Ojol channel or greater resilience in mixed-channel performance.
- Replicate JABODETABEK strategies (promotions, packaging, delivery speed) to underperforming regions.
- Consider closing or optimizing low-traffic outlets and re-allocating budgets to high-performing areas.
- Customer Segmentation & Personalization
- Build seasonal strategies and channel-specific recovery campaigns to mitigate post-peak drops.
- Investigate potential shift in consumer behavior.
- Personalize promos
Advance Analytics
Next action items as Data Scientist to give more impact and better decision
By using descriptive and diagnostic analysis at previous slides. We can bring our analysis into more advance and more impactful analysis such as:
- Diagnostic Analysis
- High Revenue but Low Efficiency for each menu items, indicating potential for pricing or bundling optimization.
- Pareto analysis: to focus on impacted area.
- Predictive Analytics
- Forecast what might happen in the future based on historical data and trends
- Find the correlation and causality between some parameters to get more insight and better decision
- Prescriptive Analytics
- Create a recommendation action to improve business outcomes.
- Targeted promo campaigns for ojol channel
- Plan marketing campaigns and Rebundle individual items
- Find and Strengthen in-store experience factors
- Re-evaluate pricing structure to reduce consumer cost sensitivity
- Find the best location for new outlet for other city (sample)
- Optimize outlet location to reduce dependency to ojol channel (sample, sample)
- Create a recommendation action to improve business outcomes.
Pareto analysis
to focus on impacted area
Time-series Analytics
The APP dashboard